Nuevos indicadores técnicos para MetaTrader 4
Reversal Zones Pro is an indicator specifically designed to accurately identify key trend reversal zones. It calculates the average true range of price movement from the lower to upper boundaries and visually displays potential zones directly on the chart, helping traders effectively identify important trend reversal points. ONLY 3 COPIES LEFT OUT OF 10 FOR $50! The price will go up after that. Link to blog: https://www.mql5.com/ru/blogs/post/758908 Key Features:
Reversal Zone Identification:
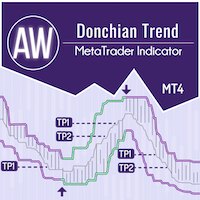
AW Donchian Trend es un indicador de tendencia basado en el canal Donchian. El indicador puede calcular los niveles TakeProfit y StopLoss, tiene estadísticas avanzadas sobre el éxito de las señales, así como tres tipos de notificaciones sobre una señal recibida. Guía de instalación e instrucciones - Aquí / Versión MT5 - Aquí Cómo operar con el indicador: Operar con AW Donchian Trend consta de sólo tres sencillos pasos: Paso 1: abrir una posición Recibimos una señal de compra con un índice

Smart Fibo Zones are powerful, auto-generated Fibonacci Retracements that are anchored to key market structure shifts . These zones serve as critical Supply and Demand levels, guiding you to identify potential price reactions and confirm market direction. Fibonacci calculations, widely used by professional traders, can be complex when it comes to identifying highs and lows. However, Smart Fibo Zones simplify this process by automatically highlighting order blocks and key zones, complete with St

4.8(25 reviews) Rating on gogojungle
【 TrendLinePro2 】 Indicador de ayuda para el trading de líneas MT4 (MetaTrader 4). Es una especificación muy básica que se recomienda para todos, suponiendo que sea fiel a la teoría de Dow. Reconoce tendencias basadas en la teoría de Dow y, además, dibuja automáticamente líneas de soporte, resistencia y tendencia en tiempo real. La precisión es muy alta.
【 Comprobación del comportamiento 】 En Youtube, se sube un video cada fin de semana para conf
RSI Mejorado: Un Indicador Híbrido para un Análisis Técnico Más Profundo El RSI Mejorado es un indicador técnico versátil y personalizable, diseñado para proporcionar a los traders un análisis de mercado más completo y preciso. Al combinar las mejores características de medias móviles, RSI y MACD, este indicador ofrece una visión multidimensional del impulso y la fuerza de una tendencia. Características Principales: Hibridación Perfecta: El RSI Mejorado fusiona las capacidades de las medias móvi
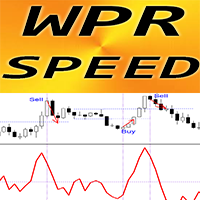
Indicador de Forex "WPR SPEED" para MT4: ¡una excelente herramienta predictiva!
El cálculo de este indicador se basa en ecuaciones de la física. WPR SPEED es la primera derivada del oscilador WPR en sí mismo. WPR SPEED es bueno para las entradas de scalping en mercados laterales y planos. El indicador WPR SPEED muestra la rapidez con la que el propio WPR cambia su dirección: es muy sensible. Se recomienda utilizar el indicador WPR SPEED para estrategias de scalping de impulso: encuentre picos
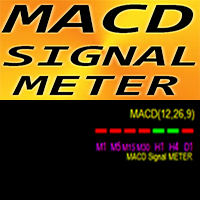
Indicador de Forex MACD Signal METER para MT4
El indicador MACD Signal METER es muy útil y muestra el valor MACD actual (por encima o por debajo de la señal) para 7 períodos de tiempo simultáneamente Cuadro verde: el MACD está por encima de la señal Cuadro rojo: el MACD está por debajo de la señal El indicador de Forex MACD Signal METER se puede utilizar como filtro de entrada de operaciones para operaciones con múltiples períodos de tiempo
// Hay más asesores expertos e indicadores disponi
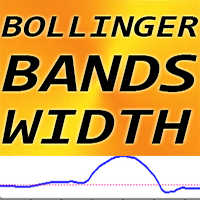
Indicador de Forex Ancho de Bandas de Bollinger para MT4, sin repintado.
-El indicador de Ancho de Bandas de Bollinger se puede utilizar junto con el indicador de Bandas de Bollinger estándar. -Este software es imprescindible para todos los fanáticos de los indicadores de Bandas de Bollinger, ya que su combinación es muy eficiente para operar rupturas. -El indicador de Ancho de Bandas de Bollinger muestra la distancia (intervalo) entre las Bandas de Bollinger.
CÓMO USAR el Ancho de Bandas d
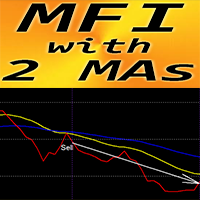
Indicador de Forex "MFI y 2 promedios móviles" para MT4
El índice de flujo de dinero (MFI) es un oscilador técnico que utiliza datos de precio y volumen para identificar zonas de sobrecompra y sobreventa El indicador "MFI y 2 promedios móviles" le permite ver los promedios móviles rápidos y lentos del oscilador MFI El indicador brinda oportunidades para ver el cambio de tendencia muy temprano Es muy fácil configurar este indicador a través de parámetros, se puede utilizar en cualquier marco t
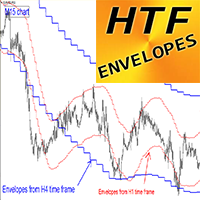
Indicador de Forex "HTF Envelopes" para MT4
Mejore sus métodos de negociación con el HTF Envelopes profesional para MT4. HTF significa: marco temporal superior Envelopes es uno de los mejores indicadores de tendencia del mercado: la herramienta perfecta para operar Se utiliza para ayudar a los operadores a identificar condiciones extremas de sobrecompra y sobreventa, así como rangos de negociación. El indicador HTF Envelopes es excelente para sistemas de negociación de marcos temporales múlti
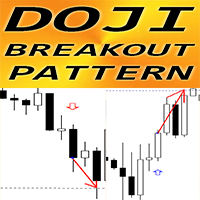
Indicador de Forex "Patrón de ruptura Doji" para MT4
El indicador "Patrón de ruptura Doji" es pura negociación de acción del precio: sin repintado, sin demoras; El indicador detecta la ruptura del patrón Doji en la dirección de la tendencia donde la vela Doji está en el medio del patrón y la última vela es la primera ruptura: Patrón de ruptura Doji alcista: señal de flecha azul en el gráfico (ver imágenes) Patrón de ruptura Doji bajista: señal de flecha roja en el gráfico (ver imágenes) Se in
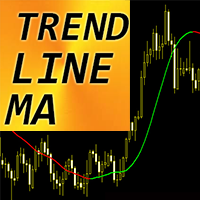
Indicador de Forex "Media móvil de línea de tendencia" para MT4
¡La media móvil de línea de tendencia es la próxima generación de medias móviles! Se utiliza un nuevo método de cálculo avanzado. El indicador muestra tendencias sin demoras. Es mucho más rápido y claro que los indicadores estándar SMA, EMA y LWMA. Hay muchas oportunidades para mejorar incluso las estrategias estándar con este indicador. El color verde significa tendencia alcista. El color rojo significa tendencia bajista.
// M
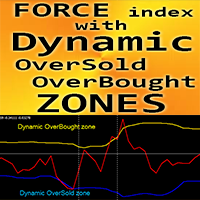
Indicador de Forex "MFI con zonas dinámicas de sobrecompra/sobreventa" para MT4.
El índice de fuerza es uno de los principales indicadores que combina datos de precio y volumen en un único valor. Es ideal para tomar entradas de venta desde la zona dinámica de sobrecompra y entradas de compra desde la zona dinámica de sobreventa. Este indicador es excelente para operar con impulso en la dirección de la tendencia. Zona dinámica de sobrecompra: por encima de la línea amarilla. Zona dinámica de s
The Period Breakout Indicator is a versatile tool designed for traders seeking to identify breakout opportunities based on customizable time periods. This indicator automatically determines the highest and lowest prices within a user-defined period, allowing you to tailor it precisely to your trading strategy. Key Features: Customizable Time Periods: Define the start and end times based on your preferred trading hours or any specific period. The indicator will then calculate the highest and low
FREE

El indicador Escobar Reversal se enfoca en brindar señales únicas de compra y venta inteligentes. Además, obtendrás un nivel de stop loss y varias metas de toma de ganancias para elegir.
Viene con un analizador de tendencias incorporado que se encuentra en el centro, bajo el nombre. Este analizador de tendencias puede ayudarnos a confirmar las entradas y aumentar la precisión.
Ahora recuerda, este puede ser un buen indicador con funciones fáciles para principiantes, pero eso no significa q

!!!The free version works only on "EURUSD"!!! WaPreviousCandleLevels MT4 shows the previous candle levels, it shows the previous candle Open High Low Close levels (OHLC Levels) in different time frame. It's designed to help the trader to analyse the market and pay attention to the previous candle levels in different time frame. We all know that the OHLC Levels in Monthly, Weekly and Daily are really strong and must of the time, the price strongly reacts at those levels. In the technical analys
FREE
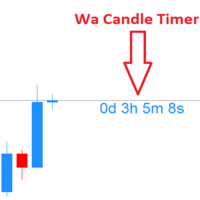
Wa Candle Timer MT4 is an indicator which shows the user how much time is remaining until the next candle will form. When it remains less than 5% before the current candle will be closed, the color of the time changed. These are the settings: 1- Color of Candle Timer when it remains MORE than 5% percentage of current bar to be closed. 2- Color of Candle Timer when it remains LESS than 5% percentage of current bar to be closed. 3- Candle Timer Font Size. 4- Candle Timer font (e.g.: "Arial").
FREE
Triple SD Osc (Triple synthetic digital oscillator) is a tool that allows you to combine into one whole the readings of three popular indicators simultaneously for a comprehensive analysis of price behavior. The user can select three different oscillators from the list of classic oscillators built into the MT4 trading platform and configure each of them separately. The indicator combines the values of user-selected oscillators and builds a synthetic oscillator based on them. To cut off false s
Author's implementation of the classic technical analysis indicator Heiken Ashi. This indicator makes it easier to identify a trend and is the basis of many strategies. At its core, the Heiken Ashi (HA) indicator is just a way to construct a price candlestick chart. In the classic version of the indicator, the opening point of the HA candle is the average value between the opening and closing prices of the previous HA candle, and the closing point of the HA candle is the average value between th

Volume PRO is an innovative and modernized indicator for analyzing trading volumes, which is an advanced version of traditional analysis tools. This high-tech indicator allows traders to effectively monitor trading activity without the need for complex calculations. It displays ticks for the selected time interval corresponding to the selected time frame in the form of a dynamic cumulative histogram, which is updated in real time as new trades are received. Key features: Innovative volume analys
The presented indicator is the author's implementation of the classic Aroon oscillator. The Aroon indicator was developed in 1995 by Indian trader Tushar Chand. Chand's background played a role in choosing the unusual name for the oscillator. "Aroon" is translated from Sanskrit as "Light of the morning". In the proposed version, the indicator is displayed in the form of a familiar oscillator whose values fluctuate around zero. The presented version of the indicator allows you to select the cal
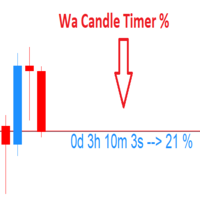
Wa Candle Timer Percentage MT4 is an indicator which shows the user how much time is remaining until the next candle will form. The percentage of the evolution of the current candle is also displayed. The user can set the percentage that the candle timer will change the color. These are the settings: 1- The percentage that the candle timer will change the color. 2- Color of Candle Timer when it's BELOW the percentage set by the user. 3- Color of Candle Timer when it's ABOVE the percentage set b
FREE

The indicator defines the buy and sell arrows with high performance and consistent results. Suitable for trend trading or following the trend. Automatic analysis of market opportunities ; Help traders earn more from their investments;
Never repaints, recalculates or backpaints signals; This is FREE demo version of the indicator and works only on "GBP USD M5" . The demo version does not work on SUFFIX OR PREFIX brokers ! Forex Trend Commander All details about the indicator here :
FREE

WaPreviousCandleLevels MT4 shows the previous candle levels, it shows the previous candle Open High Low Close levels (OHLC Levels) in different time frame. It's designed to help the trader to analyse the market and pay attention to the previous candle levels in different time frame. We all know that the OHLC Levels in Monthly, Weekly and Daily are really strong and must of the time, the price strongly reacts at those levels. In the technical analysis, the user can use them as a support and res
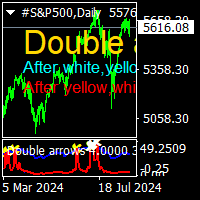
Double arrows indicator is no repaint buy ,sell indicator. suitable for forex and stock markets. it can be used all time frame and all pairs.suitable for beginners and experienced traders. there is white and yellow arrows. after yellow arrows, coming white arrows are strong sell signal. and after white arrows ,coming yellow arrows are strong buy signal. it need minimum 500 bars on chart. cnt number is bars counts.it can be increase acording to bar numbers on charts. minimum value cnt is 500.do n
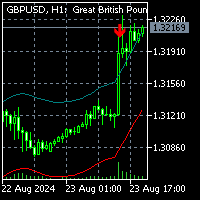
To get access to MT5 version click here . This is the exact conversion from "Nadaraya-Watson Envelope" by " LuxAlgo ". (with non-repaint input option) This is not a light-load processing indicator if repaint input is set to true . All input options are available. Buffers are available for processing in EAs. I changed default input setup to non-repaint mode for better performance required for mql market validation procedure . Here is the source code of a simple Expert Advisor operating

MT4 is a Histogram version of MT5: https://www.mql5.com/en/market/product/122151 Introducing Trade Sniper: Your Edge in the Markets. Tired of missing profitable trades or getting caught on the wrong side of the market? Meet Trade Sniper, the cutting-edge indicator that harnesses the power of trends to give you a razor-sharp advantage in your trading. Trend Sniper is not just another run-of-the-mill indicator. It's a sophisticated tool that combines advanced algorithms with time-tested trading
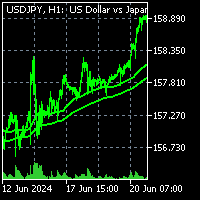
To get access to MT5 version please click here . This is NOT EXACT CONVERSION from TradingView: " Liquidity Weighted Moving Averages" by "AlgoAlpha ". However you may find the signals and lines close enough to its original version.
This is a light-load processing and non-repaint indicator. All input options are available expect time frame input . Buffers are available for processing in EAs. You can message in private chat for further information/changes you need. Thanks for downloading
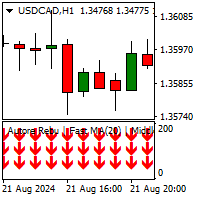
The MovingAverageTrends Indicator is a technical analysis tool designed to identify the overall market direction and provide buy or sell signals. The indicator uses three moving averages, where different periods can be set. How It Works Bullish Conditions: The indicator shows three green upward arrows when all three moving averages are trending upwards. This signal suggests that the market is in a bullish phase, and it could be a good time to enter a long position. Bearish Conditions: The indica
Just a simple arrow indicator for helping with entries
Just load on the chart with no settings to confuse
Wait for current bar to close to lock arrow in place
The color and size of the arrow can be adjusted
The indicator can be used with any pair or any timeframe - Forex, crypto .....
Better to trade with the bigger timeframe trend
------------------------------------------------------------------------
The indicator system plots key levels automatically for multiple forex pairs.
It also provides candle color to help with direction
Best on GBPUSD and EURUSD - H1
JPY pairs on 15m
To deactivate a level, just select color none.
Best to use with my indicator Arrow X - See second screenshot
The color, line style and thickness can be adjusted as preferred.
Symbol: Most forex pairs Timeframe: Depends on pair chosen
Enjoy! ------------------------------------------

Session Standard Deviation Date Range Analyzer: Evaluate the standard deviation of each bar's price (high, low, close, open, weighted, median, and typical) within defined trading sessions and date ranges, providing detailed insights into price volatility and market behavior. **Note:** When the trading platform is closed, the indicator may not load correctly. To ensure it works, you may need to load the indicator, unload it, and then load it again. **Note:** This indicator can only be used with
FREE
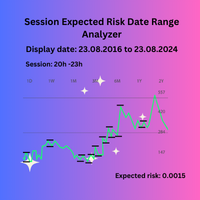
Session Expected Risk Date Range Analyzer: Analyzes price data across specified date ranges to provide detailed insights into financial risk and volatility, using each bar's price metrics for accurate risk assessment.
The Session Expected Risk Date Range Analyzer is a sophisticated tool designed to offer traders and analysts detailed insights into the expected financial risk across specific date ranges. Unlike traditional session-based analysis, this indicator focuses on calculating risk met
FREE
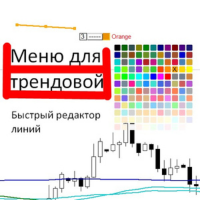
Выпадающее меню для трендовых линий и прямоугольника. Позволяет редактировать цвет, стиль и толщину. При выделении линии появляется меню, каждая функция разделена. Можно сразу нажать и поменять на нужное. Толщина меняется по другому, нужно нажать на цифру, она станет в синем цвете, нажать нужную цифру от 1 до 4, в зависимости от нужной толщины, нажать интер.

Super Reversal Pattern Indicator
Unlock the power of advanced pattern recognition with our Super Reversal Pattern Indicator. Designed for traders seeking precision and reliability, this indicator identifies one of the most effective reversal patterns in technical analysis, offering a significant edge in your trading strategy. Key Features: Non-Repainting Accuracy: Enjoy the confidence of non-repainting technology. Once a Super Reversal Pattern is detected, it remains static, providing consis

Domina el poder del trading con tendencias
Este indicador está diseñado para traders de todos los niveles: principiantes, intermedios y profesionales. Simplifica el proceso de trading al identificar con precisión la tendencia real en cualquier par de divisas.
¿Por qué elegir este indicador?
- Trading sencillo: Ya no necesitas realizar análisis complicados. Simplemente carga el indicador en el gráfico, espera las señales de compra o venta, y olvídate de estar pegado a la pantalla todo el d

SENSE es un sistema automatizado que combina métodos GANN seleccionados con cálculos fractales. El sistema nos dice dónde abrir y cerrar operaciones. Ya no es necesario perder tiempo en cálculos complejos: SENSE lo hace todo por usted. Sólo tiene que instalar el indicador.
Principios básicos:
El mercado es alcista cuando el precio está por encima de las líneas blancas.
Compre por encima de las líneas blancas, pare por debajo Las líneas verdes son objetivos alcistas El mercado es bajista c
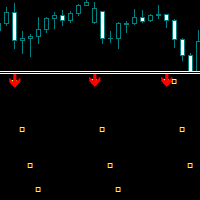
Un indicador técnico diseñado específicamente para el especulación que puede identificar impulsos de volatilidad y mostrar su duración.
Tiene parámetros flexibles para la configuración manual, lo que le permite aplicar la funcionalidad del indicador a cualquier instrumento comercial.
Los plazos recomendados para utilizar son M5, M15, M30, H1 y H4.
Hay varios tipos de alertas.
Todas las señales nunca cambian ni cambian de color al cierre de la vela.
El indicador está configurado por paráme

Volume Break Oscillator es un indicador que combina el movimiento de precios con las tendencias de volumen en forma de oscilador.
Quería integrar el análisis de volumen en mis estrategias, pero siempre me han decepcionado la mayoría de los indicadores de volumen, como OBV, Money Flow Index, A/D, pero también Volume Weighted Macd y muchos otros. Por lo tanto, escribí este indicador para mí mismo, estoy satisfecho con su utilidad y, por lo tanto, decidí publicarlo en el mercado.
Característic
La Herramienta Definitiva para Ajustar Medias Móviles
Esta es una herramienta avanzada diseñada para simplificar y optimizar la configuración de tu Media Móvil. Con MA Tuner, puedes ajustar fácilmente parámetros clave (Período, Desplazamiento, Método y Precio) a través de un panel fácil de usar y acceder instantáneamente a estadísticas detalladas sobre la frecuencia con la que las velas cruzan la línea MA y sus posiciones de apertura y cierre en relación con ella.
¿Por qué es mejor que el in
FREE
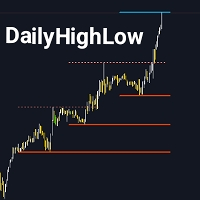
El indicador DailyHighLow está diseñado específicamente para la plataforma MetaTrader 4 (MT4) y tiene como objetivo ayudar a los traders a seguir las fluctuaciones diarias de precios. Este indicador traza automáticamente líneas de tendencia basadas en los precios más altos y más bajos de un período personalizado, proporcionando una asistencia visual clara para los traders que necesitan información precisa del mercado. Características Principales: Personalización de Líneas de Tendencia: Ajusta el
FREE
¿Qué es "Real Time MultiIndicator"? "Real Time MultiIndicator" es una herramienta de trading avanzada diseñada para simplificar y optimizar tu análisis técnico. Este indicador revolucionario recopila señales de múltiples marcos de tiempo e indicadores técnicos, mostrándolos en una sola tabla clara y fácil de leer. Si deseas una visión completa y detallada del mercado sin tener que cambiar constantemente de gráfico o analizar manualmente cada indicador, "Real Time MultiIndicator" es la solución i
DESCUENTO DE 77,90 USD A 37,90 USD, VÁLIDO HASTA EL DOMINGO 1 DE SEPTIEMBRE ¿Qué es "Forex Scanner"? "Forex Scanner" es una poderosa herramienta de trading diseñada para proporcionarte una visión completa del mercado Forex en tiempo real. Este avanzado indicador recopila datos clave de múltiples indicadores técnicos y marcos temporales, lo que te permite identificar rápidamente oportunidades de trading. Si deseas monitorear numerosos activos y parámetros sin tener que cambiar de un gráfico a otr
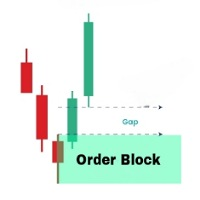
OrderBlock Analyzer es un indicador personalizado para MetaTrader 4 (MT4) diseñado para detectar y resaltar bloques de órdenes (Order Blocks) en los gráficos de precios. Este indicador ayuda a los traders a identificar estructuras clave del mercado, señalando posibles áreas de reversión o continuación. Basado en el comportamiento del mercado, OrderBlock Analyzer dibuja automáticamente los bloques de órdenes y distingue los bloques alcistas y bajistas mediante colores. Características principales
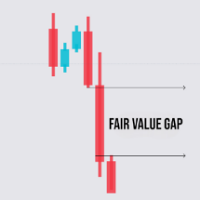
FVG Analyzer es un indicador personalizado para MetaTrader 4, diseñado para identificar y resaltar los huecos de valor justo (Fair Value Gaps, FVG) en los gráficos de precios. Esta herramienta ayuda a los traders a detectar áreas donde han ocurrido huecos de precio, proporcionando soporte para oportunidades potenciales de trading basadas en estos huecos. Características Principales: Detección de FVG : FVG Alcista : Identifica huecos alcistas donde el precio máximo de la vela siguiente es inferio
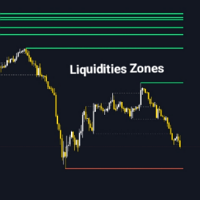
El Liquidity Zone Detector es un indicador técnico avanzado diseñado para identificar y destacar las zonas clave de liquidez en el mercado utilizando el indicador ZigZag. Esta herramienta localiza los niveles de precios donde es probable que exista una liquidez significativa trazando líneas de tendencia en los máximos y mínimos detectados por ZigZag. El Liquidity Zone Detector ayuda a los traders a identificar posibles áreas de reversión o continuación de tendencia basadas en la acumulación o li
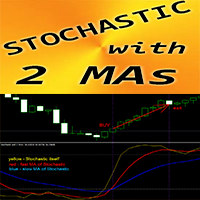
Indicador Forex "Estocástico y 2 medias móviles" para MT4
El oscilador estocástico es uno de los mejores indicadores del mercado y es una herramienta perfecta para muchos traders. El indicador "Estocástico y 2 medias móviles" le permite ver las medias móviles rápidas y lentas del oscilador estocástico Zona de sobrecompra: por encima de 80; Uno sobrevendido: menos de 20 Es fantástico aceptar entradas de venta de zonas superiores a 80 y entradas de compra de zonas inferiores a 20. Puedes ver la

Indicador Forex "Niveles de resistencia de soporte" para MT4
El indicador "Niveles de resistencia de soporte" es un indicador auxiliar muy útil para el comercio. 'Soporte' y 'Resistencia' son zonas importantes en el gráfico respetadas por el precio El nivel de soporte es donde el precio regularmente deja de caer y vuelve a subir. El nivel de resistencia es donde el precio normalmente deja de subir y vuelve a bajar. El indicador "Niveles de resistencia de soporte" muestra los niveles recientes
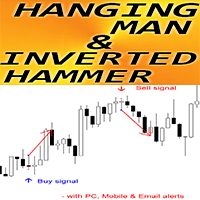
Indicador de Forex "Patrón de hombre colgado y martillo invertido" para MT4
El indicador "Patrón de hombre colgado y martillo invertido" es un indicador muy potente para operar con Price Action: no se repite el proceso ni se producen retrasos; El indicador detecta patrones de martillo invertido alcistas y de hombre colgado bajistas en el gráfico: Martillo invertido alcista: señal de flecha azul en el gráfico (ver imágenes) Hombre colgado bajista: señal de flecha roja en el gráfico (ver imágen
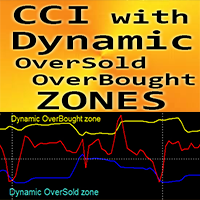
Indicador de Forex "CCI con zonas dinámicas de sobrecompra/sobreventa" para MT4.
El índice de canal de productos básicos (CCI) es excelente para operar con momentum en la dirección de la tendencia. Es ideal para tomar entradas de venta desde la zona dinámica de sobrecompra y entradas de compra desde la zona dinámica de sobreventa en la dirección de la tendencia principal. Este indicador también es excelente para combinarlo con entradas de acción del precio. Zona dinámica de sobrecompra: por e
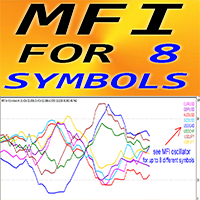
Indicador de Forex "MFI para 8 símbolos" para MT4.
El índice de flujo de dinero (MFI) es un oscilador técnico que utiliza datos de precio y volumen para identificar zonas de sobrecompra y sobreventa. Es ideal para tomar entradas de venta desde sobrecompra cuando el MFI está por encima de 80 y entradas de compra desde sobreventa cuando está por debajo de 20. El MFI es muy útil para la detección de divergencias y también es ideal para combinarlo con la acción del precio. "MFI para 8 símbolos" b

This indicator is not a guarantee of profitability but is designed to provide valuable insights and reduce the time spent analyzing charts, allowing you to focus on what matters most—your time.
The "Candle Info" indicator is designed to analyze and display specific candle formations directly on the chart within MetaTrader 4 (MT4). The indicator provides traders with visual cues about market sentiment by identifying various candle formations, such as Higher Highs, Lower Lows, Higher Lows, and
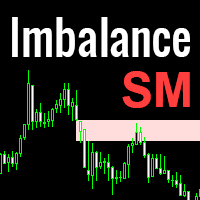
Imbalance is one of the important zones on the chart, to which the price will always strive to cover it. It is from the imbalance zone that the market most often makes significant reversals, rollbacks and gives entry points that you can successfully trade. In the Smart Money concept, the imbalance zone is used to find an entry point, as well as a place for take profit at the level of imbalance overlap by the price. Until the imbalance is overlapped, it is the closest target for the price. Ho
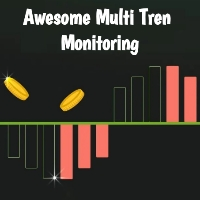
This indicator was created based on a multi-time trend monitoring system by combining several trend signals into 1 signal in the panel. This indicator is also equipped with an alert feature. Try to master how to reveal Fibo Weasel Candle Break Reetes to make it easier to use this indicator. for entry we only monitor the signal in the top left corner for the ongoing trend as a trading reference For the risk reward reference, we use the Fibo Weasel withdrawal reference which is in the same direct
FREE
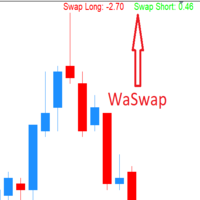
WaSwap MT4 Indicator shows the current Swap Long and current Swap Short with color.
* Set the Swap Threshold and the color to identify when the current swap is below or above the Spread Threshold.
* Set X axis and Y axis and chose the Corner and the Anchor to position the Swap Label on the chart.
* Write the font and the font size for more confort.
* Activate alert if the current Swap Long or the current Swap Short is below the swap threshold.
* The user will never swing with a negati
FREE
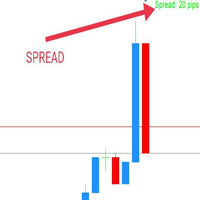
WaSpread MT4 Indicator shows the current spread in pips with color.
* Set the Spread Threshold and the color to identify when the current spread is below or above the Spread Threshold.
* Set X axis and Y axis and chose the Corner and the Anchor to position the Spread Label on the chart.
* Write the font and the font size for more confort.
* Activate alert if the current spread is above the spread threshold.
* For more precision, the user can choose to show the decimal numbers.
* The
FREE
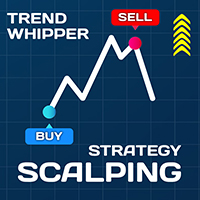
A Full Concept of BUY/SELL Scalping Strategy Trend detection is one of the basic challenges of every trader. Finding a way to tell when to enter a trade is very important, timing is a game changer, not too early and not too late. Sometimes, due to not knowing the market conditions, the trader closes his positions with a small profit or allows the losses to grow, these are the mistakes that novice traders make. Indicator Trend Whipper is a complete trading strategy and can improve the trader's tr

The indicator monitors price movements in relation to a dynamic trailing stop line derived from the Average True Range (ATR). The trailing stop line adjusts based on market volatility, with the ATR determining the distance of the stop from the current price. This allows the stop to widen during periods of high volatility and tighten during calmer market conditions. The indicator tracks how the price interacts with this trailing stop line, marking potential reversal points when the price crosses
FREE

Divergence Divergence refers to when the price of a currency pair moves in one direction while the trend indicator is moving in the opposite direction. With divergence, there can be positive and negative signals. Divergences in Forex trading are quite common signals of technical analysis. These are basic early Forex signals indicating the trend reversal and filter false signals. Application of this indicator It is usually not easy to detect divergences by the trader and it may be time-consuming

he "Super Trampoline" is an innovative trading indicator designed to simplify decision-making in financial markets. It analyzes chart data and provides clear and timely signals on when to buy or sell an asset, based on a proven strategy of candlestick pattern analysis. Product Advantages: Intuitive Interface : "Super Trampoline" integrates directly into your trading terminal, displaying signals as simple arrows on the chart. This means you don't need deep technical analysis knowledge to start us

Introducing "Super Transplant with Filter" — a game-changing tool for traders who value precision, reliability, and simplicity. This indicator combines advanced trend analysis techniques with intelligent signal filtering, allowing you to make decisions based on the most relevant data. Benefits of "Super Transplant with Filter": Accuracy in Every Trade : The indicator meticulously analyzes market data, identifying key trends while filtering out false signals. This enables you to make more informe
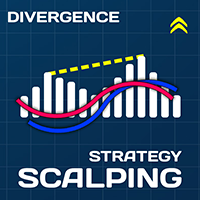
MACD Indicator The Moving Average Convergence and Divergence (MACD) is a trend following momentum indicator which shows the relationship between two moving averages that we chose and configure them on the indicator. The MACD is calculated by subtracting the 26-period exponential moving average and the 12 period D.A.M. These are the default parameters when you put the MACD indicator on the charts, and the period is usually 9 which means the last 9 candles. DT-Oscillator This is Robert C. Miner's
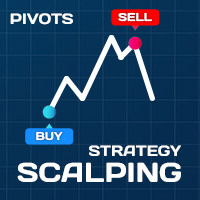
Scalping Strategy BUY SELL
Having a strategy in the market is one of the main conditions for trading. The presence of various and complicated indicators and tools sometimes makes trading difficult, and the user gets confused after trying various methods and gets stuck in a loss cycle, the result of which is usually clear. This indicator is a simple strategy based on the detection of pivots and short-term trends, which helps you to easily trade in trends. Sometimes a simple but efficient st

Adjustable Consecutive Fractals looks for 2 or more fractals in one direction and sends out a on screen alert, sound alert and push notification, for strong reversal points .
Adjustable Consecutive Fractals, shows the fractals on chart along with a color changing text for buy and sell signals when one or more fractals appear on one side of price.
Adjustable Consecutive Fractals is based Bill Williams Fractals . The standard Bill Williams fractals are set at a non adjustable 5 bars, BUT withe

The Binary Profit Maker,
This indicator works on MT4 and is very easy to use. When you receive a signal from it, you wait for that candle with the signal to close and you enter your trade at the beginning of the next new candle . A Up Purple arrow means Buy and a Down Purple arrow means Sell. All arrows comes with Alert like for easy identification of trade signal. Are you okay with that?
How To Enter Trade?
1 minute candle
1 minute expire

This indicator/dashboard , is place on a single symbol. It shows the percentage of movement withing all time frames from M1 to W1.The text will change green if all % are in the positive for a buy signal.The text will change red if all % are below zero and in negative for a sell signal. There are audible notifications, as well as on screen notifications along with push notifications that can be turned on and ON/OFF in the settings.
This is a sure way to Find trends quickly and efficiently, with
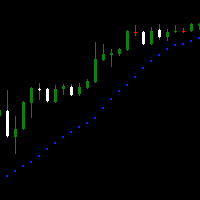
Доброго времени суток.
Вашему вниманию простой, но крайне удобный продукт для любителей индикатора Parabolic SAR . Он представляет собой окно осциллятора, на который выводится несколько тайм-фреймов в режими реального времени вместе с индикатором.
Настройки интуитивно понятные, что бы включать и отключать количество выбранных таймов - необходимо применять PERIOD_CURRENT, в таком случае дополнительный тайм не откроется.
Пишите в комментариях к продукту, что бы вы хотели увидеть в новых вер
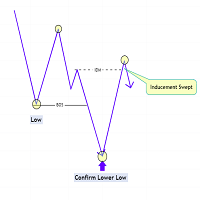
The Market Structure with Inducements & Sweeps indicator is a unique take on Smart Money Concepts related market structure labels that aims to give traders a more precise interpretation considering various factors.
Compared to traditional market structure scripts that include Change of Character (CHoCH) & Break of Structures (BOS) -- this script also includes the detection of Inducements (IDM) & Sweeps which are major components of determining other structures labeled on the chart.
SMC &
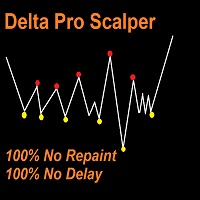
Delta Pro Scalper - Your Ultimate Trend Trading Solution, Delta Pro Scalper is a TREND indicator that automatically analyzes the market and provides information about the trend without redrawing or delay.
The indicator uses candlestick OHLC data and analyzing them to determine up trend or down trend, You MUST wait till closing candle, once the dot appear the next open candle you can open buy or sell position.
Red Dot = Bearish Trend (Open SELL)
Yellow Dot = Bullish Trend (Open BUY)
Here's t

Señal de Bomb Bank: su indicador de confianza en MetaTrader 4
Bomb Bank Signal es un poderoso indicador para MetaTrader 4, diseñado para identificar las tendencias más relevantes en el mercado financiero. Si buscas una herramienta que anticipe los movimientos con precisión, el Bomb Bank es el aliado que necesitas.
Cómo funciona:
Este indicador combina tres métodos distintos (análisis de volumen, cierre de velas y tendencia simétrica) para detectar y señalar oportunidades de compra y venta
123456789101112131415161718192021222324252627282930313233343536373839404142434445464748495051525354555657585960616263646566676869707172737475767778798081828384858687888990919293949596979899100101102103104105106107108109110111112113114115116117118119120121122123124125126127128129130131132133134135136137138139140
El Mercado MetaTrader es la única tienda donde se puede descargar la versión demo de un robot comercial y ponerla a prueba, e incluso optimizarla según los datos históricos.
Lea la descripción y los comentarios de los compradores sobre el producto que le interese, descárguelo directamente al terminal y compruebe cómo testar el robot comercial antes de la compra. Sólo con nosotros podrá hacerse una idea sobre el programa, sin pagar por ello.
Está perdiendo oportunidades comerciales:
- Aplicaciones de trading gratuitas
- 8 000+ señales para copiar
- Noticias económicas para analizar los mercados financieros
Registro
Entrada
Si no tiene cuenta de usuario, regístrese
Para iniciar sesión y usar el sitio web MQL5.com es necesario permitir el uso de Сookies.
Por favor, active este ajuste en su navegador, de lo contrario, no podrá iniciar sesión.