Nuevos indicadores técnicos para MetaTrader 4 - 38
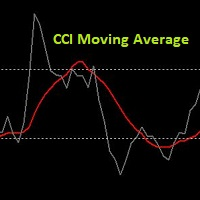
It's a very simple indicator. This is simply the CCI moving average. The CCI Moving Average Indicator allows us to reduce false signals and optimize our trading. The required indicator inputs are: CCI Period, CCI Applied Price, Period of CCI Moving Average and Method of CCI Moving Average. The chart displays the original CCI and its moving average. This is my first indicator that I publish. I hope the indicator will benefit you. The author of this indicator is Tomasz Buliński.
FREE
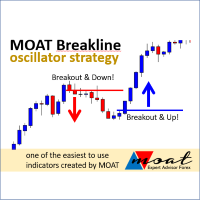
The indicator will provide a breakout line or price stop guide, we recommend M5 or H1 timeframes. Trade signal: Buy Signal: if the closed price (according to the timeframe) breaks the blue line and is already above it or if the lowest price stops above the red line. Sell Signal : if the closing price (according to the timeframe) breaks the red line and is already below it or if the highest price stops below the blue line. Feature: You will get time (hours) and price values for the lines

Indicador de scalping 2 en 1. Comprando este indicador, ¡te llevas de regalo un robot automático! Sistema automático de búsqueda de puntos de inversión de precios. El indicador con puntos en el gráfico de un par de divisas muestra los posibles puntos de reversión del movimiento de precios. Un punto rojo indica una inversión del movimiento hacia abajo y un punto azul indica una inversión en el movimiento del precio hacia arriba. El indicador es excelente para el comercio intradía utilizando una
Muestra puntos de reversión de precios en el gráfico. Trabaja en un período de 1 minuto. La flecha roja indica que el precio bajará ahora y la flecha azul muestra que el precio subirá ahora. La precisión de las señales es de hasta un 93% según el par de divisas. Funciona en todos los pares de divisas, incluidos los metales oro y plata. El indicador analiza la posición del precio actual en relación con el rango de precios durante un cierto período en el pasado. El indicador optimiza sus datos us

SI USTED COMPRÓ EL INDICADOR -> ¡Envíeme un mensaje para obtener parámetros de configuración adicionales que FUNCIONEN! y TACTICAL TREND EA gratis! El INDICADOR DE TENDENCIA TÁCTICA es el mayor indicador de tendencia del mercado; funciona en todos los marcos de tiempo y activos y fue creado después de 6 años de experiencia en FX y otros mercados. Muchos indicadores de tendencia en Internet están incompletos, no ayudan y son difíciles de negociar, pero el indicador de TENDENCIA TÁCTICA es difere

Moving Average Trend Alert is a triple MA indicator that helps traders to identify potential market trends based on 3 MAs alignment and crossover.
Moving Average Trend Alert features: Customizable short-term, medium-term, and long-term MAs. Option to filter signals based on a minimum distance between moving averages to avoid premature MAs alignment. Optional Filter of signals with RSI indicator overbought/oversold levels. Optional Filter of signals with ADX indicator. Popup, email, and phone n
FREE
This indicator is based on the idea of a popular Trend Trigger Factor indicator (TTF). The indicator determines a price movement direction comparing high and low of the current candle with high and low of a price for a longer period.
The indicator parameters: Long_TTF_Bars - number of candles to calculate the price movement direction for a longer period of time (cannot be less than 2) Short_TTF_Bars - number of candles to calculate the price movement direction for a shorter period of time (can
FREE

The Qv² Histogram - Indicator developed for traders with advanced experience. This indicator has two purposes: 1-) Identify price normality patterns (green color) 2-) Identify abnormal price patterns “outliers” (red color) ====================================================================================================================================== Interpretation for trades in start trend: Histogram (Green color) crossing the zero line upside - uptrend. Histogram (Green color) crossing th

This indicator is developed based on the multiple session trading to aid in analysis for all the day traders. The indicator supports all currency pairs as well as other trading instruments like indicies, commodities, metals ,etc. The way the indicator work is by making analysis on your behalf. During asian session that's when the indicator does the calculations and provided trading plans in form of areas on the chart for the current day. And this process happens everyday which allows for hands f

Emini Signal Bar
Price - Promotion: $100 - Normal Price: $200
Symbol Recommended - S&P 500 Index / US500
Timeframe - 5 minutes Buffer Information - Buy Trade Buffer = 2 - Sell Trade Buffer = 3 Main features - Show Buy Signal Bar and Sell Signal Bar on Live Chart. - Get Alert from signal bar. - The precision of the Alert is superior to dots. (Alert is active at that time) - Dots will be recalculated after reset the properties. After the Alert is displayed, kindly make your decisions to tra
To download MT5 version please click here . - This is the exact conversion from TradingView: "Linear Regression Candles" By "ugurvu". - This is a non-repaint and light processing load indicator - You can message in private chat for further changes you need. This is a sample EA code that operates based on bullish and bearish linear regression candles . #property strict input string EA_Setting= "" ; input int magic_number= 1234 ; input string Risk_Management= "" ; input double fixed_lot_size=

GMMA indicator that looks like a cloud. The GMMA indicator is easy to read, but to make it even more visually pleasing, we made it look like an Ichimoku Chart cloud. Colors have been changed where short-term and long-term overlap.
My other products https://www.mql5.com/ja/users/studiotam/seller
Please reduce the character limit a bit. I have nothing more to write.
FREE
This indicator is intended to help traders to see today's daily range compared to the average daily range. You can change the number of days for the average daily range otherwise you can use 20 as the default. The % Reach will give info about the progress today's range toward the average daily range. Breakout traders, or pullback traders normally will look at base area, in which they might want to know the average daily range as comparison.
The indicator has color code green and red, where th

Un Gap ocurre cuando el precio se mueve con "fuerza" en una direccion dada (arriba o abajo). El Gap se forma cuando, cuando se ven tres candelas consecutivas, la cola de la primera y tercera candela no se interceptan. Cuando esto ocurre, el indicador crea un rectangulo donde el Gap se encuentra. Identifica una zona donde el precio tiene el potencial de regresar (mitigación). El Gap o rectantugo es mitigado cuando el precio vuelve y cubre completamente el rectangulo. Note que tambien el indicado
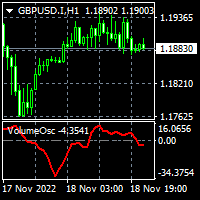
To download MT5 version please click here . The Volume Oscillator measures volume by analyzing the relationship between two Moving Averages. The Volume Oscillator indicator subtracts a fast MA from slow MA. The fast and slow MA periods are configurable via input tab. Volume indicators are an ingredient of trading systems to avoid entry in thin liquidity markets. Having set a threshold on Volume Oscillator you can avoid entering chop. Buffers are available to access via EA.
FREE
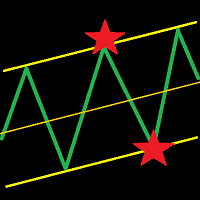
This indicator draws a trend line and a trend tunnel on the chart. You can choose several calculation methods, alerts, notifications, and other settings. It can also draw trendlines from another TimeFrame. You can also use this indicator for your ExpertAdvisor. The current values of the lines are stored in the memory buffer from where the EA can load them. You can trade the price bounce from the upper and lower lines . Settings TimeFrame – trend timeframe Description – show description of line
To download MT5 version please click here . Metatrader users are limited to few moving average types. Therefor I decided to create a package consisting of all MAs I knew. This package suggests 12 different types: { SMA, EMA, DEMA, TEMA, WMA, VWMA, SMMA(RMA), HullMA, LSMA, ALMA, SSMA, TMA } You can configure them via input tab. This is a non-repaint indicator with light load. To implement them I referred to standard libraries of pine script.
FREE

Easy to use indicator that will help you place your pending and market orders with great accuracy. The indicator plots the order blocks based on how price reacts to current market structure. These key levels represent supply and demand zones and the Smart Blocks Trading System indicator uses price to assess whether an asset is being accumulated or distributed. It can be used on any financial instrument, and on any given time frame.
BoS stands for Break of (market) Structure. The blue and red

This indicator easily calculates the reward to risk ratio and indicates the stop out level and take profit limit with graphical boxes. Also shows the reward steps with fibonacci levels without changing the fibonacci default levels, this is a lot useful for people who use fibonacci retracement. Very user friendly interface and easily to use with graphical buttons.
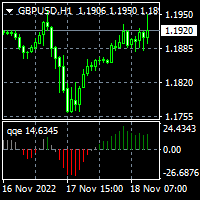
To download MT5 version please click here . - This is the exact conversion from TradingView: "QQE mod" By "Mihkel00". - It can be used to detect trend direction and trend strength. - Gray bars represent weak trends. You can set thresholds to achieve better accuracy in detecting trend strength. - There is buffer index 15,16,17 to use in EA for optimization purposes. - The indicator is loaded light and non-repaint. - You can message in private chat for further changes you need.

To download MT5 version please click here . This is the exact conversion from TradingView: "WaveTrend [LazyBear]" By "zeusuk3". One of the coolest indicators out there to detect overbought and oversold zones. It can be used as a part of more complicated strategy and for confirming a potential trade setup. There are buffers to use in EAs also. The indicator is loaded light and non-repaint. - You can message in private chat for further changes you need. Thanks for downloading

The Hurricane Cave Indicator shows different trade areas based on price action. It looks in the past and works out patterns that can enforce support and resistance as targets. When price breaks out of a trade area you can target just inside the next trade area. If you can't see the target just go to a slower time frame, it means the price hasn't been there for a long time. The Hurricane Cave Indicator is designed to be an add on to The Hurricane Forex Indicator also available in the Meta Trader
FREE
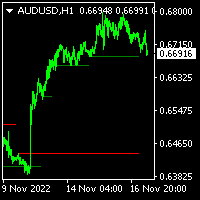
A simple and precise Indicator to identify potential supply and demand zones for price reversals. It was first described in Jason Pearl's Book, " Demark Indicators", published in 2008. It can be used both as Support and Resistance, and can be traded as a Breakout or as a Fakeout, depending on your trading style, and depending on how the candle was closed in proximity to TDST.
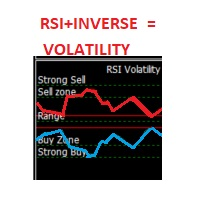
This indicator is an oscillator that shows the RSI (Relative Strength Index) in red and its inverse graph in a light green. Together this shows the volatility of the market (in its default setting). You can also change it to show only the RSI graph. It also gives you the possibility to change its Period. The oscillators zones (80,70,50,30,20) are marked by Strong Sell, Sell Zone, Range, Buy Zone, and Strong Buy respectively.

Scalper Vault es un sistema profesional de reventa que le brinda todo lo que necesita para una reventa exitosa. Este indicador es un sistema comercial completo que puede ser utilizado por operadores de divisas y opciones binarias. El marco de tiempo recomendado es M5. El sistema le proporciona señales de flecha precisas en la dirección de la tendencia. También le proporciona señales superiores e inferiores y niveles de mercado de Gann. Los indicadores proporcionan todo tipo de alertas, incluidas
ICT Template Indicator visualizes and automatically updates all important ICT elements for Scalpers, Day and Swing traders. It allows you too keep your chart clean and bring any elements by just one click to the side buttons. Thanks to mobile notifications on external liquidity levels, you will not miss any opportunity and you don't have to sit behind the screens whole day. Each element has fully customizable colours, width, line types, max timeframe to be shown etc... so you can really tweak y

Versión MT5 | FAQ El Indicador Owl Smart Levels es un sistema comercial completo dentro de un indicador que incluye herramientas de análisis de mercado tan populares como los fractales avanzados de Bill Williams , Valable ZigZag que construye la estructura de onda correcta del mercado y los niveles de Fibonacci que marcan los niveles exactos de entrada. en el mercado y lugares para tomar ganancias. Descripción detallada de la estrategia Instrucciones para trabajar con el indi
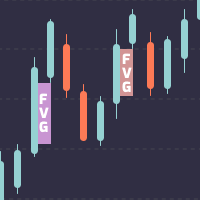
Indicador de brecha de valor razonable para MetaTrader 4.
Una brecha de valor razonable es un patrón de acción del precio de tres velas enseñado por el famoso comerciante de dinero inteligente, el comerciante del círculo interior, también conocido como ICT. Básicamente, es una brecha que queda abierta en el gráfico cuando el precio se mueve demasiado rápido. Es un área del cuerpo de la vela del medio que no recibe marcas superpuestas por la vela izquierda y la vela derecha al lado. Cuando el

Tasa de cambio
Basado en la fórmula, ROC = (Close[n] - Close[n-lookback]) / Close[n-lookback] * 100 para trazar la tasa de cambio de la acción del precio de un par de divisas durante un período retrospectivo, y proporciona dos variables globales, SYMBOL_ROC y SYMBOL_ROC_LOOKBACK, que representan el último valor de Tasa de cambio y la Tasa de cambio en el período retrospectivo anterior. Invocando el indicador usando la función iCustom, iCustom ( "Market/RedeeCash_Rate_of_Change.ex4" , Symbol (
FREE

Indicador de objetivos de compra y venta Consta de tres líneas: el primer color verde identifica los objetivos de compra, el segundo color rojo identifica los objetivos de venta y el tercer color azul es el precio promedio. Hay dos formas de entrar: Método 1: punto de entrada cuando el precio promedio se rompe con una vela larga desde abajo y mantenerse por encima de la línea azul con una vela verde se considera compra Cuando el precio promedio atraviesa el techo con una

Average Price Bars (APB) are modified Heikin-Ashi type candlesticks. Heikin-Ashi is a Japanese term translated as 'Average Bar'; therefore, the name, Average Price Bars. Average Price Bars provide a better depiction of current market by eliminating or reducing fluctuations in nominal price action often referred to as “choppiness” of current High, Low, and Close price action.
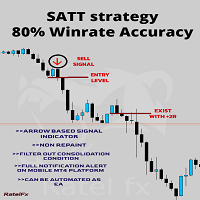
SAT strategy (Systematic Approach Trading Technique)
This is a revolutionary new way of trading the financial market.
This is the top indicator system that provides the most accurate trading signals for both entries and exits.
This system indicator algorithm provides the most accurate and precise signal only during the highly impulsive phase of the market.
This system indicator performs well during a high volume period, which is only the first three hours of a specific session, whethe

ICT Core Content Concepts turned into indicator plus all previous tools known from the Position Smart Indicator . This makes it the Full PSI Private Version ( read more ) restricted up to now but available only after the Mentorship Core Content was made public on YouTube. You will find many price action study tools like: Central Bank Dealing Range - CBDR Asian Range FLOUT Profiles and SD targets on the CBRD, Asian Range and Flout both on the wicks and on the bodies Seek & Destroy Profil

A supply and demand indicator designed with a minimalist trading strategy based on the nature of the market. The Bull zone is a strong support area, and the Bear zone is a strong resistance area. When a Bull zone was breakout, it becomes the "base" of the Bears and vice versa. When the price meets these areas, there is a high probability that the price will turn around, so we call them Obstacles. It is a suitable indicator for traders interested in manual price action and algorithmic trading up
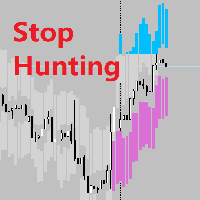
Realtime Stop Hunting Background What Is Stop Hunting? I refer to the definition of Stop Hunting from Investopedia, Stop hunting is a strategy that attempts to force some market participants out of their positions by driving the price of an asset to a level where many individuals have chosen to set stop-loss orders. The triggering of many stop losses at once typically creates high volatility and can present a unique opportunity for investors who seek to trade in this environment. Setting up the

ZigZagSpeed indicator measures the rate of formation of zig and zag over time calculated by the known zig zag indicator. The calculation system is simply calculated by dividing the difference in pips by the number of bars elapsed in the selected time frame. The speed measurements that occurred in the past period will also be displayed on the graph together with the date of occurrence. Velocity numbers are located above or below each zig and zag formation in white. The number shown in yellow rep

Forex Scanner multi-activos
Este indicador te permite escanear varios activos a la vez, enviándote un alerta configurable cuando algún activo toque los niveles de pivotes diarios 1, 2 o 3. Solo se realizó la modificación al código para el envío de alertas al MT4 Escritorio, MT4 Movil o Email. (Los creditos para el codigo original son para Carlos Olivieira) Para recibir las alertas de movil o email debe configurar las secciones de Notificaciones y Email en la plataforma de MT4. Ademas de los
FREE

The XR Gartley Pattern MT4 is an indicator which displays and alerts Gartley pattern detected on the candlestick chart. It also displays potential trade with calculated Take Profit and Stop Loss, Timeframe H1. After purchasing XR Gartley Pattern, you can immediately download this indicator from the MT4-MT5 Market and start using it because all features are set to default, is not necessary to change any parameter. In addition, we have created a private group for customers who have purchased one
FREE
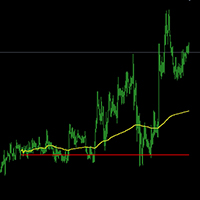
The index by 5 minutes the line graph is very close to the map to get the effect and time Using the method of the index: 1, 5 minutes K-line set into a line chart2, change the color of the white line chart 3, set the background color and the grid Yellow for the average . Red is the zero axis (that is, yesterday's closing price)
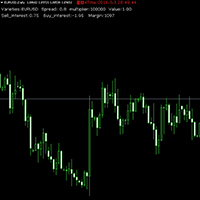
The basic information of the market
The current variety Spread Basis-point Value Empty single overnight interest More than a single overnight interest bond Time to market English version Forex Hedge EA standard edition Forex Hedge Pro EA Advanced version Chinese version Forex Hedge EA cn standard edition Forex Hedge Pro EA cn Advanced version QQ:437180359 e-mail:hl3012@139.com
Современный индикатор паттернов PPR по торговой стратегии RAIT. Работает по тренду и без него. Имеет настройки таймфрейма для отображения. Можно настроить количество баров для отображения индикатора на графике. Используется несколько паттернов PPR. Индикатор предпочтительно использовать на часовом таймфрейме и выше, но работает и ниже . Паттерны: PPR, PinPPR, OutPPR. Отображаются одной стрелкой.

Hi! Between the given time range. Adds profit and lot. This can be written on the charter in English and Hungarian. The name of the symbol must be entered exactly. Good used for it. :)
Szia! A meg adott idősáv között Összeadja a profitot és lot-ot. Ezt ki írathatjuk Angolul és Magyarul a chartra. Pontosan kell beírni a szimbólum nevét. Jó használatott hozzá. :)
Best Solution for any Newbie or Expert Trader!
Forex Support Resistance is a unique, high quality and affordable trading tool because we have incorporated a number of proprietary features. it calculate highest high and lowest low of Previous X bars with possibility to select timeframe as desired . also it display the values of highest high and lowest low of Previous bar as a comment at the main chart . Imagine how your trading will improve because you are able to pinpoint the exact trigger po

BUY INDICATOR AND GET EA FOR FREE AS A BONUS + SOME OTHER GIFTS! ITALO TREND INDICATOR is the best trend indicator on the market, the Indicator works on all time-frames and assets, indicator built after 7 years of experience on forex and many other markets. You know many trend indicators around the internet are not complete, does not help, and it's difficult to trade, but the Italo Trend Indicator is different , the Italo Trend Indicator shows the signal to buy or sell, to confirm the signal t
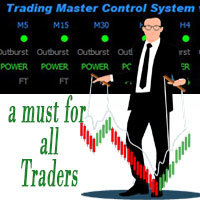
Características del Sistema de Control Maestro de Negociación
TMCS es una herramienta que le muestra en una sola vista el estado de un activo. TMCS le muestra todos los marcos de tiempo, muestra la tendencia, el poder comercial y calcula en función de las alertas de poder comercial para las señales comerciales. El indicador calcula las rupturas de las bandas de Bollinger. Además, y muy IMPORTANTE, le muestra que cuando un marco de tiempo es plano, significa que no hay un poder comercial rea

¡Actualmente en descuento por vacaciones a 399 dólares! Los precios pueden aumentar en el futuro. ¡Lea la descripción a continuación!
¡Presentamos Ultimate Dynamic Levels - el MEJOR indicador de entrada para el tablero de Ultimate Sniper! ¡¡¡Entradas oportunas de muy bajo riesgo y altas RR!!!
Encuentre el Tablero de Francotirador Definitivo AQUÍ. La habilidad más importante para los operadores principiantes y profesionales es saber exactamente dónde y cuándo es más probable que un mercado

Indicador de scalping de Forex que no vuelve a dibujar sus flechas. Funciona mejor en los plazos M5, M15, M30, H1. La configuración predeterminada es para el marco de tiempo M5. La siguiente imagen muestra un ejemplo de trabajo en el gráfico H1 con el valor del parámetro "período = 0,35". Puede descargar la versión demo y probarla usted mismo. Ahora usamos las señales de este indicador en casi todas nuestras estrategias de scalping. Según nuestros cálculos, la precisión de sus señales es de alr
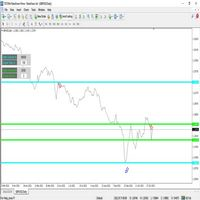
El indicador Canal de Precios consiste en dos canales de precios independientes y niveles de zonas de precios - (A / B). El indicador vigila constantemente el comportamiento y el movimiento de los precios, así como la ruptura de los niveles del canal - (A / B), reordenando los niveles y fijando nuevas zonas de extremos y mínimos. Para el análisis de máximos y mínimos anteriores y actuales, no depende del número de barras de cada canal - (A / B). El indicador muestra información útil para cada c

Indicador progresivo de nueva generación de INFINITY. Predictor Pro utiliza su propia estrategia de cálculo de entrada y salida. Indicador sin volver a dibujar las señales! Esto es muy importante para el comercio real.
El indicador se puede utilizar para cualquier par de divisas, metales, criptomonedas o índices. Mejor horario de tiempo N1.
Predictor Pro muestra el punto de entrada Buy / Sell y el punto de salida Close. El cálculo del beneficio en los puntos ayuda a elegir la configuración
FREE
Indicador de especulación para cualquier par de divisas y cualquier período de tiempo. El indicador muestra con flechas los puntos probables de reversión de precios según las leyes de regularidad del mercado. El indicador no vuelve a dibujar sus señales. Cuando aparece una flecha, el indicador puede enviar una señal al comerciante en un teléfono móvil, así como por correo electrónico. El indicador es muy fácil de configurar. Solo tiene un parámetro para configurar las señales "Período". Al camb

BUY INDICATOR AND GET EA FOR FREE AS A BONUS + SOME OTHER GIFTS! ITALO VOLUME INDICATOR is the best volume indicator ever created, and why is that? The Indicator works on all time-frames and assets, indicator built after 7 years of experience on forex and many other markets. You know many volume indicators around the internet are not complete, does not help, and it's difficult to trade, but the Italo Volume Indicator is different , the Italo Volume Indicator shows the wave volume, when market

This indicator will mirror the assets in use in another metatrader, being able to choose the timeframe and a template. This is the Metatrader 4 Client, it needs the Metatrader 4 or 5 Server versions: Metatrader 4 Mirror Chart Server: https://www.mql5.com/en/market/product/88644
Metatrader 5 Mirror Chart Server: https://www.mql5.com/en/market/product/88652 Details of how it works in the video.
FREE
This indicator will mirror the assets in use in another Metatrader, being able to choose the timeframe and a template. This is the Metatrader 4 Server, it can work with Metatrader 4 or 5 Client versions: Metatrader 4 Mirror Chart Client: https://www.mql5.com/en/market/product/88649
Metatrader 5 Mirror Chart Client: https://www.mql5.com/en/market/product/88650 Details of how it works in the video.
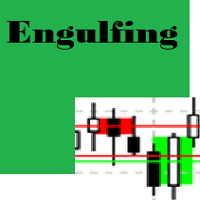
Engulfing Candle Detector
Detectable pattern Double Candlestick Patterns Bullish Engulfing
The first candle is black candle. The second candle opens with a gap below the real body of the black candle but rallies upwards to close above the real body of the black candle. In other words, the second candle's real body completely engulfs the first candle's real body Bearish Engulfing
The first candle is white candle. The second candle opens with a gap above the real body of the white candle but
FREE

Forex Flow Equalizer is an indicator that helps to reduce 'noise' in forex price movements. Visit https://www.mql5.com/en/blogs/post/751167 for more detailed explanation. It is programmed to enhance traders' focus, and capacity to monitor or manage multiple instruments of interest on preferred timeframe without their minds being over loaded with data or information, thereby, saving them the mental strength for more important trading decision making. Range Mode: is for traders who like to trade
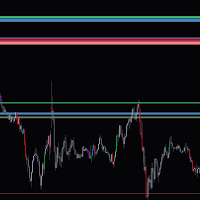
This indicator shows zones based on daily candles in the chart , Make sure you have enough daily bars in the chart before loading the indicator to the chart, These zones can act as both supply and demand zones. The zones are not subjected to repaint. If you have less zones or no zones for current prizes under the default inputs, try increasing the past days input and the zone sizes values gradually. If you have more zones than you need in chart try decreasing the past days and the zone size val

This indicator helps to identify market sessions, It's High/Low, Open Range (OR), range of the sessions in pips and percentage of previous day (change%) under OHLC.
It is also editable for any brokerage market watch time. For traders who use session trading strategies such as Mark B. Fisher ACD it can be super effective, where they can edit OR from the settings to either line or box. We tried to make the settings easier to edit, for traders' use on different markets, charts and brokerage time.
this indicator functions to read buffers from other custom indicators, and combine 2 signals from each indicator Instructions 1. you have to know the buffer up or down of the indicator you want to use 2. if the indicator is in the same folder, you just need to enter the name of the indicator in the indicator name column if the custom indicator is in a separate folder, you can type it in the format folder1/folder2/name indicator

Normalized indicator. It measures the relative deviation of the price from its moving average. It is extremely reliable. Accurately determine overbought and oversold price areas and divergences. Features. The indicator has a range of -100 to 100. The overbought zone is above 80 and the oversold zone is below -80. Zones of overvalue, indicate possible reversal. Mode: histogram/line. MA method: simple, exponential, smoothed, linear weighted. By default, the indicator is calculated on an SMA of
FREE
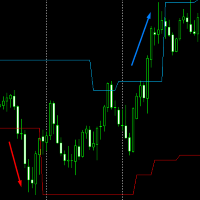
Volatility Channel from JagzFX helps you find breakouts by displaying a channel on the price chart. Volatility Channel is simple to use - there are no parameters - and works on any timeframe. BASIC USE of Volatility Channels The channel can be used as a 'No Trade Zone': you don't trade when the price is inside the channel. However:
When the price breaks above the channel: go Long. When the price breaks below the channel: go Short. The indicator works on all timeframes to suit your trading style
FREE
DESCRIPTION:
Account Information Panel v1.1 is a MT4 (MetaTrader 4) indicator, and it is an excellent tool to track and analyze your investments monthly under an investor's view to help investors/traders understand their investment/trading quickly without spending hours to do manual calculation. FEATURES:
Display a basic information Balance Equity Margin Free margin Margin level Leverage Swap (long/short) Spead Current DD (drawdown) Active positions (long/short, lot, profit/loss) Display we

Auto Fibo es un indicador desarrollado para mejorar sus operaciones manuales. Dibujará la proporción áurea de forma automática, ahorrando tiempo y facilitando su operativa. Adjunta el indicador a el gráfico y automáticamente se dibujará la proporción áurea exacta, ahorrándose el trabajo de tener que encontrar el punto crítico. La interfaz se ajusta según su ordenador a los puntos altos y bajos aproximados de la banda Este indicador corregirá la mayoría de los errores de selección de los puntos
FREE

Este indicador utiliza una combinación de medias móviles.
Desde el principio, podrá identificar un patrón de estrategia muy fácil pero rentable (incluso un comerciante principiante no se lo perderá).
Viene con parámetros de entrada ya definidos para el usuario. A pesar de los parámetros ya definidos, los usuarios pueden cambiar SÓLO LOS COLORES para adaptarlos a sus preferencias o a su gusto.
Parámetros incorporados, por lo que ya no tendrá que preocuparse por cambiar los parámetros de

Afidealn - ¡El indicador está diseñado para opciones binarias!
El indicador de flecha Afidealn mostrará los mejores resultados en los períodos:
¡M1 M5 M15 no más!
Pon la flecha azul hacia arriba
Pon la flecha roja hacia abajo
La señal aparece en la vela actual con un retraso de 10-15 segundos,
Afidealn funciona en varios indicadores debido a esto, como un retraso en la señal.
¡Multi moneda! Funciona en diferentes pares de divisas, el resultado fue excelente,
Además, el indicador
Cuando se trabaja con varios activos y se tienen varias posiciones abiertas en activos, es un poco complicado visualizar cuando ganancia o ganancia está dando cada problema activo, por eso con esto en mente desarrollamos este indicador donde facilita la visualización de operaciones en activos , donde podrás abrir varios recursos diferentes y podrás visualizar el resultado individual de cada activo y agilizar la toma de decisiones en tu negocio.
FREE
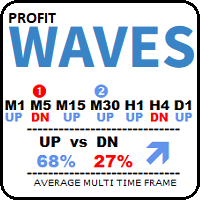
MT Rider
This MT Rider is a multi time frame trend indicator ... Based on a standard MACD , moving average convergence divergence indicator.
With just one glance at the chart, we can see the directions of all time intervals.The trend average is additionally displayed in percentages.
You often hear the experts: trade in the direction of the trend. But, you need to find the correct ratio, to trade on your time interval.
With this indicator you will eliminate all doubts. This indicator from
FREE

Trend Panel Limited es un indicador que permite conocer la tendencia de un par en determinada temporalidad usando 2 medias móviles. Usted puede modificar el periodo de las medias móviles. Le permite seleccionar que pares quiere monitorear en los parámetros de entrada. También decide en que temporalidad desea darle seguimiento. En fin, TrendPanel le da la posibilidad de conocer la tendencia de un par en determinada temporalidad sin tener que cambiar de gráfico. Limitaciones de la versión: Solo p
FREE

This Indicator is designed to show past trade entries and exits on calculations from level crossed. It can be used on any chart. It will show past losses, profits and profits minus losses. User can change indicator's basic settings and the results shown will change. Indicator will work on running charts too. Past no. of bars will enable indicator to calculate set no. of past period of candles.
The Cross Period Moving Average Support Resistant Map puts multiple latest updated MA value in the same window.
Useful for trend and breakout traders to identify support and resistance at a glance. Highlighted with multiple line width for each period. MA type : SMA MA price : candle close price MA periods: H1 , H4 , D1 , W1 , MN
**if you have any enquiry, contact me at : pipsstalker1507@gmail.com

This indicator plots another symbol on the current chart. A different timeframe can be used for the symbol, with an option to display in multiple timeframe mode (1 overlay candle per several chart candles). Basic indicators are provided. To adjust scaling of prices from different symbols, the overlay prices are scaled to the visible chart price space.
Features symbol and timeframe input MTF display option to vertically invert chart, eg overlay USDJPY, invert to show JPYUSD
data window values
FREE
MetaTrader Market ofrece a todos los desarrollador de programas de trading una sencilla y cómoda plataforma para ponerlos a la venta.
Le ayudaremos con la presentación y explicaremos cómo preparar la descripción de su producto para el Market. Todos los programas que se venden a través del Market están protegidos por una codificación adicional y pueden ser iniciados sólo en el ordenador del comprador. La copia ilegal es imposible.
Está perdiendo oportunidades comerciales:
- Aplicaciones de trading gratuitas
- 8 000+ señales para copiar
- Noticias económicas para analizar los mercados financieros
Registro
Entrada
Si no tiene cuenta de usuario, regístrese
Para iniciar sesión y usar el sitio web MQL5.com es necesario permitir el uso de Сookies.
Por favor, active este ajuste en su navegador, de lo contrario, no podrá iniciar sesión.