Nuevos indicadores técnicos para MetaTrader 4 - 8
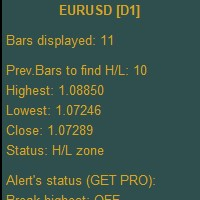
Higher Timeframe Chart Overlay will display higher timeframe candles, including the number of candles high/low you specify.
You no longer need to switch timeframes to check the candles. Everything can be shown in one chart. Get Full Version - https://www.mql5.com/en/market/product/115680 Please feel free Contact me if you have any questions regarding this tool.
FREE

First of all, it is worth highlighting here that this Trading Indicator is Non Repainting, Non Redrawing and Non Lagging, which makes it ideal for manual trading. Never repaint and recalculate Once an arrow appears it never disappears, the signal comes at the opening of the new candle You will now be more profitable with this indicator The indicator will alert you when an arrow appears You can do swing trading or scalping trading The indicator helps you identify the trend Can be optimized acros

Once upon a time, in the bustling streets of Gotham City, there lived a mysterious figure known only as the Joker. With his enigmatic grin and unpredictable nature, the Joker roamed the city's financial district, leaving chaos and uncertainty in his wake. One fateful day, a group of traders stumbled upon a peculiar artifact hidden deep within the dark alleys of Gotham. It was a cryptic indicator known as the "Joker Arrow," rumored to possess the power to predict market movements with uncanny acc

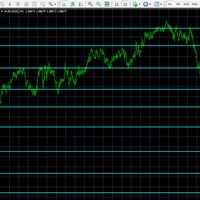
The indicator plots key levels automatically for EURUSD.
Major levels - H4,H1 Minor Levels - M30,M15 Mini Levels - M5,M1
To deactivate a level, just select color none.
It can be used to enhance your current strategy. (Please see screenshots)
The color, line style and thickness can be adjusted as preferred.
Symbol: EURUSD Timeframe: H4 and below
Enjoy! ------------------------------------------

TRADE THE BREAKOUTS like Gordon Gekko Gordon Gekko, the ruthless and iconic character from the movie "Wall Street," is renowned for his aggressive and opportunistic trading strategies. When it comes to trading breakouts, Gekko embodies the mindset of a savvy and relentless trader who seizes every opportunity to capitalize on market movements. In Gekko's trading playbook, spotting breakout opportunities is akin to identifying potential gold mines in the market. He meticulously scans the charts

TeconLab Indicator User Guide Overview The TeconLab Indicator is a tool for MetaTrader 4 (MT4) users, fine-tuned to gather price information, including Date, Time, Open, High, Low, Close, and Volume, and update this data in real-time. Uniquely, this indicator autonomously refreshes the CSV file every minute or less, meaning there's no need for manual restarts—just activate it once, and it will continuously collect data as long as MT4 is running. It maintains the latest data according to the size
Based on unique formulas and calculations, this indicator analyses every price move on the chart then applies its unique formulas on them to indicate the currently dominant direction. This indicator works on all instruments but best with GOLD (XAUUSD). It can also work as an entry confirmation tool and can also serves highlighting the worthy and noticeable moves on the chart. The Oppo Signals Indicator can work alongside any other strategy and can also help traders devise their own strategies u

The indicator is based on the calculation of liquidity on the market and thus shows where the market can most likely turn.. It shows the places of liquidity where the price will reach sooner or later... The indicator can be set to several types of liquidity and therefore can display several levels on the graph.. It is a unique tool that can help you very well in your trading The indicator is suitable for currency pairs with the most liquidity (EURUSD/GBPUSD...)

Gann Signal is a very simple indicator at first glance, but hidden inside is many years of experience in studying W.D.Ganna methods. The indicator gives accurate BUY/SELL signals, without redrawing. The indicator is very easy to use. All you need to do is attach it to your chart and follow its recommendations. The indicator constantly analyzes the market for entry opportunities. When such an opportunity appears, the indicator gives a signal in the form of an arrow. I repeat, all signals are NOT

Pips Hunter PRO ha sido desarrollado durante varios años y es una versión mejorada de su predecesor. Este poderoso indicador analiza el mercado y el histórico de precios para generar entradas de compra y venta. Para el cálculo de estas entradas utiliza diferentes indicadores que funcionan en conjunto así como un complejo logaritmo estadístico que filtra las entradas menos favorables y las elimina / Versión MT5 . El precio se incrementará progresivamente debido a la búsqueda constante de manten

El indicador Spread Pulse es una herramienta eficaz que proporciona a los operadores información sobre el diferencial actual en el gráfico. El diferencial es la diferencia entre el precio de compra y el precio de venta de un instrumento.
El indicador se presenta en forma de texto que se muestra en el gráfico. Esto permite al comerciante rastrear fácilmente el diferencial actual.
Una de las principales ventajas del indicador Spread Pulse es su visualización en color. Dependiendo del tama
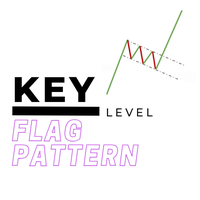
The Key level flag pattern is one of it's kind when it comes to flag patterns on the Metatrader platform. It is perfect for entering pullbacks in a trend, retests on certain structure or price action, or when you are just looking for a confirmation entry on a zone or odrerblock. It's works on all markets, whether it's forex, crypto currency, stocks or futures. In it's algorithm it incorporates an: 1. Impulsive move (leg/pole) = this is the high momentum move which creates the leg/pole of the pat

Product detailed post: https://www.mql5.com/en/blogs/post/756962
Get free demo from the link in above post.
Features: - Multi Heiken Parameters
- Alerts & Highlights for Heiken Switch
- Heiken Alignment Alerts
- Multi-timeframe Alignment Alerts
- Multi Currency
Heiken Explained: Heiken Settings: All comma separated lists will be used for different heiken ashi's. Example: 5,40,188 will mean that MAPeriod1 in 1st heiken will be 5; In 2nd heiken will be 40 and in 3rd heiken ashi will be 1

The indicator determines the state of the market (trend or flat) using the upgraded Bollinger Bands of higher timeframes and colors the bars in trend/flat colors. The indicator also gives signals (arrow on the chart + Sound and notification to Mail, Push):
signal at the beginning of every new trend; signal inside the trend (entry at the end of the correction) Signals are never redrawn!
How to use the indicator? The indicator works very well intraday. When using the indicator for intraday (T

1. Compound Drawings (1) Line segment with arrow (2) Continuous line segment (broken line) (3) Parallelogram (4) Polygon (5) Profit and loss ratio measurement tools
2. Backtracking By the Z key in the process of drawing the line Line types that support Z-key backtracking: continuous line segments (broken line) ,channels,parallelograms,polygons, and fibo extensions.
3.Automatic Adsorption (1) Click the "Lock-Button" to switch the automatic adsorption switch before drawing the line (2)

Trop is a trend indicator that has several important advantages. It helps to pinpoint both new and existing trends in the market. One of its key advantages is its quick adjustment and responsiveness to changes in schedule. The effectiveness of the indicator depends on the set CalcBars period. The longer this period, the smoother the indicator displays the trend line. On the other hand, as the period decreases, the indicator takes into account more market noise, which can be useful in generating

The SignalSailor indicator is your reliable assistant in Forex for quick market analysis. It not only reflects the current market condition but also provides valuable signals about the best times to open trades. Market conditions are constantly changing, and to stay ahead, a trader needs to quickly adapt their strategies. This is precisely why the Klaus indicator was created - it will help you accurately determine the direction of the trend on the price chart.
SignalSailor is an indispensable

The TrendTide indicator provides accurate signals about potential market reversals. Its primary purpose is to generate signals for entering and exiting trades. Determining the current market trend is a critically important aspect for traders. The intelligent algorithm of TrendTide efficiently identifies trends, filters market noise, and creates precise entry and exit signals.
This indicator represents an advanced algorithm for visualizing the market trend. It is designed to identify both long

The Market Sentiment Meter indicator calculates the saturation levels of the price chart. A signal to exit the oversold zone indicates a buying opportunity, and a signal to exit the overbought zone indicates a selling opportunity. Typically, for this indicator you need to set relative values for the overbought (Top) and oversold (Bottom) levels.
Often a good trend can be seen visually on the price chart. However, an experienced trader must clearly understand the current distribution of forces

TrendTrack indicator: Stay on trend easily!
The TrendTrack indicator is designed to analyze price behavior in the Forex market, helping the trader to quickly spot temporary weaknesses or obvious changes in trend direction. Entering the market is only the first step, but maintaining a position is more difficult. With TrendTrack, staying on trend becomes easy!
Peculiarities:
Trend Analysis: The indicator analyzes historical data, providing signals to the trader. The arrow format of the indi

The Trendline Trader indicator is designed to reliably track market trends, ignoring sharp fluctuations and noise in the market. This indicator is suitable for trading on both short and long time intervals due to its ability to filter out sudden price spikes and corrections. It is based on the iLow, iHigh, iMA and iATR indicators, which makes it particularly reliable.
Parameters for setting up the indicator: Length: period for channel calculation and noise filtering. Star: period for determin

このインディケータはボリンジャーバンドを裁量およびEAで実際に利用してきた私自身の経験から、より手軽に、かつ効果的に活用できるよう作成された裁量トレード用サインツールです。 ブレイクアウトでの順張り、リバウンドでの逆張りの両面で利用でき、各種のフィルター機能でより精度の高いサインを発信します 勝敗判定機能により、このインディケータの直近の相場環境に対する有効性を確認できます 全通貨ペア、全タイムフレームで利用できます。リペイントはしません
設定項目は以下の通りです。 Bollinger Bands Period
Bollinger Bands Deviation
Bollinger Bands Shift
Entry Mode ...ボリンジャーバンドにタッチしてからのBreakout(順張り), Rebound(逆張り)のどちらかを指定 Plus Filter ...独自アルゴリズムによるフィルターでシグナルの精度を高めます(Reboundモード専用) Trend Filter ...下で設定する移動平均のトレンド方向でのシグナルに限定します Moving Aver

The indicator shows divergence between the slope of lines connecting price and MACD histogram peaks or troughs. A bullish divergence (actually a convergence) occurs when the lines connecting MACD troughs and the lines connecting the corresponding troughs on the price chart have opposite slopes and are converging. A bearish divergence occurs when the lines connecting MACD peaks and the lines connecting corresponding price peaks have opposite slopes and are diverging. In such a case, the indicato
The TrendScope Pro indicator views the chart as a function with the X-axis representing time and the Y-axis representing price, expressed in bars and pips respectively. The main objective of the indicator is to provide users with signals for actions when the function forms continuous movement in one direction over a specific period of time. The indicator parameters need to be adjusted individually for each currency pair, as the price function varies for different pairs.
The indicator provides

Trend Filter Pro
Trend filter indicator.
Very good filter for your trading system, I recommend to use it together with - System Trend Pro and Professional Trade Arrow
The indicator no repaint!!!
Settings:
Change the Period parameter for better filtering ( default is 90)
Any questions? Need help?, I am always happy to help, write me in private messages or
In Telegram: https://t.me/Trader35_Admin
FREE

In the world of trading, one of the main concerns is finding a reliable trading system. Meet the TrendEdge Channel indicator - your reliable companion in this search. Developed based on complex mathematical calculations, this indicator predicts the most likely short-term price movements.
TrendEdge Channel is designed specifically to identify trends in price movements. Thanks to it, you can quickly determine not only the direction of the trend, but also the levels of interaction between buyers

USDLFX is a currency index of US dollar formulated by LiteForex broker. It is an attempt to create an indicator for USD currency power. The idea has been further extended to other major Forex currencies. These indices are not available on other brokers. There are other currencies AUD CAD EUR CHF GBP NZD JPY Thanks to this indicator, you have an objective view of the selected currency
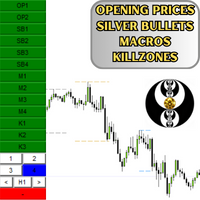
This is an Indicator that plots Time & Price . This is a good ICT Starter Indicator especially if you're new. This also has 4 Silver Bullets and 4 Macros. If you liked this one, you can purchase the updated version of this which has CBDR and Asian Range . Updated Version: https://www.mql5.com/en/market/product/109904 Please leave a review about your experience with this Indicator
FREE

Advanced Currency Strength Indicator
The Advanced Divergence Currency Strength Indicator. Not only it breaks down all 28 forex currency pairs and calculates the strength of individual currencies across all timeframes , but, You'll be analyzing the WHOLE forex market in 1 window (In just 1 minute) . This indicator is very powerful because it reveals the true movements of the market. It is highly recommended to analyze charts knowing the performance of individual currencies or
テクニカル指標開発の第一人者であるトム・デマークが考案した TDシーケンシャルは、 トレンドの転換点を判断するのに有用なインディケータです。このインディケータは TDシーケンシャルを裁量およびEAで実際に利用してきた私自身の経験から、より手軽に、かつ効果的に活用できるよう作成された裁量トレード用サインツールです。
強いトレンドが生じている際に多くのだましが生じるのはTDシーケンシャルの弱点と思われますが、これを克服するために強力なフィルターを装備しています。また、最も有効と思われるセットアップ9に絞ってサインを発信します。
全通貨ペア、全タイムフレームで利用できます。勝敗判定機能により、このインディケータの直近の相場環境に対する有効性を確認できます。
設定項目は下記のとおりです。 Enable Protect Mode...強いトレンドが発生した際の連敗を回避します Box Filter...下で設定する3つのタイムフレームでの移動平均でパーフェクト・オーダーが発生していない状態をボックス相場と判定し、サインを限定します Moving Average Time Frame1

Introducing the Reversal and Breakout Signals
This innovative tool is crafted to enhance your chart analysis by identifying potential reversal and breakout opportunities directly on your charts. It's designed with both novice and experienced traders in mind, providing intuitive visual cues for better decision-making. Let's dive into the key features and how it operates:
### Key Features:
Dynamic Period Settings: Customize the sensitivity of the indicator with use

History VT Информационный индикатор. Показывает на графике, сразу после открытия сделки, стрелку именно на той японской свече, где позиция открыта.
То есть там, где появилась штрихпунктирная линия открытой сделки, в терминале.
Далее, после открытия сделки, как обычно, трейдер ставит SL и TP и ждёт итога своего выбора направления движения.
После того как сделка закрылась, по « sl » или « tp » или «вручную», индикатор отображает на графике уровни и текстовые сноски параметров сделки.
С

Introduction
One of the patterns in "RTM" is the "QM" pattern, also known as "Quasimodo". Its name is derived from the appearance of "Hunchback of Notre-Dame" from Victor Hugo's novel. It is a type of "Head and Shoulders" pattern.
Formation Method
Upward Trend
In an upward trend, the left shoulder is formed, and the price creates a new peak higher than the left shoulder peak . After a decline, it manages to break the previous low and move upward again. We expect the pric
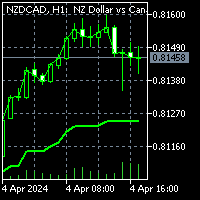
To get access to MT5 version please click here . This is the exact conversion from TradingView: "G-Channel Trend Detection" by "jaggedsoft". This is a light-load processing and non-repaint indicator. You can message in private chat for further changes you need. All input options are available. Buffers are available for processing within EAs. Highlight option is omitted as does not show good in Metatrader.

En primer lugar, vale la pena enfatizar que este Indicador de Trading no repinta, no redibuja y no se retrasa, lo que lo hace ideal tanto para el trading manual como para el automatizado. Manual del usuario: configuraciones, entradas y estrategia. El Analista Atómico es un Indicador de Acción del Precio PA que utiliza la fuerza y el impulso del precio para encontrar una mejor ventaja en el mercado. Equipado con filtros avanzados que ayudan a eliminar ruidos y señales falsas, y aumentan el poten

Indicator : RealValueIndicator Description : RealValueIndicator is a powerful tool designed specifically for trading on the EURUSD pair. This indicator analyzes all EUR and USD pairs, calculates their real currency strength values, and displays them as a single realistic value to give you a head start on price. This indicator will tell you moves before they happen if you use it right. RealValueIndicator allows you to get a quick and accurate overview of the EURUSD currency pair tops and bottoms,

This indicator is unstoppable when combined with our other indicator called Katana. After purchase, send us a message and you could get Katana for FREE as a BONUS After purchase, send us a private message for your instructions. The Trend Forecasting indicator is a very unique & easy tool that is able to make prediction about future price movement based on the signals generated by MACD . It helps you have an estimation on the areas that the price may develop in the future. This prediction is ca

ALERTA DE COMPRA Y VENTA MULTIDIVISA y MULTITIMEFRAME. ¡STOP DE TRAILING AUTOMÁTICO Y TOMA DE BENEFICIOS DE RECOMPENSA DE RIESGO! ¡EL INDICADOR ESCANEA Y ANALIZA EL MERCADO PARA QUE NO TENGAS NADA QUE HACER! ¡COMERCIA TODAS TUS MONEDAS EN 1 GRÁFICO!
Después de la compra, deje un comentario, contácteme y le enviaré el asistente comercial EA.
El indicador utiliza varios osciladores y filtros adjuntos para encontrar los mejores puntos de entrada CONFIRMADOS, ¡así que no necesita preocupars

System Trend Pro - This is the best trend trading indicator!!!
The indicator no repaint!!! The indicator has MTF mode, which adds confidence to trading on the trend ( no repaint ). How to trade? Everything is very simple, we wait for the first signal (big arrow), then wait for the second signal (small arrow) and enter the market in the direction of the arrow.
(See screens 1 and 2.) Exit on the opposite signal or take 20-30 pips, close half of it, and keep the rest until the oppo

SmartSignal Sniper: Tu Compañero de Trading Definitivo Descubre el poder del trading preciso con SmartSignal Sniper. Diseñado para ofrecer señales de compra y venta precisas, esta herramienta avanzada permite a traders de todos los niveles navegar por los mercados financieros con confianza y claridad. Características Clave: Precisión Milimétrica: SmartSignal Sniper utiliza algoritmos avanzados para proporcionar señales precisas de compra y venta, ayudando a los traders a identificar oportunidade
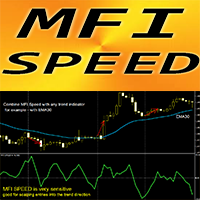
Indicador Forex "Velocidad MFI" para MT4
El cálculo de este indicador se basa en ecuaciones de la física. MFI Speed es el primer derivado del propio MFI El índice de flujo de dinero (MFI) es un oscilador técnico que utiliza datos de precio y volumen para identificar zonas de sobreventa y sobrecompra. MFI Speed es bueno para aprovechar las entradas de impulso en la dirección de la tendencia principal Úselo en combinación con un indicador de tendencia adecuado, por ejemplo EMA estándar (como en

"Fractales ajustables": es una versión avanzada del indicador fractal, ¡una herramienta comercial muy útil!
Como sabemos, el indicador Standard fractals mt4 no tiene ninguna configuración, lo que es muy inconveniente para los traders. Ajustable Fractals ha resuelto ese problema: tiene todas las configuraciones necesarias: Período ajustable del indicador (valores recomendados - superiores a 7) Distancia ajustable desde máximos/mínimos de precio Diseño ajustable de flechas fractales.
// Más a

Adaptive Market Dynamics Indicator (AMDI) is an innovative tool for traders across all financial markets. This indicator is designed to provide traders with a deep understanding of market dynamics and adaptive trading signals based on current market conditions. Key Features and Benefits: Adaptive Analytics : AMDI can automatically adapt to changing market conditions, allowing traders to effectively adjust their strategies in real-time. Multifactor Analysis : The indicator offers a comprehensiv

The Practitioner indicator is based on a unique algorithm for analyzing price behavior and presents the result of this complex work in the form of lines. One of the advantages of this indicator is that it automatically changes the color of the line according to the current direction of the price movement.
It is important to note that the indicator has an option to enable alerts when the line color changes. This gives the trader the opportunity to quickly respond to changes and identify new tr

The " YK Find Support And Resistance " indicator is a technical analysis tool used to identify key support and resistance levels on a price chart. Its features and functions are as follows:
1. Displays support and resistance levels using arrow lines and colored bands, with resistance in red and support in green.
2. Can be adjusted to calculate and display results from a specified timeframe using the forced_tf variable. If set to 0, it will use the current timeframe of the chart.
3. Uses t
FREE

This indicator is a simple trend line indicator.
The upper trend line is the highest price of 60 past candlesticks, the highest price of 30 past candlesticks,
The bottom line is the trend line that connects the lowest price of 60 past candlesticks and the lowest price of 30 past candlesticks.
*The color of the trend line is white.
Notes
This indicator is created with the above configuration, so if the highest and lowest prices of the past 60 candlesticks and 30 candlesticks are the s
FREE
This indicator collects and organizes spread data. It is an organic add-on to my news robot, ExpertNews , which can be downloaded here .
You can also watch a video about news trading using the ExpertNews robot. It is available on youtube .
Unfortunately, it is not possible to place the robot in the mql5.com store, because the automatic validation of ExpertNews by the mql5 service ends in failure. In reality, there are no errors in the robot.
Testing fails due to the fact that the advisor
FREE

This indicator shows the strength of each currency compared to the US dollar by calculating the rate of change in price over a specified time period. When you open the indicator, you'll see a list of different currencies on the price chart. Each currency will have a numerical value indicating its strength level compared to the US dollar, where: If the value is higher than the US dollar, it will be displayed in green, meaning that currency is stronger than the dollar. If the value is lower than
FREE

The RSI Advanced tool will help traders capture trends and optimal entry points by:
- Enter a Buy order when the green line crosses the yellow line. Provided that the yellow line is near line 32 or 20 - Enter a Sell order when the green line crosses the yellow line. Provided that the yellow line is near line 68 or 80
Additionally, you can combine it with the convergence divergence that occurs at the green line. **When you purchase the Mastering the RSI MT4 or Mastering the RSI MT5 indicator
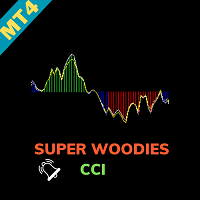
Super Woodies CCI Indicator - Enhance Your Trading Precision Step into the realm of precision trading with the "Super Woodies CCI Indicator" for MetaTrader 4. This advanced tool, inspired by Woodie's CCI, is designed to provide you with clear insights into market trends, enabling you to make well-informed trading decisions. Basic Details : Indicator Type : Super Woodies CCI Indicator Key Metrics : Real-time CCI (Commodity Channel Index) analysis for price trends. Customization : Fully customizab

OVERVIEW
K-means is a clustering algorithm commonly used in machine learning to group data points into distinct clusters based on their similarities. While K-means is not typically used directly for identifying support and resistance levels in financial markets, it can serve as a tool in a broader analysis approach.
Support and resistance levels are price levels in financial markets where the price tends to react or reverse. Support is a level where the price tends to stop falling
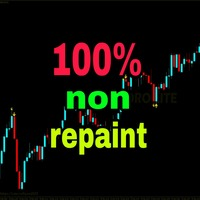
'Zoro LITE' is a reversal strategy based MT4 indicator with advance pre-alert system. Its an 100% non repaint indicator with an average accuracy of about 70-95% in a ranging market. --------------------------------------------------------- Features: Neural Network based Advance price action algorithms Pre-alert (get ready) signals Non-delay indications 24/7 signals OTC markets supported Auto-trading supported 100% Non repaint 100% No lag No recalculating Lifetime license -----------------------

This powerful tool combines the Zigzag algorithm with Fibonacci retracement levels, enhancing your trading experience in the MetaTrader 4 (MT4) platform. Zigzag with Fibo Indicator Time Frame :- 1H and above The Zigzag with Fibo Indicator is designed to identify trend direction and provide precise entry and exit points for forex trading. Here’s what makes it stand out: Zigzag Algorithm Integration : The indicator utilizes the Zigzag algorithm, which helps filter out market noise and highligh
FREE

The EntryHub system by MQ4.org is designed for Forex trading and is available as an indicator for the popular MetaTrader 4 (MT4) platform. Let’s delve into its details: Forex Entry Point System : The Forex Entry Point System is an MT4 indicator that assists traders in identifying potential entry points for their trades. It provides signals based on specific market conditions, helping traders make informed decisions. While it’s essential to note that no indicator is fo
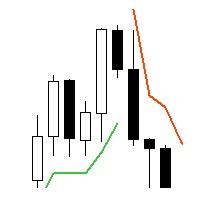
Supertrend - невероятно мощный и универсальный индикатор, предназначенный для помощи трейдерам в определении текущего тренда на конкретном торговом инструменте. С помощью двух встроенных индикаторов, Average True Range и Standard Deviation, трейдеры могут выбрать наиболее подходящий индикатор для своей стратегии торговли. Пользователи также могут настроить период этих индикаторов и выбрать цену (Close, High, Low, Open, Weighted), к которой он должен быть применен, с Typical price в качестве опци

Thise indicator is up down v6 comes with tradingwiev pinescript. purchased people, after installed on terminal ,contact me on mql5 to get BONUS TradingView pinescript.
up-down indicator is no repaint and works all pairs and lower than weekly time frames charts. it is suitable also 1 m charts for all pairs. and hold long way to signal. dont gives too many signals. when red histogram cross trigger line that is up signal.and price probably will down when blue histogram cross trigger line that
El indicador para el comercio en el mercado de divisas y opciones Binarias está escrito sobre la base del indicador estándar MT4 de una Media Móvil Simple. Pero la diferencia con el indicador estándar es que sus líneas se repintan en diferentes colores dependiendo del estado de la tendencia. Si el color es verde, entonces la tendencia de compra. Si es rojo, a la venta. Durante el cambio de la fase de tendencia, aparece una alerta de sonido junto con un búfer en el gráfico en el medio de las líne

Extreme Value Sniper is a detrended price indicator Indicator finds the potential reversal levels by checking value ranges and price cycles. ***Indicator does NOT repaint so it provides accurate NO REPAINT REVERSAL SIGNALS***
MT5 Version of the product : https://www.mql5.com/en/market/product/114550
It shows the overbought and oversold levels using the average range. Overbought Levels are between 4 and 10 Oversold levels are bewtween -4 and -10
Those levels can be used as a reversal l
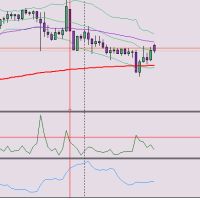
Indicadores Rango de Velas (Candle Range) y Rango Verdadero Promedio (ATR): Compara el tamaño del rango de la vela con el ATR. Ayuda a analizar el movimiento de los precios e identificar oportunidades de trading. ¿Desea saber más? Deje un comentario para compartir su experiencia. ** Sugerencias para mejorar la traducción: Proporcionar ejemplos específicos del uso del indicador. Explicar las ventajas y desventajas del indicador. Ofrecer tutoriales o videos sobre cómo usar el indicador.

The " Vertical Levels " indicator for the Forex market is a tool for displaying vertical levels on a price chart. These levels can be useful for a trader, as they help identify significant points in price movement and potential reversal or trend continuation zones.
Peculiarities:
Vertical Levels: The "Vertical Levels" indicator allows you to display vertical lines on the chart, indicating certain levels. These levels can be adjusted using input parameters. Setting options: Length : Length o

The Avia indicator analyzes the chart as a mathematical function with X-time and Y-price axes. Time is represented in bars and price in pips. The purpose of this indicator is to give the trader a signal to act at the moment when the function forms a recoilless movement in one direction over a certain period of time. Here are the main characteristics and settings of this indicator:
Peculiarities: Non-rebound movement : The Avia indicator looks for moments when the price moves in one direction

Our support and resistance levels help to determine the reversal of the market price, fully track the trend, and also fix the profits in a timely manner. Support and resistance levels can also determine trading ranges. When you hover your mouse over the upper right corner of a level, a hint with a description of the level pops up. To avoid cluttering the chart, levels disappear after breaking through.
Input parameters: WPR_Period = WPR period UpLevel = WPR top l

The Inversion Fair Value Gaps (IFVG) indicator is based on the inversion FVG concept by ICT and provides support and resistance zones based on mitigated Fair Value Gaps (FVGs). Image 1
USAGE Once mitigation of an FVG occurs, we detect the zone as an "Inverted FVG". This would now be looked upon for potential support or resistance.
Mitigation occurs when the price closes above or below the FVG area in the opposite direction of its bias. (Image 2)
Inverted Bullish FVGs Turn into P

Overview
The Volume SuperTrend AI is an advanced technical indicator used to predict trends in price movements by utilizing a combination of traditional SuperTrend calculation and AI techniques, particularly the k-nearest neighbors (KNN) algorithm.
The Volume SuperTrend AI is designed to provide traders with insights into potential market trends, using both volume-weighted moving averages (VWMA) and the k-nearest neighbors (KNN) algorithm. By combining these approaches, the indicat

Retracement Reversal and Support and Resistance Pro (for non pro version Click here ) is based on a formula used by Proprietary trading firms and other big institutions on WallStreet including on my Company and used by my traders here in the capital of the world. This indicator will create Red and Green arrows on a possible mayor Retracement level, Reversal Level and future Support and Resistance levels and Yellow arrows on a possible m i nor Retracement level, Reversal Level and future Suppo

The YK-LOT-SIZE is an indicator that displays the total Lot Size and profit/loss of all trade orders for the current symbol on the price chart. It has the following features: Shows the total Lot Size of buy orders (BUY) and sell orders (SELL) on separate lines. Displays the profit/loss of buy orders (BUY) and sell orders (SELL) by calculating the sum of profit, commission, and swap. Users can customize the color of the displayed text through the input parameter. The information is displayed at t
FREE
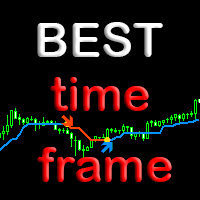
Индикатор BestTF поможет быстро выбрать самый лучший для торговли таймфрейм валютной пары или криптовалюты. Индикатор BestTF рассчитает и покажет в таблице крутизну графика (волатильность) для всех существующих таймфреймов текущего торгового инструмента. Почему важно правильно выбрать таймфрейм
Выбор таймфрейма является ключевым аспектом при торговле на валютном рынке по нескольким причинам:
Торговые стратегии: Различные торговые стратегии эффективны на разных таймфреймах. Например, краткоср
FREE
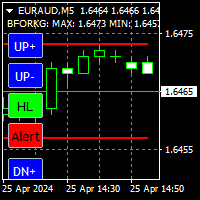
Very useful indicator, you won't be able to be without it. Essential for scalping. It shows rebound levels, top and bottom, forming a fork that surrounds the price. Each level has two blue controls associated to change it, has one green control for rebound mode: High/Low or Open/Close, and has a red breakage alert control. The values of each level, and the distance between levels in pips, are shown at the top left. Features: -T wo independent modes of operation: High/Low, Open/Close. -When on

UPDATED VERSION INCORPERATES FIBONACCI FOR BETTER LEVELS AI Powered Price Clustering" is a custom indicator that integrates k means and Fibonacci. This powerful tool provides traders with valuable insights into price clustering patterns, facilitating more informed trading decisions. How it works: With "AI Powered Price Clustering," traders gain access to: A K means algorithm for precise analysis of price clustering patterns. Identification of key Fibonacci levels and centroids for enhanced tech
A powerful chart indicator which intelligently analyses Index, FX & Commodity prices to identify the strongest support and resistance price boundaries. Each line shows where prices consistently close, while the frequency of these matching prices is quoted to reflect each boundary strength. Use these predictive boundaries to identify pivot points, resistance and support levels for crossover, trending, reversal and channel strategies. For FX pairs, set volatility filter = 1 For Indices & Commodi
MetaTrader Market ofrece a todos los desarrollador de programas de trading una sencilla y cómoda plataforma para ponerlos a la venta.
Le ayudaremos con la presentación y explicaremos cómo preparar la descripción de su producto para el Market. Todos los programas que se venden a través del Market están protegidos por una codificación adicional y pueden ser iniciados sólo en el ordenador del comprador. La copia ilegal es imposible.
Está perdiendo oportunidades comerciales:
- Aplicaciones de trading gratuitas
- 8 000+ señales para copiar
- Noticias económicas para analizar los mercados financieros
Registro
Entrada
Si no tiene cuenta de usuario, regístrese
Para iniciar sesión y usar el sitio web MQL5.com es necesario permitir el uso de Сookies.
Por favor, active este ajuste en su navegador, de lo contrario, no podrá iniciar sesión.