Nuevos indicadores técnicos para MetaTrader 4 - 11
Introduction to the use of MT4 platform AI Color Gradient Volume indicators I. Overview of indicators
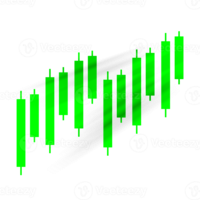
AI Color Gradient Volume is an innovative volume analysis indicator based on artificial intelligence technology for the MT4 platform. By converting the volume data into an intuitive color gradient graph, it helps traders to have a more acute insight into the inflow and outflow of funds in the market and the strength of the buying and selling forces, so as to provide strong support for trading

Super Scalp Indicator MT4 is a unique trend reversal 100% non-repainting multi-algo indicator that can be used on all symbols/instruments: forex, commodities, cryptocurrencies, indices, stocks . Super Scalp Indicator MT4 will determine the current trend at its early stages, gathering information and data from up to 10 standard algos When indicator give a valid buy or sell signal, a corresponding arrow will be printed on the chart, open trade at start of the next candle/bar

This product enables you to trade in opportunities that are detected by the indicator. Using advanced Calculations and formulae this product enables you to profit from trend opportunities. Trend master has Channels that show areas the trend is strong and you are likely to profit. Once this zone Is breached the price is on in uncertain territory and there is no guarantee the trend will continue This means there might be reversal and it is advisable to exit a trade here.

Do you want to beat the market? This indicator uses advanced mathematical formulae That include regression analysis to predict market trends. So what happens is That when the price is above the indicator line as depicted in the screenshot The trend is rising and when the price is below the indicator line the Trend is falling. This opportunities appear multiple times each day enabling You to profit. This indicator makes the trend your friend.
Bollinger trading is an indicator for mt4 that uses Bollinger bands and other trend following strategies To detect the direction of the market. Just as attached in the screenshot the light blue line shows areas The market is rising. This means opening positions here is in the direction of the trend. The dark blue lines cane be used for sell trades when the market moves in the opposing direction. Using this tactics you can have a clear sense of where the market is headed.

This product works by detecting trend opportunities. So as shown in the screenshot when The indicator shows an upward arrow it shows the market is on an uptrend and when the indicator Shows a downward arrow it shows the market is on a downward direction. What makes this indicator Special is that it has additional signals just below the arrow signals. It is up to the trader to be Creative and combine these signals with the arrow signal to get accurate forecasts.
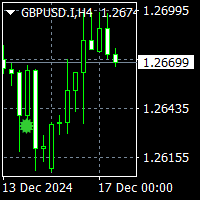
To get access to MT5 version please click here . This is the exact conversion from TradingView: "Exit-Willy Alerts" by " barrettdenning ". This is a light-load processing and non-repaint indicator. All input options are available. Buffers are available for processing in EAs. You can message in private chat for further changes you need. Thanks for downloading

Best Divergence Indicator for advanced traders without distraction of lines or arrows. It is not a magic blackbox for novice traders rather a great tool for experienced traders to decide their entry and exit. Can be used for most of the Forex pairs, Gold, Oil, Crypto. Flexibility to play with input to customize ur unique research too. Therefore, I will suggest turning off arrows and divergence line to reduce clutter and instead use the following advice: For sell on divergence indicator start tu
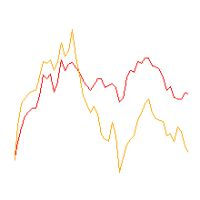
Line1: simple calculation of change in closing price for the chosen input period - named Velocity. Line2: simple calculation of change in velocity for the chosen input period - named Acceleration. Feel free to play with the input periods to find a profitable combination. For faster results it is best to do it in MT Optimizer. Can assist in either manual or automatic trading.

After your purchase, feel free to contact me for more details on how to receive a bonus indicator called VFI, which pairs perfectly with Easy Breakout for enhanced confluence!
Easy Breakout is a powerful price action trading system built on one of the most popular and widely trusted strategies among traders: the Breakout strategy ! This indicator delivers crystal-clear Buy and Sell signals based on breakouts from key support and resistance zones. Unlike typical breakout indicators, it levera

Special offer : ALL TOOLS , just $35 each! New tools will be $30 for the first week or the first 3 purchases ! Trading Tools Channel on MQL5 : Join my MQL5 channel to update the latest news from me El indicador Supertrend Fakeout es una versión mejorada del clásico indicador Supertrend , diseñado para ofrecer señales de tendencia más fiables. Al incorporar características avanzadas como Fakeout Index Limit y Fakeout ATR Mult , este indicador ayuda a filtrar las falsas inversiones d
FREE
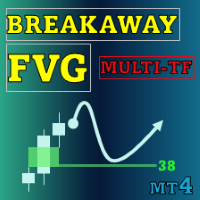
Special offer : ALL TOOLS , just $35 each! New tools will be $30 for the first week or the first 3 purchases ! Trading Tools Channel on MQL5 : Join my MQL5 channel to update the latest news from me La herramienta Breakaway Fair Value Gaps (FVG) es una solución innovadora diseñada para que los traders identifiquen áreas donde el precio se ha alejado del equilibrio, proporcionando conocimientos detallados sobre las probabilidades de mitigación. Esta herramienta no solo destaca señale

Upper and Lower Reversal - Sistema de previsión temprana de momentos de inversión. Le permite encontrar puntos de inflexión de precios en los límites de los canales de movimiento de precios superior e inferior.
El indicador nunca cambiará de color ni cambiará la posición de las flechas de señal. Las flechas rojas son una señal de compra, las flechas azules son una señal de venta.
Se ajusta a cualquier marco de tiempo e instrumento comercial. El indicador no se vuelve a dibujar, sólo funciona c

This Simple Smart Money Concepts indicator displays real-time market structure (internal & swing BOS / CHoCH), order blocks, premium & discount zones, equal highs & lows, and much more...allowing traders to automatically mark up their charts with widely used price action methodologies.
"Smart Money Concepts" (SMC) is used term amongst price action traders looking to more accurately navigate liquidity & find more optimal points of interest in the market. Trying to determine where institutional
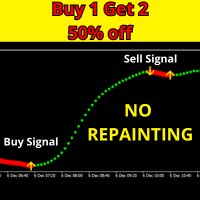
Características Principales: Algoritmo Avanzado y Probado: El Scalper Trend Signals No Repaint está equipado con uno de los algoritmos más optimizados del mercado, garantizando un análisis de tendencias preciso y confiable. Con más de 15,000 pruebas realizadas globalmente, es altamente eficaz para traders de todos los niveles. Filtros Únicos contra Señales Falsas: El nuevo indicador viene con filtros algorítmicos exclusivos que minimizan las señales falsas. Esto lo convierte en una herramienta e
Indicador Binary exfish para MT4 El indicador Binary exfish está diseñado para opciones binarias en los marcos temporales M1 y M5 . Funciona con cualquier par de divisas, analizando la tendencia y proporcionando señales en forma de flechas en el gráfico: Flecha azul — señal de compra. Flecha roja — señal de venta. Características: Expiración por defecto : 1 vela. Expiración ajustable: de 1 a 3 velas. Las señales aparecen antes del cierre de la vela actual para facilitar decisiones oportunas. Ale

Indicador de interés del mercado: su ventaja en el análisis del sentimiento comercial Beneficios clave: Cuantifica la participación de los participantes del mercado en tiempo real Combina la acción del precio y la dinámica del volumen. Revela el sentimiento oculto del mercado más allá de los indicadores tradicionales Adaptable a múltiples marcos temporales y activos. Sistema de alerta temprana para posibles cambios de tendencias Ventajas para el comerciante: Identificar períodos de aumento/dismi
The Circle Intelligent Trend Indicator is a cutting-edge tool designed for MetaTrader 4 users who demand efficiency. This indicator brings the seamless TradingView experience directly to MT4, eliminating the need for templates and simplifying your trading setup.
Its standout feature is the Circle buy and sell signals, which are optimized for multi-timeframe analysis, allowing traders to make informed decisions with confidence. Whether you’re scalping, day trading or swing trading, the Circle I
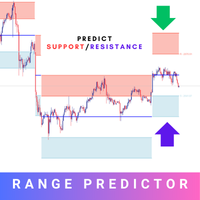
Introducing the Range Predictor : Your Ultimate Guide to Future Trading Ranges! Imagine having the power to see into the future of market moves— Range Predictor brings this dream to life. Designed to deliver real-time, predictive support and resistance levels , this tool goes beyond standard indicators, offering trend direction insights and precise range forecasts . Whether you're a day trader or a swing trader, the Range Predictor is your all-in-one toolkit for mastering the markets. MT5 Ver

This custom indicator for MetaTrader 4 is a powerful tool designed to help traders of all experience levels identify clear trends in the financial market. It is built to provide precise visual support, eliminating the confusion and subjectivity often associated with chart analysis. Additionally, it ensures that you can stay in a profitable position throughout the entire duration of a trend, avoiding premature exits before the movement is fully realized. Identifying Clear Trends The foundation o

The "BioStar" indicator is an innovative tool for trend analysis on the Forex market. It has unique capabilities and a wide range of settings that will help traders make informed decisions when trading.
This indicator is based on the analysis of the market trend and helps to identify the direction of price movement. It uses various mathematical algorithms and statistical methods to determine the strength and stability of the trend in the market.
One of the key features of the "BioStar" indica
Overview
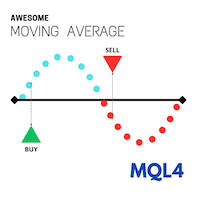
Discover a powerful yet simple indicator to identify market trends effectively! Awesome Moving Average (AWMA) is designed to detect bullish or bearish trends by analyzing price breakouts beyond the moving average line. Basically, the way this indicator works is similar to the Moving Average indicator available on the MetaTrader platform. As we know, the Moving Average indicator tends to be difficult to use when the market is in a sideways condition because it often gives false breakou
FREE

Hello, I need reviews from you guys. Thank you Fractal Swing Detector Pro Indicator is designed to help traders identify key swing points in the market . By combining fractal an d pivot analysis, this indicator provides deeper insights into price movements an d potential reversals. Key Features: Fractal Analysis: Identify high and low fractals with the option to use either 3 or 5 bar fractals . Fractals help detect minor reversal points within trends. Pivot Points: Advance d pivot
FREE
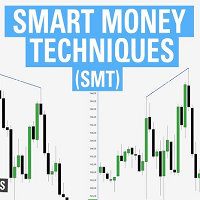
ICT SMT divergence represent a situation in the market where two correlated assets, being seen within the same timeframe, exhibit opposing structure. This can be seen in two positively correlated assets, as one asset forming a higher low, while the other forming a lower low instead of higher low. Version 1.03: Add Higher Timeframe support An ICT SMT divergence serves as the primary signal of reversal for correlated assets. If two positively correlated assets are moving higher and at a point one

The Market Heart indicator scans market entries after high volatility is noticed. Most big moves occur a short time after market volatility. Most big moves occur a short time after market volatility. The idea is to look for entries after the rectangles form and not necessarily as trade entry signals. . For example, you could use the Retracement Feeder indicator that generates arrow signals.
Market Heart MT5 Version
How to use: 1. Primary use The White Box is the first to be formed and

The indicator is a histogram that is great for showing when to enter the market
When the hump moves above the median go long and when it moves below the median go short
The colors can be adjusted as preferred
Suitable for any timeframe
Test in demo before purchase
Enjoy -------------------------------------------------------------------------------

The Breakaway Fair Value Gap (FVG) is a typical FVG located at a point where the price is breaking new Highs or Lows.
USAGE Figure 1 In the figure 1, the price range is visualized by Donchian Channels.
In theory, the Breakaway FVGs should generally be a good indication of market participation, showing favor in the FVG's breaking direction. This is a combination of buyers or sellers pushing markets quickly while already at the highest high or lowest low in recent history. Figure 2 Whi
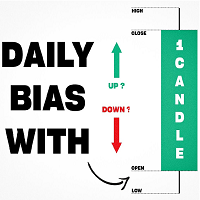
Inspired by TTrades video on daily bias, this indicator aims to develop a higher timeframe bias and collect data on its success rate. While a handful of concepts were introduced in said video, this indicator focuses on one specific method that utilizes previous highs and lows. The following description will outline how the indicator works using the daily timeframe as an example, but the weekly timeframe is also an included option that functions in the exact same manner.
On the daily timefr

EMA Cloud System is a Trading System Invented by Ripster where areas are shaded between two desired EMAs. The concept that the EMA cloud area serves as support or resistance for Intraday & Swing Trading. Can be utilized effectively on 10 Min for day trading and 1Hr/Daily for Swings. Ripster utilizes various combinations of 5-12 EMA clouds 34-50 EMA clouds among others. 8-9, 20-21 EMA clouds can be used as well. Adjust what works for you. Ideally 5-12 or 5-13 EMA cloud acts as sold fluid Trendlin
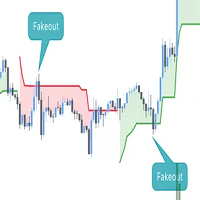
This script is an enhanced version of the classic Supertrend indicator. It incorporates an additional feature that ensures trend reversals are more reliable by introducing a Fakeout Index Limit and a Fakeout ATR Mult. This helps avoid false trend changes that could occur due to short-term price fluctuations or market noise. In smart money concept, when institute , "big-fish" want to buy, they usually sell first to take sellside liquidity and vice versal. This is why the indicator become importan

Manh RSICrossingAlert with Alert Indicator is a versatile technical analysis tool that aids traders in identifying market trends and potential entry and exit points. It features a dynamic Manh RSICrossingAlert , adapting to market conditions for a clear visual representation of trend direction. Traders can customize parameters to align with their preferences and risk tolerance. The indicator assists in trend identification, signals potential reversals, serves as a trailing stop mechanism, and p

Special offer : ALL TOOLS , just $35 each! New tools will be $30 for the first week or the first 3 purchases ! Trading Tools Channel on MQL5 : Join my MQL5 channel to update the latest news from me Volumatic VIDYA (Variable Index Dynamic Average) es un indicador avanzado diseñado para rastrear tendencias y analizar la presión de compra-venta en cada fase de una tendencia. Utilizando el Promedio Dinámico de Índice Variable (Variable Index Dynamic Average) como técnica principal de s

FX Dynamic: Rastrea la volatilidad y las tendencias con un análisis ATR personalizable Descripción general
FX Dynamic es una herramienta potente que emplea los cálculos de Average True Range (ATR) para brindar a los traders información incomparable sobre la volatilidad diaria e intradía. Al establecer umbrales de volatilidad claros —por ejemplo, 80%, 100% y 130%— puedes identificar rápidamente oportunidades de beneficio o recibir alertas cuando el mercado excede sus rangos habituales. FX Dynam

Special offer : ALL TOOLS , just $35 each! New tools will be $30 for the first week or the first 3 purchases ! Trading Tools Channel on MQL5 : Join my MQL5 channel to update the latest news from me SMC es un enfoque de trading que ayuda a los traders a identificar zonas de liquidez, posiciones de órdenes institucionales y puntos clave de giro del mercado. Al aprovechar los principios de SMC, los traders pueden navegar por el mercado de manera más efectiva, encontrando entradas y sa

Forex Gunslinger es un indicador de señales de reversión de COMPRA/VENTA diseñado en torno a la idea de combinar soporte/resistencia, cruces y osciladores en modo MTF. Cuando todo está alineado, el indicador genera una señal de COMPRA o VENTA. Aunque el indicador se basa en la idea MTF, el algoritmo es muy estable y genera señales de reversión confiables. Este es un indicador de tipo MTF donde puede usar un marco de tiempo mayor o menor para calcular las señales para su gráfico actual. Pero tamb
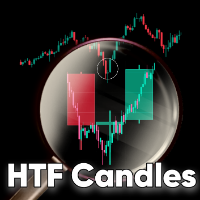
HTF Candles MT4 is a mt4 indicator which plots the outline of the higher time-frame candles on the lower candle, including any MT5 higher time-frame chosen. The indicator gives you the option to choose whether or not to view live current HTF candle, with no lag or repainting. Features MT5 Period Candles: This indicator plots any mt5 time-frame candle e.g m3, m5, m12, m15, m20... and so on, on the lower time-frame. Heiken Ashi Options: You have the option to view the HTF Heiken ashi instead of
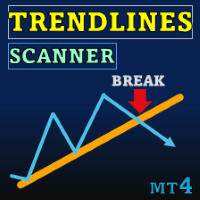
Special offer : ALL TOOLS , just $35 each! New tools will be $30 for the first week or the first 3 purchases ! Trading Tools Channel on MQL5 : Join my MQL5 channel to update the latest news from me Trendlines with Breaks Scanner es una herramienta de trading de última generación diseñada para ayudar a los traders a identificar tendencias críticas y detectar rupturas en tiempo real. Con líneas de tendencia generadas automáticamente basadas en puntos de pivote, este indicador permite

¡GOLDEN ARROW SCALPER! Principales Características: Señales de Entrada Precisas : Identifica los momentos ideales para entrar al mercado basándote en cálculos matemáticos, optimizando tus decisiones de trading. Alertas Instantáneas : Recibe notificaciones sonoras en tiempo real cada vez que se generen señales de trading. Configuración Personalizable : Ajusta los parámetros de las EMAs para adaptar el indicador a tu estrategia y estilo de trading. Visualización Intuitiva : Utiliza colores contra
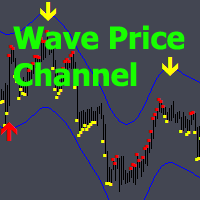
Wave Price Channel: sistema analítico comercial diseñado para buscar impulso y corrección.
El indicador le permite trabajar en la dirección del canal de precios, que se construye sobre la base de la volatilidad.
Cuando se dibuja una flecha hacia arriba o hacia abajo en el canal, es posible ir en esta dirección; la señal en esta dirección se confirma mediante un indicador de puntos que es sensible a los cambios de precio.
Mientras continúen los puntos del mismo color, la señal continúa. Si hay u

High, Low, Open, and Close of Candles: Utilizing the Bombafkan Indicator Tool With the Bombafkan Indicator, you can easily view the high, low, open, and close of candles and analyze this price information across different timeframes. This feature helps you perform more accurate analyses and optimize your trading strategies with a comprehensive view of price movements. Additionally, the Bombafkan Strategy includes a setup called the "Candle-Side Signal," which allows you to easily take bu

Golden Scalper XAU/USD – El Indicador Perfecto para el Trading de Scalping en Oro (XAU/USD) Si eres un trader en el mercado de oro (XAU/USD) y estás buscando una herramienta poderosa para maximizar tus ganancias con una estrategia de scalping eficiente, entonces Golden Scalper XAU/USD es la opción perfecta para ti. Este indicador utiliza técnicas avanzadas de reconocimiento de patrones para ofrecerte señales de entrada altamente precisas , asegurando que cada operación esté respaldada por datos

Indicador Crypto_Forex "Force Index con zonas dinámicas de sobrecompra/sobreventa" para MT4, sin repintado.
- Force Index es uno de los principales indicadores que combina datos de precio y volumen en un único valor. - Es ideal para realizar operaciones de venta desde una zona dinámica de sobrecompra y operaciones de compra desde una zona dinámica de sobreventa. - Este indicador es excelente para realizar operaciones de impulso en la dirección de la tendencia. - Zona dinámica de sobrecompra: p
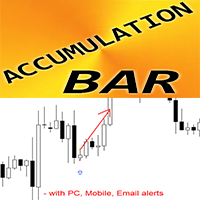
Indicador Crypto_Forex Patrón de barra de acumulación para MT4.
- El indicador "Barra de acumulación" es un indicador muy potente enfocado en rupturas para el trading de acción del precio. - El indicador detecta la acumulación de precios en un área estrecha durante 1 barra y muestra: Dirección de ruptura, Orden pendiente y ubicaciones de SL. - Barra de acumulación alcista: señal de flecha azul en el gráfico (ver imágenes). - Barra de acumulación bajista: señal de flecha roja en el gráfico (ver
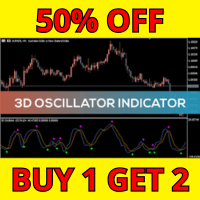
Los 7 Beneficios del 3D Oscillator Perspectiva Triple del Mercado El nombre "3D Oscillator" no es una coincidencia. Combina tres indicadores consagrados (RSI, Estocástico y CCI) en un solo panel. Esta combinación ofrece una visión tridimensional del mercado, ayudándote a descubrir tendencias ocultas y evitar trampas. Configuración Personalizable Con parámetros ajustables como D1RSIPer, D2StochPer y D3tunnelPer, el indicador se adapta a cualquier estilo de trading, ya seas un scalper agresivo o
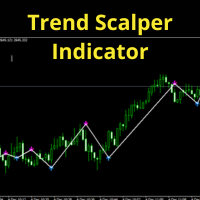
Características Principales: Reconocimiento Automático de Patrones: La IA integrada analiza el comportamiento del mercado en tiempo real para identificar patrones recurrentes de alta probabilidad. Reconoce figuras clásicas como triángulos, banderas y hombro-cabeza-hombro, además de patrones sutiles identificados por la IA. Señales de Compra y Venta: Las señales de entrada se muestran directamente en el gráfico mediante flechas visuales (verde para compra, rojo para venta) y están acompañadas de
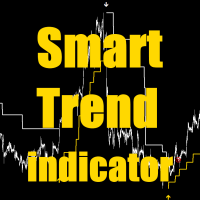
SmartTrend es un indicador que utiliza algoritmos de inteligencia artificial para optimizar el trading en el mercado Forex. Ofrece a los traders oportunidades para adaptar sus estrategias a las condiciones del mercado. Funciones Clave de SmartTrend: 1. Cálculo Automático de StopLoss : o El indicador determina los niveles de StopLoss en función de la volatilidad actual, ayudando a minimizar riesgos. 2. Función de StopLoss de Emergencia : o Se activa cuando cambian las tendencia

Indicador de ruptura de compra y venta + Confluencia ¿Qué es la estrategia de ruptura? En términos de trading, una ruptura significa que el precio de un activo financiero, como una acción, se mueve fuera de su rango de negociación determinado, que a menudo se indica mediante sus niveles de soporte y resistencia. La idea detrás de las rupturas de trading es que cuando el precio finalmente sale del rango de negociación anterior, se espera que el movimiento del precio continúe en la misma direcció
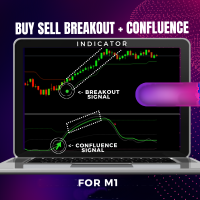
Por favor, CONTÁCTEME después de la compra para obtener mis consejos de trading.
COMPRAR VENDER Indicador de ruptura + Confluencia
¿Qué es la estrategia de ruptura?
En términos de trading, una ruptura significa que el precio de un activo financiero, como una acción, se mueve fuera de su rango de negociación determinado, que a menudo se indica mediante sus niveles de soporte y resistencia. La estrategia de ruptura se centra en identificar las tendencias del mercado tan pronto como se rompen.

Scalper Boss es una herramienta analítica avanzada diseñada para evaluar las condiciones del mercado e identificar los puntos óptimos de entrada y salida mediante un marco lógico multicapa. Se adapta a los entornos cambiantes del mercado y proporciona señales visuales claras junto con líneas de tendencia. Su principal valor radica en su capacidad para filtrar ruido y capturar movimientos significativos, mejorando la eficiencia del análisis de mercado, especialmente útil para scalping y trading i

Please contact me after your full purchase for great bonuses.
Adaptive Reversal Star Expert Advisor and an additional indicator as a gift Info Panel are waiting for you. Adaptive Reversal Star is a new generation indicator with an advanced Adaptive algorithm , which additionally tracks potential reversal points and compares the values of the current market volatility when forming the main signals

Bitcoin 999 - is a trend indicator that automatically analyzes the market and provides information about the trend and each of its changes, as well as giving signals for entering trades without redrawing! The indicator uses each candle, analyzing them separately. referring to different impulses - up or down impulse. Exact entry points into transactions for currencies, crypto, metals, stocks, indices!
Main functions: Accurate entry signals WITHOUT REPAINTING! Once a signal appears, it remains
FREE

The Trend Ultimate Indicator is designed for visualizing and analyzing market trends, allowing traders to quickly assess current market tendencies. It is particularly useful for: Determining the duration of the current trend (bullish or bearish). Providing a clear visualization of price behavior relative to key moving averages and the MACD indicator. Supporting decision-making based on histogram dynamics (trend direction and intensity). Trend Ultimate does not guarantee profit but assists trader

What are Fair Value Gaps (FVG)? Fair Value Gaps occur when price moves so quickly that it creates an imbalance between buyers and sellers. These gaps represent areas where price "skipped" levels, creating potential zones for price to return and "fill the gap". Think of it as unfinished business in the market that often gets revisited. They are also considered a support or resistance area because it represents a zone on a chart where there is a significant imbalance between supply and demand, ca
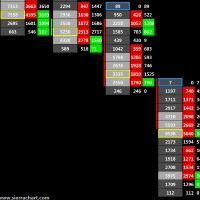
Volume Cluster Indicator for MetaTrader 4: Advanced Analysis of Support, Resistance, and Market Dynamics The Volume Cluster Indicator for MetaTrader 4 is a powerful tool designed for traders seeking an in-depth understanding of market dynamics. It provides detailed insights into volume behavior within each candlestick, highlighting levels where volume is "overpriced" and areas of weakness. This enables precise identification of support and resistance zones, making it indispensable for traders le
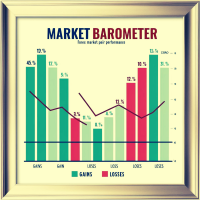
Market Barometer is a cheat code for trading, it acts as a "barometer" for market sentiment across various pairs, showcasing their changes. You can tell right away what to trade. You can trade trends or reversals. MT5 Version: https://www.mql5.com/en/market/product/127467 Market Barometer is a powerful tool designed to track and visualize the percentage changes across multiple currency pairs. By analyzing the price shifts of different forex pairs, it helps you understand how they are correlat
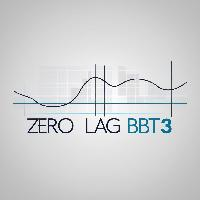
Is Zero Lag profitable? Not always, different system is for different pairs. You can play around with this indicator from Mladen, I have modified it with Bollinger Bands over T3.
You can change the period and how it calculate. MT5 version is available too.... Please leave a review , it helps us and we will share more indicators. .... Thank you and happy trading
FREE
Old Time Frame EMA Индикатор двух динамических уровней сопротивления и поддержки Moving Average.
Данный индикатор рисует на открытом графике младшего тайм фрейма, ЕМА со старшего тайм фрейма. Создан для наглядности сигналов, для входа в рынок, для тех трейдеров, у кого Средние Скользящие Цены (ЕМА или МА),
являются основным сигналом для открытия или закрытия сделок. А также ориентиром, направлением тренда в движении
текущих цен, внутри дня и в среднесрочной торговле.
Возможные типы сред

Indicator designed for both beginners and professionals. This indicator will help you: reduce the number of errors when opennig orders; predict price movement(in absent of significant news); do not rush to close profitable trades prematurely and increase profit; do not rush to enter the market and wait for "easy prey": and increase the profitability of trading. BUY and SELL signals, ALARM and PUSH - https://www.mql5.com/ru/market/product/127003
FREE
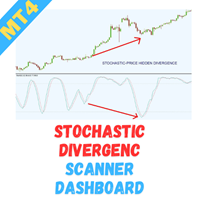
Welcome to the Stochastic Divergence Multicurrency Scanner Dashboard , an advanced tool designed to help traders efficiently detect Stochastic divergence patterns across multiple currency pairs. This scanner enables swift identification of potential reversal opportunities, providing a strategic advantage in your trading endeavors. Key Features: Effortless Multicurrency Scanning Monitor multiple currency pairs in real-time and receive instant alerts when significant Stochastic divergence patterns
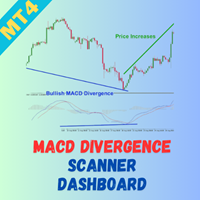
Welcome to the MACD Divergence Multicurrency Scanner Dashboard , a powerful tool designed to help traders quickly detect MACD divergence patterns across multiple currency pairs. This scanner allows for efficient identification of potential reversal signals, giving you a competitive edge in your trading strategy. Key Features: Effortless Multicurrency Scanning Monitor multiple currency pairs in real-time and receive instant alerts when significant MACD divergence patterns are identified. This cap

Everyone has heard that 95% of traders lose money, well join the 5% profitable one with 'The 5 Percent.
The 5 Percent Indicator: Join the Elite 5% of Traders. Manage risk and stay in the game by following the trends. Tired of being part of the 95% who lose money? The 5 Percent Indicator is your key to unlocking consistent profitability. This powerful tool provides clear, actionable signals, helping you make informed trading decisions and maximize your returns. Don't miss out on your chance to j

If you ever wanted to know your local time (or NY time) at any bar on the chart without needing to waste time with mental calculations, look no further.
This indicator creates a crosshair which you can drag anywhere on the chart and will show you the local time in a label on top of the time axis.
Press the "c" key to show/hide the crosshair. Left click it to pick it up and drag anywhere, left click again let it go.
You can't hide the crosshair without letting it go first.
Time setting inputs
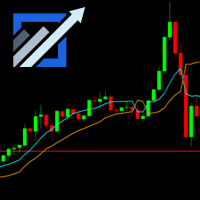
Boost your trading accuracy with the SSL Channel Indicator , designed to identify trends and precise entry points. This dynamic tool adapts to all trading instruments and timeframes. Perfect for scalpers, day traders, and swing traders, the SSL Channel Indicator simplifies market analysis, helping you trade confidently and effectively. Unlock your trading potential today! MT5 Link- https://www.mql5.com/en/market/product/127492
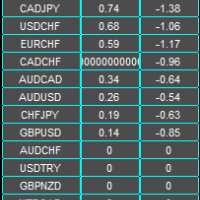
Abbeyfx Swap Dashboard displays your broker swap/interest rate. The implied swap/interest rate differential is for all currency pairs you have in your market watch.
Interest rate differential: The key factor traders consider is the difference in interest rates between two currencies involved in a pair, known as the "interest rate differential
Impact on currency value: A higher interest rate typically makes a currency more attractive, causing its value to rise relative to other currencies with
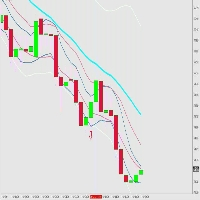
Signal Entry BBMA Low Risk High Reward Entry Friendly Use Using Fibo for TP 1, TP 2 , TP 3 , TP 4, TP 5, TP 6 , TP 7 , TP 8 , TP 9 , TP 10 Entry Low MA or Entry High MA Pair GOLD is The Best Pair EURUSD, GBPUSD, USDJPY Is Good Pair BTCUSD id Good Risk Manajemen only 1% entry and you get Profit 2-10% Recommended Broker https://one.exnesstrack.org/a/yyatk129ng If you want FullMargin Is Good but I recommended using Manajemen your Money

Special offer : ALL TOOLS , just $35 each! New tools will be $30 for the first week or the first 3 purchases ! Trading Tools Channel on MQL5 : Join my MQL5 channel to update the latest news from me ¡Descubre el poder del concepto de Inversion Fair Value Gap (IFVG) de ICT con el Inversion Fair Value Gaps Indicator ! Esta herramienta de última generación lleva los Fair Value Gaps (FVG) al siguiente nivel al identificar y mostrar zonas de FVG invertidas, que son áreas clave de soporte

Resumen del producto gratuito pero avanzado Turbo Trend es un indicador poderoso diseñado para ayudar a los traders a identificar y actuar sobre las tendencias del mercado. Utiliza una combinación de medias móviles avanzadas y análisis de volumen para proporcionar señales claras de la dirección de la tendencia. Turbo Trend simplifica la toma de decisiones al categorizar las condiciones del mercado en tres estados distintos: Tendencia alcista , Tendencia bajista y Tendencia neutral, usando línea
FREE
Special offer : ALL TOOLS , just $35 each! New tools will be $30 for the first week or the first 3 purchases ! Trading Tools Channel on MQL5 : Join my MQL5 channel to update the latest news from me Descripción general
OA SnR Power es una herramienta poderosa diseñada para ayudar a los traders a identificar y evaluar la fortaleza de los niveles de soporte y resistencia. Al incorporar factores clave como el volumen de operaciones, la frecuencia de rebote y el recuento de pruebas, es
FREE
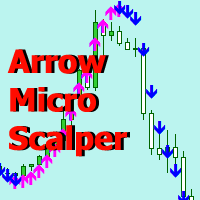
Arrow Micro Scalper es un indicador diseñado para especulación y comercio a corto plazo, integrado en cualquier gráfico e instrumento financiero (monedas, criptomonedas, acciones, metales).
En su trabajo utiliza análisis de ondas y un filtro de dirección de tendencia. Recomendado para usar en marcos de tiempo de M1 a H4.
Cómo trabajar con el indicador.
El indicador contiene 2 parámetros externos para cambiar la configuración, el resto ya está configurado de forma predeterminada. Las flechas gr

Indicador Slope Channel para MetaTrader
¿Buscas una herramienta para analizar tendencias del mercado que se adapte a cualquier estilo de trading? Slope Channel – ¡Tu asistente confiable para identificar movimientos de precios y niveles clave del mercado! ¿Qué es Slope Channel? Slope Channel es un indicador innovador que construye un canal inclinado en el gráfico, calculando automáticamente sus parámetros basados en extremos locales. Esta herramienta destaca la opción óptima del canal, pe
FREE
El Mercado MetaTrader es una plataforma única y sin análogos en la venta de robots e indicadores técnicos para traders.
Las instrucciones de usuario MQL5.community le darán información sobre otras posibilidades que están al alcance de los traders sólo en nuestro caso: como la copia de señales comerciales, el encargo de programas para freelance, cuentas y cálculos automáticos a través del sistema de pago, el alquiler de la potencia de cálculo de la MQL5 Cloud Network.
Está perdiendo oportunidades comerciales:
- Aplicaciones de trading gratuitas
- 8 000+ señales para copiar
- Noticias económicas para analizar los mercados financieros
Registro
Entrada
Si no tiene cuenta de usuario, regístrese
Para iniciar sesión y usar el sitio web MQL5.com es necesario permitir el uso de Сookies.
Por favor, active este ajuste en su navegador, de lo contrario, no podrá iniciar sesión.