Nuevos indicadores técnicos para MetaTrader 4 - 45
This is a breakout Indicator for MT4 where you can open trades after a breakout has occurred. This indicator will draw blue boxes on the chart. You simply have to follow price until it breaks out of the box and make sure that the candle had closed above the breakout if its a buy trade and the candle must close below if its a sell trade. An alert will now pop up with suggested price entry and TP of 15 pips default. You can change TP Pis depending on your choice The indicator can trade almost any
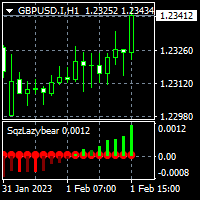
For MT5 version please click here . - This is the exact conversion from TradingView source: "Squeeze Momentum Indicator" By "LazyBear". - This is a non-repaint and light processing load indicator. - Buffers and inputs are available for use in EAs and optimization purposes. - You can message in private chat for further changes you need.
Thanks for downloading...

UR Vortex
The Probabilistic UR Vortex Formula: An Accurate System for Predictive Market Analysis using Volatility and Standard Deviation Calculations. The UR Vortex indicator is a technical analysis tool that uses volatility and standard deviation calculations to predict potential tops and bottoms in a market. It measures the strength of a trend by calculating the distance between the current price and a moving average, and then standardizing this distance by dividing it by the average true

MACD (short for M oving A verage C onvergence/ D ivergence) is a popular trading indicator used in technical analysis of securities prices. It is designed to identify changes in the strength, direction, momentum, and duration of a trend in a security's price.
History Gerald Appel created the MACD line in the late 1970s. Thomas Aspray added the histogram feature to Appel's MACD in 1986.
The three major components and their formula 1. The MACD line: First, "PM Colored MACD" employs two Moving

To get access to MT5 version please click here . - This is the exact conversion from TradingView: "Twin Range Filter" by "colinmck".
- The screenshot shows similar results from tradingview and Metatrader when tested on ICMarkets on both platforms.
- This is a light-load processing and non-repaint indicator.
- All input options are available.
- Buffers are available for processing in EAs.
- You can message in private chat for further changes you need.
Here is the sample code of EA that operates

OB Breakout is alert indicator that identifies when a trend or price move is approaching exhaustion(Supply and Demand) and ready to reverse. It alerts you to changes in market movement which typically occur when a reversal or major pullbacks are about to or have happened. The indicator identifies breakouts and price momentum initially, every time a new high or low is formed near a possible Supply or Demand level point. The indicator draws in a rectangle on Supply or Demand Zones. Once price we

Key Level Key Level is a MetaTrader 4 Indicator that uses a proprietary algorithm based on Price Retracement/Breakout Method to show the Entry-Line on your trading.
Instead, it analyzes data of market and identify entry points and opportunities. (Price Retracement / Price Breakout)
It's also a trading tool that be used to practice and enhance your manual trading skills.
Key Level is an amazing tool for Scalping Trader. It also a trading tool that be used to practice and enhance your manual trad

Previous Period High Low . This indicator shows the previous Day, Week, Month and Years High and Low. It's great for price action strategies. : Provides clear and visible breaks in structure. : Easy to see breakout levels. : Easy to see gaps between previous high, low levels after breakouts have occurred. The indicator works on every time frame. Multiple periods can be selected and be seen on the same chart. Every line can be customized to Your liking. Color, style and thickness. Enjoy!
RumahForexID Momentum Scalping Indicator is the best momentum indicator ever created, and why is that? The indicator works on all timeframes and assets, the indicator is made after 6 years of experience in forex. You know many momentum indicators on the internet are unhelpful, and difficult to trade, but RumahForexID Momentum Scalping Indicator is different , The indicator shows wave momentum, when the market is about to trend or consolidate, all that in one simple and clear indicator!
RumahFo

Este indicador es una super combinación de nuestros 2 productos Advanced Currency IMPULSE with ALERT + Currency Strength Exotics .
¡Funciona para todos los marcos de tiempo y muestra gráficamente el impulso de fuerza o debilidad para las 8 divisas principales más un Símbolo!
Este Indicador está especializado en mostrar la aceleración de la fuerza de la divisa para cualquier símbolo como Oro, Pares Exóticos, Materias Primas, Índices o Futuros. Es el primero de su clase, cualquier símbolo p

Este indicador utiliza múltiples indicadores para generar operaciones de señales ganadoras El indicador R Signals es un completo sistema de negociación de divisas que imprime flechas precisas de compra y venta en el gráfico.
El indicador aparece en la ventana principal del gráfico MT4 como flechas de color verde y rojo.
El uso de señales generadas por un solo indicador puede ser riesgoso al operar. Esto se debe a que usar solo un indicador para operar puede dar más señales falsas. Por lo tant

Versión MT5 | Indicador Trend Monitor VZ | Indicador Owl Smart Levels | Estrategia Owl Smart Levels | FAQ La teoría de ondas de Elliott es una interpretación de los procesos en los mercados financieros que se basa en un modelo Visual de ondas en gráficos de precios. El indicador Valable ZigZag muestra la estructura de onda del mercado en la que se puede confiar para tomar decisiones comerciales. El indicador Valable ZigZag es más estable y no cambia a menudo su dirección como el i
FREE
"IF YOU'RE LOOKING FOR A UNIQUE TRADING INDICATOR TO TRADING…AT AN AFFORDABLE PRICE…YOU'VE COME TO THE RIGHT PLACE!" Additional Bonus: You get the ProTrading Arrow indicator for FREE! Many adhere to the rule that if a system has losses, it is not profitable, In forex trading like any business, there are some rules that must be followed. You have to find the strategy that gives the best results. The proper money management and best indicator are the keys to successful trading. Using the adaptive

Un indicador MACD preciso está disponible.
Dashboard Trend Bar Smart Level 9TF Doble MACD. MACD dual, es decir, rápido (MACD 1) y lento (MACD 2) ¿Por qué necesitas un segundo MACD? El uso de indicadores adicionales nos convencerá más en el comercio en vivo Curva 9TF Fast MACD 1 9TF Curva MACD 2 lenta Ángulo MACD en tiempo real 9TF Valor MACD en tiempo real 9TF Dirección MACD en tiempo real 9TFSe encuentra disponible un indicador MACD preciso.
Dashboard Trend Bar Smart Level 9TF Doble MACD. MA

Un indicador estocástico preciso está disponible.
Dashboard Trend Bar Smart Level 9TF Dual Stochastic. Estocástico dual, es decir, estocástico rápido y estocástico lento ¿Por qué necesitas un segundo estocástico? El uso de indicadores adicionales nos convencerá más en el comercio en vivo Curva estocástica rápida 9TF Curva estocástica lenta 9TF Ángulo estocástico en tiempo real 9TF 9TF valor estocástico en tiempo real 9TF dirección/fase estocástica en tiempo real Barra de tendencia 9TF Nuevo al
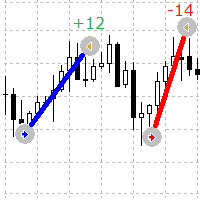
Un indicador simple pero útil para ver visualmente los puntos de entrada y salida de órdenes en el gráfico
Este indicador muestra las órdenes abiertas actuales y las órdenes completadas en el símbolo
Parámetros del indicador
Lines Buy color: especifica el color de las líneas para las órdenes de compra. Lines Sell color : especifica el color de las líneas para las órdenes de venta Lines Width : establece el ancho de línea, funciona para tipos de estilo sólido Lines style : establece el estilo
FREE

El indicador R Stoploss Signals se basa en una tendencia que sigue una media móvil exponencial.
Este indicador de forex genera señales comerciales de compra y venta en forma de líneas azules y rojas dibujadas en el gráfico de actividad.
Las líneas de color azul indican que la tendencia es al alza y esta es una señal para comprar el par de divisas. Las líneas de color rojo indican que la tendencia es a la baja y esta es una señal para vender el par de divisas. También se incluye una línea suge
FREE

El indicador de color R 2EMA para MT4 proporciona señales comerciales sólidas basadas en el cruce de 2 EMA.
Puntos clave Cuando el precio cruza y cierra por encima de los dos EMA verdes, crea una señal comercial de compra. Cuando el precio cruza y cierra por encima de los dos EMA rojos, crea una señal comercial de venta. El indicador R 2EMA Color Forex hace que sea aún más fácil determinar cuándo es el momento de comprar y vender
Se produce una señal de compra cuando las 2 líneas de EMA se vu

El indicador de media móvil R Var es un indicador de seguimiento de tendencias diseñado para seguidores de tendencias acérrimos.
Es un indicador de compraventa de divisas bastante popular entre los comerciantes de acciones, así como entre los comerciantes de productos básicos, y su popularidad se debe a su capacidad para ofrecer señales genuinas de hacer dinero a sus usuarios.
El indicador se compone de puntos verdes y rojos que se colocan en una línea de siena. El punto verde apunta a una se

Gama UR (impulsado por cálculos similares que se encuentran en los sistemas de aprendizaje automático)
UR Gamma es una herramienta de análisis financiero de vanguardia que ofrece una versión nueva y mejorada del indicador clásico WaveTrend. Al incorporar técnicas avanzadas de procesamiento de señales digitales, UR Gamma aborda algunas de las limitaciones de los algoritmos WaveTrend tradicionales y brinda un enfoque más preciso, sólido y dinámico para identificar y medir tendencias en la acción

El indicador R Inside Bar para Metatrader 4 proporciona niveles de desglose de precios fáciles de usar basados en barras internas.
Funciona con la acción del precio puro y no se vuelve a pintar en absoluto, y aparece en la ventana principal del gráfico MT4 en forma de 2 líneas horizontales de colores por encima y por debajo de la barra interior real.
La línea horizontal verde actúa como resistencia y la línea roja como soporte.
Idea comercial larga y corta Abra una orden de compra si la vela
FREE

El indicador R Wavy Dash transforma los datos de precios en un excelente indicador de señales de seguimiento de tendencias que funciona para la entrada y salida de operaciones. Aparece en el gráfico principal como una línea de señales de colores y se puede utilizar como una herramienta de negociación independiente.
El indicador R Wavy Dash es muy confiable, liviano y no ralentizará su plataforma de negociación.
Puntos clave Indicador de señal de tendencia Amigable para novatos no volver a pin

El indicador R Delta RSI dibuja un histograma coloreado de compra y venta basado en el cruce de un RSI rápido (período 14) y un RSI lento (período 50) junto con un nivel de señal.
Un histograma de color rojo indica que la tendencia es alcista (señal de compra). Un histograma de color verde indica que la tendencia es bajista (señal de venta). Un histograma de color gris indica que la tendencia es plana o está limitada por un rango (sin señal).
Este indicador de forex se puede negociar de forma
Bandas UR (con una fórmula utilizada en sistemas de aprendizaje automático)
UR Bands es un indicador derivado a través de una fórmula que incorpora la volatilidad del mercado y es similar en principio a los utilizados en los sistemas de aprendizaje automático. Esta representación matemática de las condiciones del mercado ofrece un análisis preciso de las tendencias y dinámicas de los precios, teniendo en cuenta la volatilidad inherente de los mercados financieros. Al incorporar la volatilidad

El indicador R Show Ticks para Metatrader 4 muestra los ticks arriba/abajo en tiempo real en la ventana principal de negociación.
Conclusiones clave Una flecha blanca es un repunte. Una flecha roja es un downtick. El indicador funciona para cualquier par de divisas y marco de tiempo de su preferencia.
Especificaciones del indicador Plataforma de Trading: Desarrollada para Metatrader 4 (MT4)
Pares de divisas: funciona para cualquier par
Marcos de tiempo: funciona para cualquier marco de tiem

Pivot Classic, Woodie, Camarilla, Fibonacci and Demark
Floor/Classic Los puntos de pivote, o simplemente pivotes, son útiles para identificar posibles niveles de soporte/resistencia, rangos de negociación, reversiones de tendencia y sentimiento del mercado al examinar los valores máximo, mínimo y de cierre de un activo. Los puntos de pivote Floor/Classic se pueden calcular de la siguiente manera. Pivot Point (P) = (High + Low + Close)/3 S1 = P * 2 - High S2 = P - (High - Low) S3 = Low – 2*(High
FREE
The ALL MOVING AVERAGES custom indicator is your go-to tool for comprehensive technical analysis, featuring over 31 of the most popular moving averages. Whether you’re a seasoned trader or just starting out, this indicator allows you to customize your moving averages to fit various trading strategies perfectly.
With a range of input parameters to choose from, including periods and different price calculation types, you can easily tailor the indicator to suit your trading style.
Additional Feat

Prometheus Trade Engine is an indicator that combines price action, ratio based indicator with custom indicators& other lagging indicators to create this leading indicator that has a multi-timeframe approach to trading so that you are able to see what other timeframes are doing all in one chart and give you high probability trade setups to assist you to make a prediction on what is MOST likely to happen in the market going foward
Chart Features 1. Reversal Zone
It is the rectangular box on you

This indicator does not process the price chart data and does not provide trading signals. Instead, it is an application to compute and display the frequency response of many conventional indicators. Moving averages like the SMA, LWMA and EMA, and oscillators like the MACD, CCI, Awsome Osc, all have the form of digital filters. Electronic engineers use a special method to characterise the performance of these filters by studying their frequency response. Two important quantities of the freque
FREE
This Amazing Signal Entry indicator is designed for signal trading. This indicator generates trend signals.
It uses many algorithms and indicators to generate this signal. It tries to generate signals from the points with the highest trend potential.
This indicator is a complete trading product. This indicator does not need any additional indicators.
The indicator is never repainted. The point at which the signal is given does not change. When the signal comes the arrows are put back one
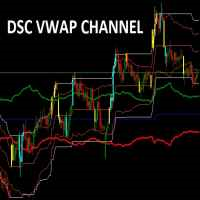
Corretora recomendada para usar esse indicador: https://tinyurl.com/5ftaha7c
Indicador usado para sabermos os pontos de suporte de resistência no gráfico. Funciona em todos ativos e timeframes.
Acerte exatamente os pontos de entradas e saídas das suas operações. SEE OUR RESULTS ON INSTAGRAM: https://www.instagram.com/diogo.cansi/ TELEGRAM GROUP = https://t.me/robosdsc More information by email dscinvestimentos@gmail.com or by Whatsapp 55-991372299
FREE

updated hidden market support and resistance. this indicator is made for new current market that has new support and resistance that some traders struggle to see. The indicator works on all timeframes from the 1-minute timeframe to the monthly One Trading tip to use When price is at resistance and the indicator appears wait for a bearish candle to close then enter a sell trade. Same applies for a buy trade when price reaches support level, and the indicator appears wait for the bullish candle
FREE

Shows the price fluctuation bands associated with a moving average. It is extremely accurate, and it's a wonderful visual guide. The indicator consists of 4 bands . The two bands closest to the price form the fluctuation channel , they mark the maximum calculated deviation of the price from the moving average. The outer bands mark the maximum overdeviation of the price with respect to the fluctuation channel, they are overbought or oversold areas. Features. -The change of periods of the MA is d
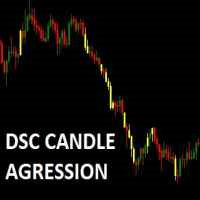
Corretora recomendada para usar esse indicador: https://tinyurl.com/5ftaha7c Indicador que pinta o candle de amarelo em pontos de muita agressão no mercado. Sempre que o mercado for se movimentar o candle irá ficar amarelo. Valido para todos ativos e todos timeframes. SEE OUR RESULTS ON INSTAGRAM: https://www.instagram.com/diogo.cansi/ TELEGRAM GROUP = https://t.me/robosdsc More information by email dscinvestimentos@gmail.com or by Whatsapp 55-991372299
FREE

Unlock the power of the market with the Investment Castle Multi Time Frame Moving Average Indicator. Simplify your trading journey by easily identifying trends and pullbacks across multiple time frames on one convenient chart. This indicator is a must-have tool for any serious trader. Available for MT4 and MT5, and exclusively on the MQL5 market, customize your experience by adding as many indicators as you need on the chart, each with their own unique time frame or period. Enhance your strategy
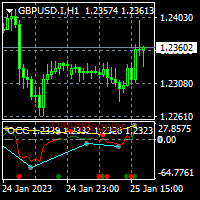
For MT5 version please click here . This is the exact conversion from TradingView: "Open Close Cross Alert R6.2 by JustUncleL" By "JayRogers". - This indicator does not support multi-time frame. - Hidden/Regular divergences supported. - This is a non-repaint and light processing load indicator. - You can message in private chat for further changes you need.

Deviation has a buy and sell input. Figure out the number to trade by. It is according to MACD. Study the values of the past for inputs to trade by. Use in uptrend or downtrend and follow the bigger trend for entry points or reversals. Use other filters or strategies to employ with the indicator for success. - is buy and + is sell. Trade on time frames according to your wish
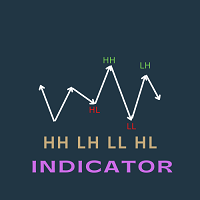
This indicator is very useful to identify the most important patterns of price action strategy. It uses the fractal indicator to identify the highs and lows. It can identify the following four patterns to identify continuation and reversal of a trend Patterns shown in the chart Higher Highs Lower Highs Lower Lows Higher Lows These patterns are visible in the chart . and the most interesting part of this indicator is all of these patterns are stored in different buffer values. Developers can util
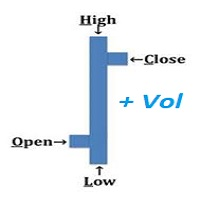
An "Intraday" indicator makes no sense anymore above H1 !! VOHLC is calculated using the following formula: VOHLC= ( Price * Volume ) / Volume Where Price= ( Open + High + Low + Close ) / 4 Volume= Tick Volume This indicator helps us to understand the current direction of the trend in the selected period. Typically, the indicator is calculated for one day, so there is no reason to use it on timeframes larger than the H1 timeframe.
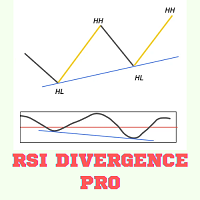
RSI DIVERENCE INDICATOR
RSI divergence is very powerful pattern which is often used to detect a strong trend reversal. it also indicates the weakening of strong signal. So some traders want to use it as the exit criteria. This indicator works in all timeframe and send notification, alert or email to the user. It also show the Higher Highs and Lower Low Pattern with its corresponding RSI divergency. This indicator can be used in Expert Advisors as it has accessible buffers List of Inputs ______

Se encuentra disponible un indicador CCI preciso.
Dashboard Trend Bar Smart Level 9TF Doble CCI. Doble CCI, es decir, CCI rápido y CCI lento ¿Por qué necesita un segundo CCI? El uso de indicadores adicionales nos convencerá más en el comercio en vivo Curva CCI rápida 9TF 9TF Curva CCI lenta Ángulo CCI en tiempo real 9TF 9TF valor CCI en tiempo real 9TF dirección/fase CCI en tiempo real Barra de tendencia 9TF Nuevo algoritmo en el cálculo de la barra de tendencia. Boton de encendido / apagado.

Un indicador RSI preciso está disponible.
Dashboard Trend Bar Smart Level 9TF Doble RSI. Doble RSI, es decir, RSI rápido y RSI lento ¿Por qué necesitas un segundo RSI? El uso de indicadores adicionales nos convencerá más en el comercio en vivo Curva RSI rápida 9TF 9TF Curva RSI lenta Ángulo RSI en tiempo real 9TF Valor RSI en tiempo real 9TF 9TF RSI en tiempo real dirección/fase Barra de tendencia 9TF Nuevo algoritmo en el cálculo de la barra de tendencia. Boton de encendido / apagado. Muy úti
¿Estás cansado de ser un querer ser de Wall Street, constantemente dudando de tus operaciones? Bueno, deja la bola de cristal y entra en el siglo 21 con el indicador "Current Support and Resistance" para MT4. Este chico será tu fiel compañero, analizando el mercado con una profundidad que haría envidioso a Sherlock Holmes. Pero no es solo un truco, oh no. Tiene opciones, ¡bebé! ¿Quieres ver niveles de resistencia y soporte en el gráfico de 1 minuto? Hecho. ¿Y qué tal el gráfico semanal? Lo tiene
FREE

El indicador cruzado R 3MA es un indicador de tendencia popular con alertas basadas en el cruce de 3 promedios móviles, se compone de un promedio móvil más rápido, medio y más lento.
Puntos clave Se producirá una alerta de compra cuando la media móvil más rápida cruce hacia arriba tanto la media móvil media como la media móvil más lenta.
Se producirá una alerta de venta cuando el promedio móvil más rápido cruce hacia abajo tanto el promedio móvil medio como el más lento.
¿Cómo comerciar con
FREE

El indicador R Scalper Arrows proporciona flechas de señal de compra y venta fáciles de leer para cualquier par de divisas.
Es adecuado para la predicción de tendencias a corto plazo: Una flecha hacia arriba indica que el par está en una tendencia alcista a corto plazo. Una flecha hacia abajo indica que el par está en una tendencia bajista a corto plazo. Para operaciones largas, coloque el stop loss debajo del pip.
Para operaciones cortas, coloque un stop loss por encima del pip.
pista Puede
FREE

R Chimp Scalper es una excelente herramienta comercial para especuladores de divisas y comerciantes diarios.
Las señales de este indicador de scalping son muy claras y fáciles de leer.
Dibuja barras verdes y rojas por encima y por debajo del nivel cero en ventanas comerciales separadas: Las barras verdes se alinean por encima del nivel cero, lo que indica una tendencia de especulación alcista. Las barras rojas se alinean por debajo de cero, lo que indica una tendencia bajista de scalping. Las
FREE

El indicador R Silver Trend es un indicador comercial de seguimiento de tendencias que muestra la tendencia actual directamente en el gráfico de actividad de Metatrader 4.
Dibuja dos tipos de velas: El azul es para la acción del precio alcista. Rojo para movimiento de precio bajista.
Operar con el indicador R Silver Trend es bastante fácil incluso para los principiantes absolutos y se puede utilizar para el scalping (M1, M5), el comercio diario (M5, M15, M30) y el comercio oscilante (H1, H4,

El indicador R Alligator fue presentado por Bill Williams, sigue la tendencia con la ayuda de 3 promedios móviles suavizados.
De forma predeterminada, se utilizan los siguientes valores: El promedio móvil suavizado de 13 períodos (conocido como Jaw) El promedio móvil suavizado de 8 períodos (conocido como los dientes) El promedio móvil suavizado de 5 períodos (conocido como los labios)
El indicador R Alligator reduce el número de transacciones de tendencia falsa mediante el uso de promedios m

El indicador R Wolfe Wave analiza la acción del precio y transforma los datos acumulados en una poderosa herramienta técnica de patrones de gráficos de Wolfe Wave. En esencia, el patrón del gráfico R Wolfe Wave puede ser alcista o bajista y podría ayudar a los operadores a abrir operaciones de compra y venta sin ningún indicador rezagado.
Puntos clave Identifica poderosos patrones Wolfe Wave Para comerciantes avanzados Funciona para cualquier par de divisas. Vale la pena agregarlo a su colecci

Trend Rising is a custom MT4 ( Metatrader 4 ) indicator, use best for scalping on TF M30 and below that analyzes the trend and momentum pattern using Bill William Indicators on multiple timeframes. As the result, It identifies the beginning and the end of the trend that works for most currency pairs. The Trend Rising indicator is developed based on Accelerator Oscillator and Awesome Indicator. Key Features Identify the beginning and the end of the trend as display with colors. Identify eas
FREE

[ MT5 Version ] [ Kill Zones ] [ SMT Divergences ] How to trade using Order Blocks: Click here Experience the ultimate in trading precision with the Order Blocks ICT indicator, designed to empower traders with unparalleled insights into market dynamics. This advanced tool leverages order flow and volume analysis to reveal crucial buying and selling pressures driving price action. Why Choose Order Blocks ICT? Unleash Market Insights: Order Flow Analysis: Discern buying and selling pressure
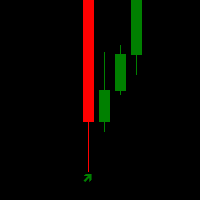
Download the filter for the indicator to work BetterVolume_1_4.mq4 https://drive.google.com/file/d/1Mgsjj7MxZn9yTjwyL7emKkfQKorl40AJ/view?usp=sharing
The arrow indicator without redrawing shows potential entry points to the market in the form of arrows of the appropriate color: the up arrows (usually green) offer to open a purchase, the red down arrows – a sale. The appearance of arrows may be accompanied by sound signals. It is usually assumed to enter at the next bar after the pointer, but t
The indicator is specialized for use in scalping strategies. It has the ability to send buy/sell signals. the indicator highlights signals during the formation of any fresh tick and the investor has the opportunity to apply them not alone, but taking into account the n number of specific signals for a specific time. In other texts, it is necessary to take into account which way the indicator advises trading in its own 5-7 last signals. It is not recommended to use this indicator as a single and

YOU CAN NOW DOWNLOAD FREE VERSIONS OF OUR PAID INDICATORS . IT'S OUR WAY OF GIVING BACK TO THE COMMUNITY ! >>> GO HERE TO DOWNLOAD The system is a free open source pine script originally published on TradingView by everget . It was converted to Mt4 by Forex Robot Makers. This system is a popular trend indicator based on ATR ( Average True Range ) , Moving Averages and the Donchian channel .
System BackGround
ATR The average true range is an indicator of the price volatility of an asse
FREE

This indicator is a too that : calculates position size based on account balance/equity , currency pair, given entry level, stop-loss level and risk tolerance (set either in percentage points or in base currency). It displays reward/risk ratio based on take-profit. Shows total portfolio risk based on open trades and pending orders. Calculates margin required for new position, allows custom leverage.
This Perfective Signal System indicator is designed for signal trading. This indicator generates trend signals.
It uses many algorithms and indicators to generate this signal. It tries to generate a signal from the points with the highest trend potential.
This indicator is a complete trading product. This indicator does not need any additional indicators.
The indicator certainly does not repaint. The point at which the signal is given does not change.
Features and Suggestions Time

This indicator is a useful tool for visualising cyclic components in price. It calculates the Discrete Fourier Transform (DFT) of a price chart data segment selected by the user. It displays the cycles, the spectrum and the synthesised signal in a separate window. The indicator is intended as a learning tool only, being unsuitable for providing actual trade signals. Download the file - it is a free toy. Play with it to understand how signals can be transformed by controlling their cyclic comp
FREE

This Special Strong Arrows indicator is designed for signal trading. This indicator generates trend signals.
It uses many algorithms and indicators to generate this signal. It tries to generate signals from the points with the highest trend potential.
This indicator is a complete trading product. This indicator does not need any additional indicators.
The indicator is never repainted. The point at which the signal is given does not change. When the signal comes the arrows are put back one ca
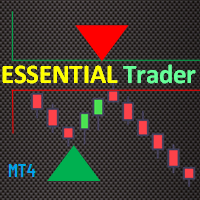
The Essential Trader indicator is more comfortable with whipsaw/ranging market conditions. It is not a complicated trading indicator and can be used on any timeframe with high level of confidence. Besides, it has notifications and alerts. The dotted essential points show spots where you can make immediate entries and benefit from breakout on either side of the region. On the other hand, the color filled points display reversal regions. These are important in that you can trade along the trend or

This Pure Super Signal indicator is designed for signal trading. This indicator generates trend signals.
It uses many algorithms and indicators to generate this signal. It tries to generate signals from the points with the highest trend potential.
This indicator is a complete trading product. This indicator does not need any additional indicators.
The indicator is never repainted. The point at which the signal is given does not change. When the signal comes the arrows are put back one ca

MT5 Version Kill Zones
Kill Zones allows you to insert up to 3 time zones in the chart. The visual representation of the Kill Zones in the chart together with an alert and notification system helps you to ignore fake trading setups occurring outside the Kill Zones or specific trading sessions. Using Kill Zones in your trading will help you filter higher probability trading setups. You should select time ranges where the market usually reacts with high volatility. Based on EST time zone, followin

This indicator is one of the useful tools for traders who trade on currency pairs and based on the strength of each currency they can make a correct decision or confirmation in the positions. It has been calculated for all the minor currency pairs supported by the broker and displays the values of the major currencies. These currencies are displayed horizontally or vertically according to the trader's config when executing the indicator. One of the trading strategies that can be used is to cho
FREE

MP Relative Bandwidth Filter (RBF) is created to be used to identify your trading zones based on volatility. This easy to use technical indicator attempts to compare between Bandwidth of higher length and ATR of lower length to identify the areas of low and high volatility: Relative Bandwidth = Bandwidth / ATR The Bandwidth is based on Bollinger Band which its length ideally needs to be higher and ATR length needs to be ideally lower. After calculating Relative Bandwidth, the Bollinger Band is
FREE

the Super Smart Candles detection indicator
It detects the major breakout Candles amplified by the volume and Candle body size and shows it in a separate window to give a great indication of market power - if Bears dominates :: you will see big Red lines during the day bigger than green ones - if Bulls dominates :: you will see big Green lines during the day bigger than red ones It works on any time frames indicator inputs * frequency : from 1 t0 4 : : higher value gives more signals - lo

To get access to MT5 version please click here . - This is the exact conversion from TradingView: "Stochastic Momentum Index" By "UCSgears". - This is a popular version of stochastic oscillator on tradingview. - This is a light-load processing and non-repaint indicator. - Buffers are available for the lines on chart. - You can message in private chat for further changes you need. Thanks for downloading
IconTradeSL. Возможность выставлять sl по уровням. В индикаторе установлена возможность показывать историю уровней на графике. Возможность выставлять sl по уровням. Настройки индикатора: ЦВЕТ_BAR - цвет баров по которым ищем SL
ЦВЕТ_Тек_BAR - Purple;//цвет текущего бара
BAR - поиск в последних BAR барах (по умолчанию 200)
show_bar - показывать бары по которым ищем SL

Supply and demand zones are at the heart of supply and demand trading . These zones are areas that show liquidity at a specific price. The supply zone is also called the distribution zone, while the demand zone is called the accumulation zone. Our indicator automatically draw supply and demand zones in Metatrader 5. It give opportunity to understand trading zone and avoiding risk.
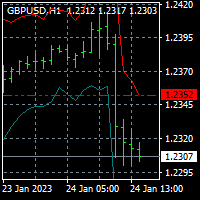
For MT5 version please click here . This is the exact conversion from TradingView: "Average True Range Stop Loss Finder" By "veryfid". - This indicator implements a deviation channel. - The channel determines trend direction as well as stop loss placement. - This is a non-repaint and light processing load indicator. - You can message in private chat for further changes you need.

Versión MT5 Golden Hunter ha sido desarrollado para los traders que operan manualmente en los mercados. Se trata de una herramienta muy poderosa formada por 3 indicadores diferentes: Potente estrategia de entrada: Formada por un indicador que mide la volatilidad del par de divisas e identifica la tendencia del mercado. LSMA: Suaviza los datos de precios y es útil para detectar la tendencia a corto plazo. Heikin Ashi: Una vez se adjunta el indicador al gráfico, las velas japonesas cambiarán a las
FREE
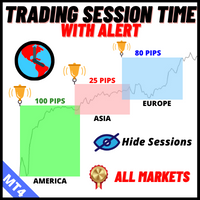
El Indicador de Tiempo de Sesiones de Trading:
El "Indicador de Tiempo de Sesiones de Trading" es una poderosa herramienta de análisis técnico diseñada para mejorar su comprensión de las diferentes sesiones de trading en el mercado de divisas. Este indicador integrado de forma transparente proporciona información crucial sobre los horarios de apertura y cierre de las principales sesiones, incluidas Tokio, Londres y Nueva York. Con el ajuste automático de la zona horaria, atiende a los traders
FREE
El Mercado MetaTrader es la única tienda donde se puede descargar la versión demo de un robot comercial y ponerla a prueba, e incluso optimizarla según los datos históricos.
Lea la descripción y los comentarios de los compradores sobre el producto que le interese, descárguelo directamente al terminal y compruebe cómo testar el robot comercial antes de la compra. Sólo con nosotros podrá hacerse una idea sobre el programa, sin pagar por ello.
Está perdiendo oportunidades comerciales:
- Aplicaciones de trading gratuitas
- 8 000+ señales para copiar
- Noticias económicas para analizar los mercados financieros
Registro
Entrada
Si no tiene cuenta de usuario, regístrese
Para iniciar sesión y usar el sitio web MQL5.com es necesario permitir el uso de Сookies.
Por favor, active este ajuste en su navegador, de lo contrario, no podrá iniciar sesión.