Nuevos indicadores técnicos para MetaTrader 4 - 33

This indicator takes input from the RSI and a trend filter, and presents the output in a separate indicator window as a histogram. Great for scalping. Settings: No need to set up the indicator. Features Alerts. How to use: Simply attach to any chart Zoom chart in to get a better view of the histo color. Buy: Blue histo color on multiple timeframes. (e.g,. M30-H1-H4) Sell: Red histo color across on multiple timeframes.
Or backtest and use as you see fit for your strategy. Best results on Majo

This indicator takes input from the RSI and a trend filter, and presents the output in a separate indicator window as a histogram. Great for scalping. Settings: TrendPeriod RSIPeriod Features Alerts. How to use: Simply attach to any chart Zoom chart in to get a better view of the histo color. Buy: Blue histo color on multiple timeframes. (e.g,. M30-H1-H4) Sell: Red histo color across on multiple timeframes.
Or backtest and use as you see fit for your strategy. Best results on Major Pairs, bu
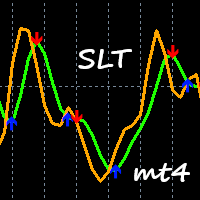
This indicator takes input from a trend filter and 2 oscillators, and presents the output in a separate indicator window as 2 lines and arrows. Great for scalping. Settings: No need to set up the indicator. Features Alerts. How to use: Simply attach to any chart Zoom chart in to get a better view of the lines. Buy: Blue arrow. Best results when entering buys above the 0.00 level, and confirming on higher timeframes too. Sell: Red arrow. Best results when entering sells below the 0.00 level, a

Support and resistance are the basic and widely used trading strategies in the financial trading world. The Support and Resistance indicator for MetaTrader is the best technical tool for identifying potential areas of a support or resistance zone. The indicator is a multi-timeframe indicator that automatically scans through different timeframes for support&resistance zones. It displays lines of the support&resistance zones of a specified period in all the time frames. This implies that the indi
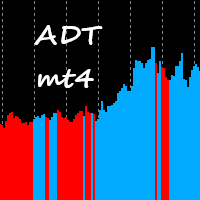
This indicator takes input from Accumulation/Distribution and a trend filter, and presents the output in a separate indicator window as a histogram. Great for scalping. Settings: TrendPeriod Features Alerts. How to use: Simply attach to any chart with default setting, or set the TrendPeriod to your preference. Zoom chart in to get a better view of the histo color. Buy: Blue histo color on multiple timeframes. (e.g., M30-H1-H4-D) Sell: Red histo color on multiple timeframes.
Or backtest and u

System 17 with ATR Strategy is a trend-Momentum system filtered by volatility. Averange true range is the indicator of volatility that I use as filter. Best time frame for this trading system is 30 min. Currency pairs: EUR/USD, USD/CAD, USD/JPY, AUD/USD, GBP/USD, GBP/JPY, NZD/USD, EUR/JPY. Metarader Indicators: System 17 (trend following indicator with arrow buy and sell), this indicator is formed by moving average 12 period, close, Bollinger Bands period 8, deviation 0.75, Moving average 21

You have made a great decision to try this powerful indicator. The FX Turbo is a supreme forex trading indicator that will help you achieve your financial goals on currency market. In this post you will learn how to use and trade with FX Turbo Marksman indicator. Recommended Timeframe
This indicator was optimized for 1-hour timeframe but you can successfully use it on any timeframe as well. Generally speaking higher timeframes are for swing trading and and lower timeframes are for scalping.

One of the most popular methods in technical analysis used by both institutional and retail traders is determining the resistance and support levels using the so-called Pivot Point, which in turn is the starting point when defining market sentiment as bullish or bearish. Resistance and support levels are distinguished for their ability to limit the appreciation/depreciation of a certain asset. The most-commonly used technical tools for determining resistance/support levels include: prior tops/bo

Candlestick patterns have little value without the right price action context. If you’ve been studying candlestick formations, you must have heard this principle many times over. You cannot trade patterns in a vacuum. But what do we mean by context ? It is an overall technical assessment that encompasses: The market’s trend Support and resistance structure Recent price formations Volatility It seems intimidating at first, but a simple trading indicator can help us out here - the moving a

Индикатор виртуального эквити, представляемый здесь, может работать по нескольким
символам одновременно. Для каждого символа задается направление ( Buy/Sell ) и размер позиции.
В настройках также указывается размер предполагаемого депозита, дата открытия и закрытия
позиции.
На графике при этом устанавливаются вертикальные линии, обозначающие указываемые в настройках даты.
После установки индикатора на график, можно изменять время открытия и закрытия позиции,
передвигая эти линии.
Да
Binary Trader Master es un indicador basado en flechas que predice el cierre de la vela. Hace su análisis dentro de una sola vela. Cuando la vela se abre, requiere unos momentos para hacer el análisis y predecir el cierre de la vela. Entonces genera una señal. El indicador también le permite aplicar límites de tiempo que puede usar para el análisis, lo que significa que en realidad puede decirle al indicador cuánto tiempo puede tener para el análisis dentro de la vela. El indicador monitorea pat

Indicador multidivisa y multitemporal Inside Bar (IB). En los parámetros, puede especificar las monedas y plazos que desee. El panel muestra el último patrón de barra interior (y barra madre) encontrado, la posición actual del precio y la ruptura de los niveles de las barras madre e interior. Puede establecer el tamaño y el color de las barras y el texto de las celdas. El indicador también puede enviar notificaciones cuando se superan los niveles. Al hacer clic en una celda con un punto, se abr

Si a menudo pierde operaciones porque solo usa un indicador, pruebe esta herramienta comercial. Esta herramienta comercial utiliza más de un indicador. A menudo observo a traders que sólo utilizan el indicador RSI. Muy a menudo el mercado está sobrevendido pero todavía está abajo o el mercado está sobrecomprado pero todavía está arriba. Por este motivo, es necesario utilizar más de un indicador. Presentamos la nueva versión V 3.40 MTF PPAAF: Flecha de acción de precio precisa de múltiples marco

(traducción de Google) Este indicador implementa el " Promedio Verdadero Rango (ATR) " desarrollado por John Welles Wilder Jr. , como se describe en su libro: Nuevos conceptos en sistemas técnicos de comercio [1978] . Utiliza el promedio móvil de Wilder , también conocido como promedio móvil suavizado (SMMA) , en lugar de un promedio móvil simple (SMA) como se usa en el indicador ATR incorporado de MetaTrader . El período predeterminado aplicado es 7, en lugar de 14, según la descripción en su l
FREE

Advanced trend is a most powerful indicator which provides signal based on trend moving. There is a 2 Signal mode. One Provide Early Signal and Another Provide Permanent. You guys use default settings without any changes.
There is a option called candle shift. And default setting is 1 which provides early signal and might be repaint but if you change the value and use 2 then it will gives you permanent. You guys go play around with this. Except that there is nothing you guys worry about.
On
FREE

"BUYUK SAVDOGAR" TM has developed this strategy to support all who trade binary options.
This trading system determines the state of imbalance in the market based on volume analysis. The most convenient point for opening a trade is an imbalance situation. The trading system independently allocates an imbalance zone. Issues a warning (alert) in the desired direction.
The terms of trade are very simple. We are waiting for directions. We open a deal on the current timeframe in the direction.

Signal trend indicator for scalping. Has three different sensitivity options
It detects a trend change and gives signals to open positions.
Has built-in audio and visual trend change alerts. Can send notifications to your phone or email. Allows you to open positions in a timely manner in accordance with the direction of the market. Works on all timeframes, on all currency pairs, metals, indices and cryptocurrencies. Can be used when working with binary options. Distinctive features Does no

Sniper Zones are our best kept secret for trading the forex markets profitably and extremely simple ! After years of profitable trading we are launching it to the public !
After thousands of hours of testing, we have developed an indicator that simplifies trading to the point where anyone can become a profitable trader. There exists certain zones and areas in the market that are used by institutions to move price and cause retail traders to lose their money ! We have done the hard work and mad

Valentines trend is an easy-to-use indicator that hides a powerful calculation math-system "under the hood". Attach the indicator to the chart and set the parameters. Period - period for tracking changes in quotes Amount of Bars - number of last bars to track You do not need to select any numerical parameters. The indicator will do everything for you automatically . Each signal is generated on the current bar, and in order not to miss it, use the built-in alerts and notifications system . The in

Sharp Transition is a new product that allows you to identify the current market phase (uptrend, downtrend or flat). Represents a typical investor strategy that usually indicates a trend change from bearish to bullish. A tool that allows you to determine the direction and strength of a trend. Unlike most indicators, Sharp Transition finds longer trends and gives fewer false signals.
This indicator displays arrows of different colors depending on the current state of the market and thus signal
If you do not have your own trading strategy yet, you can use our ready-made trading strategy in the form of this indicator. The Your Trends indicator tracks the market trend, ignoring sharp market fluctuations and noise around the average price.
The indicator is based on price divergence. Also, only moving averages and a special algorithm are used for work. It will help in finding entry points in the analysis and shows favorable moments for entering the market with arrows. Can be used as a f
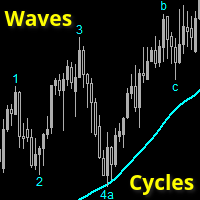
Wave and Cycle counter to give an immediate indication how far the ongoing trend has progressed.
Low numbers: trend has just started, ride the trend. Higher numbers: trend is 'older', watch for reversals
This indicator is 100% compatible with the fantastic TopDog trading strategy.
(I will NOT give any details about this Top Dog strategy)
The trend direction is determined by a SMA value (or any other MA) you can set.
Waves and cycles numbers and letters are derived from a SlowStoch setting

The indicator shows your positions and orders on the chart, with the take profit and stop loss converted into order currency. You can see at a glance how big the profit or loss of your trades would be if the take profit or stop loss were reached. Metatrader displays these values when you move the mouse over the StopLoss or TakeProfit line. With the indicator you can see the numbers in large friendly digits at a glance.
Instead of using orders, the indicator can also calculate this for lines,
FREE

Key Level Key Level is a MetaTrader 4 Indicator that uses a proprietary algorithm based on Price Retracement/Breakout Method to show the Entry-Line on your trading.
Instead, it analyzes data of market and identify entry points and opportunities. (Price Retracement / Price Breakout)
It's also a trading tool that be used to practice and enhance your manual trading skills.
Key Level is an amazing tool for Scalping Trader. It also a trading tool that be used to practice and enhance your manual t
FREE

OB Breakout is alert indicator that identifies when a trend or price move is approaching exhaustion(Supply and Demand) and ready to reverse. It alerts you to changes in market movement which typically occur when a reversal or major pullbacks are about to or have happened. The indicator identifies breakouts and price momentum initially, every time a new high or low is formed near a possible Supply or Demand level point. The indicator draws in a rectangle on Supply or Demand Zones. Once price we

Super Magic Signal indicator is designed for signal trading. This indicator generates trend signals.
It uses many algorithms and indicators to generate this signal. It tries to generate a signal from the points with the highest trend potential.
This indicator is a complete trading product. This indicator does not need any additional indicators.
The indicator certainly does not repaint. The point at which the signal is given does not change.
Features and Suggestions Time Frame:

** All Symbols x All Time frames scan just by pressing scanner button ** *** Contact me after the purchase to send you instructions and add you in "Order Block group" for sharing or seeing experiences with other users. Introduction: The central banks and financial institutions mainly drive the market, Order block is considered a market behavior that indicates accumulation of orders from banks and institutions, then the market tends to make a sharp move(Imbalance) on either side once the order bl

To get access to MT5 version please click here . - This is the exact conversion from TradingView: "Twin Range Filter" by " colinmck ". - This is a light-load processing and non-repaint indicator. - All input options are available. - Buffers are available for processing in EAs. - You can message in private chat for further changes you need. Thanks for downloading

Key Level Key Level is a MetaTrader 4 Indicator that uses a proprietary algorithm based on Price Retracement/Breakout Method to show the Entry-Line on your trading.
Instead, it analyzes data of market and identify entry points and opportunities. (Price Retracement / Price Breakout)
It's also a trading tool that be used to practice and enhance your manual trading skills.
Key Level is an amazing tool for Scalping Trader. It also a trading tool that be used to practice and enhance your manual t

Momentum Breakout Finder (MoBlast) is an indicator based on Volume to find the when the current pair is making breakout and when market are range bound. Oscillators Indicators like RSI, MACD that works fine for an interval of the market, it fails to generate profitable signals when the market conditions change, and hence it produces wrong signals resulting in big losses. This indicator implements an volume logic algorithm that finds the best breakout of the symbol. When an arrow signal appears
Современный индикатор паттерна Ключевой разворот. Имеет настройки таймфрейма. Можно настроить количество баров для отображения индикатора на графике. Индикатор предпочтительно использовать на часовом таймфрейме и выше, но работает и ниже. Подходит для использования с любой стратегией. Условие отображения: какой таймфрейм указали в настройках, галочку во вкладке отображение ставим там же. Для фильтра можно использовать скользящую среднюю.

Современный индикатор паттернов PinBar по торговой стратегии RAIT. Работает по тренду и без него. Имеет настройки таймфрейма для отображения. Можно настроить количество баров для отображения индикатора на графике. Используется несколько паттернов PinBar. Индикатор предпочтительно использовать на часовом таймфрейме и выше, но работает и ниже . Паттерны: PinBar, InsPinBar, PinInside. Отображаются одной стрелкой.

This Harmony Cross Signal indicator is designed for signal trading. This indicator generates trend signals.
It uses many algorithms and indicators to generate this signal. It tries to generate a signal from the points with the highest trend potential.
This indicator is a complete trading product. This indicator does not need any additional indicators.
The indicator certainly does not repaint. The point at which the signal is given does not change.
Features and Suggestions T

The RSI and Moving Average Indicator is a powerful tool for any trader looking to take their technical analysis to the next level. With the RSI as the main indicator, you will have access to a clear and accurate representation of the strength of the current market trend. The addition of the moving average line adds another level of insight, providing a smoothed view of the RSI that helps to identify longer-term trends and potential buying or selling opportunities. Whether you are a day trader, s

This is a tool to measure the velocity of the price. It's completely free, you can download and use. "Way: distance of price after one tick." "Speed: price velocity after one tick." p/s: The time for the price to jump 1 tick will not be fixed, you should know this. If Way > 0, the indicator will change color to Green If Way < 0, the indicator will change color to Red || I am a 3D artist and I love math and programming! ||
FREE

ICT, SMC, SMART MONEY CONCEPTS, SMART MONEY, Smart Money Concept, Support and Resistance, Trend Analysis, Price Action, Market Structure, Order Blocks, BOS/CHoCH, Breaker Blocks , Momentum Shift, Supply&Demand Zone/Order Blocks , Strong Imbalance, HH/LL/HL/LH, Fair Value Gap, FVG, Premium & Discount Zones, Fibonacci Retracement, OTE, Buy Side Liquidity, Sell Side Liquidity, BSL/SSL Taken, Equal Highs & Lows, MTF Dashboard, Multiple Time Frame, BigBar, HTF OB, HTF Market Structure,

MT5 version | Indicador Owl Smart Levels | Estrategia Owl Smart Levels | FAQ El Indicador Fractals es uno de los elementos de la estrategia comercial del autor de Bill Williams. Se utiliza para buscar puntos de inversión de precios en el gráfico de precios y, en consecuencia, niveles de soporte y resistencia. El Indicador Full Fractals es un Fractals mejorado que está disponible en el conjunto de herramientas de casi todos los terminales comerciales. Su única diferencia es que para const
FREE
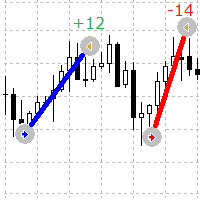
Un indicador simple pero útil para ver visualmente los puntos de entrada y salida de órdenes en el gráfico
Este indicador muestra las órdenes abiertas actuales y las órdenes completadas en el símbolo
Parámetros del indicador
Lines Buy color: especifica el color de las líneas para las órdenes de compra. Lines Sell color : especifica el color de las líneas para las órdenes de venta Lines Width : establece el ancho de línea, funciona para tipos de estilo sólido Lines style : establece el est
FREE

El indicador forex R Ease Of Movement Metatrader 4 es un oscilador comercial EMZ de color azul. Es un indicador de divisas de tipo oscilador que genera un área de negociación alcista y bajista. Los valores por encima del nivel cero se dice que son alcistas, mientras que los valores por debajo del nivel cero se dice que son bajistas.
El oscilador R Ease Of Movement no produce buenos resultados por sí solo, debe negociarse junto con un indicador técnico de seguimiento de tendencia. Los buenos i
FREE

UR PulseScalp Un indicador comercial calibrado para revendedores que buscan la máxima ventaja en mercados acelerados
UR PulseScalp es una solución comercial de vanguardia para revendedores que buscan la máxima ventaja en mercados acelerados. Este indicador innovador se basa en una fórmula calibrada científicamente que combina el poder de la volatilidad, el flujo de dinero y la fuerza relativa para crear una señal altamente precisa y confiable.
Ventajas de usar UR PulseScalp :
Cómodo Pane

Propósito/Objetivo Este es un indicador de promedio móvil de múltiples marcos de tiempo creado a medida específicamente para Intraday/Trend Trader. Informa al comerciante de la tendencia en el marco de tiempo H4, independientemente del marco de tiempo en el gráfico, mientras que el comerciante identifica los niveles de entrada y ejecución en los marcos de tiempo más bajos. Adecuado para Multi-Frame y Trend Trader. Características adicionales Botón de alternar para mantener limpios los objetivos

Una estrategia comercial lista para usar para especular en el período M5 (marco de tiempo M5), en cualquier par de divisas. La estrategia comercial ha sido probada y ha mostrado un buen rendimiento. Todos los comerciantes, incluso los principiantes, pueden hacer scalping con esta estrategia. Para comenzar a operar, debe abrir su Metatrader4 en su PC, descargar el "indicador de señal de especulación" de esta página y agregarlo al gráfico del par de divisas que desea operar. Debe seleccionar el m
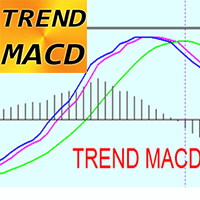
Indicador TREND MACD para MT4: ¡es una herramienta comercial excelente y eficiente!
Este indicador es excelente para los comerciantes de tendencias que se centran en captar grandes movimientos de precios. TREND MACD consta de 3 líneas: Línea verde: muestra la dirección de la tendencia principal y líneas azul y magenta para entrada y salida. El indicador permite maximizar los beneficios, no salir demasiado pronto del comercio rentable El indicador tiene alertas integradas para dispositivos móv

FRB Candle Time
Indicator showing the time left for the next candle You can edit font color and size. Very important indicator for Traders. To move time, just click on it and move the mouse to where you want to leave it. After positioning the time where you want it, click again or press "ESC" and the time will stay where you left it.
Settings font color Font size Background color
FREE

This indicator represents a genuine momentum oscillator according to the true definition of "Momentum", and as realised by the techniques of digital filtering. ( Note : download a complete set of true momentum oscillators here ). A scholarly paper on the subject by the current developer can be found here , but in this description we shall borrow only the minimum of conceptual and mathematical framework needed. In the process, we expose some long-held myths about indicators supposedly measurin
FREE

Contact me after payment to send you the User-Manual PDF File. Harmonic Trading The secret is the Fibonacci. It has been proven in the markets that price always reacts to Fibonacci levels. Fibonacci levels are one of the most important indicators of price changes. Sometimes the sequence of reactions to these levels in the chart make geometric shapes, which are called harmonic patterns. The price creates harmonic patterns with its fluctuation and reaction to Fibonacci levels. Harmonic patterns c

Contact me after payment to send you the User-Manual PDF File. 5W Pattern introduction The 5W pattern occurs when the price forms an alternating 5-wave cycle with its volatility. In fact, the 5W pattern is a price series of alternating HH or LL (higher high or lower low), which is the main characteristic of a trend. The pattern of 5W should have the characteristic of non-overlapping waves, also the points of the pattern are usually formed in Fibonacci levels. The completed pattern of 5W actua

FRB Time - FRB Trader
Indicator that shows the server's time of operation. You can edit the font color and size of the timetable.
Settings font color Font size Background color
To move the Timetable, just click on it and move the mouse to where you want to leave it. After placing the Time where you want it, click again or press "ESC" and the time will stay where you left it.
FREE

Candle Timer displays the time remaining until closing the current Bar, and a new bar forms.
Feature simple to use . no lag or delay . customize position, color & font Size . server time not local time.
Inputs
- position * Beside Active Candle ( Default ) * Right Upper * Lift Upper * Right Bottom * Lift Bottom - font size * 14 (Default) - color * SpringGreen (Default)
FREE
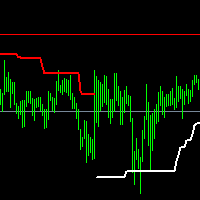
SPT is a trend indicator It is written on the basis of ATR, with clear trend lines indicating the direction in progress, Different traders' understanding of this indicator may form two different purposes Trend-based traders will conduct trend trading when the trend line changes, Respectful shock traders will carry out range trading according to the final support or resistance level marked by this indicator
The index parameters are as follows: Multiplier: multiple of ATR Period: ATR cycle. The

MACD Color for GOLD Use for looking moving-way of graph and checking will be buy or sell Easy for looking by see the color of trand. Red is down / Blue is up. Can to use it with every time-frame by 1. Long Trade : Use it with time-frame H1 / H4 / Daily 2.Short Trade : Use it with time-frame M5 / M15 / M 30 / H1 and you can see when you will open or close the orders by see this indicator by well by see signal line cut with color line again in opposite. and you can use this indicator for

This indicator applies the biquad high pass filter to the price-chart data, and displays the filter output for the OHLC as candlesticks. The candlesticks corresponds to the actual calculations of the filter value during the formation of each price bar (not from all historical highs lows or closes). The shape of the bars therefore corresponds directly to the shape of each price bar. High pass filters are an underappreciated type of oscillator that are seldom used in technical analysis in the st
FREE

AC Pivot Panel:
AC Pivot Panel is a pivot point indicator including favorite selection panel accessible in the chart. For pivot traders, it is well convenient to easily and quickly can adjust their pivots setting in the chart. To reaching this goal, a panel has been considered to user can easily switch to each pivot levels by different method and time period. In the current version: All pivots including supports and resistance can be selected to display or disappear in the chart just by
FREE

The True Hero Oscillator indicator is designed for signal trading. This indicator generates trend signals.
It uses many algorithms and indicators to generate this signal. It tries to generate signals from the points with the highest trend potential.
This indicator is a complete trading product. This indicator does not need any additional indicators. This product uses 3 main indicators and many algorithms.
The indicator is never repainted. The point at which the signal is given does no

This indicator resolves an unrecognised defect in the Commodity Channel Index Oscillator (CCI). The CCI is based on a high pass filter calculated by subtracting the p-period simple moving average of a price signal (usually typical value) from the price signal itself. Then, the result is divided by the absolute mean deviation of the same period. The frequency response of a signal minus its simple moving average is shown in the first screen shot (in Blue). (see my free indicator : Q n D Frequency
FREE

Latest Changes in 1.6 : Added Signal Modes input. Mode 1 : HPF positive go long blue, HPF negative go short red. Mode 2 : slow envelope only, HPF above upper envelope go long blue, HPF below lower envelope go short red. Mode 3 : HPF above both upper envelopes - go long blue, HPF below both lower envelopes go short red. Mode 4 : Go long blue if HPF crosses above upper slow, but fast upper should be below slow upper at the time, exit when HPF crosses below upper fast, reverse logic for short re
FREE
This is a breakout Indicator for MT4 where you can open trades after a breakout has occurred. This indicator will draw blue boxes on the chart. You simply have to follow price until it breaks out of the box and make sure that the candle had closed above the breakout if its a buy trade and the candle must close below if its a sell trade. An alert will now pop up with suggested price entry and TP of 15 pips default. You can change TP Pis depending on your choice The indicator can trade almost any
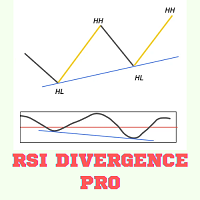
RSI DIVERENCE INDICATOR
RSI divergence is very powerful pattern which is often used to detect a strong trend reversal. it also indicates the weakening of strong signal. So some traders want to use it as the exit criteria. This indicator works in all timeframe and send notification, alert or email to the user. It also show the Higher Highs and Lower Low Pattern with its corresponding RSI divergency. This indicator can be used in Expert Advisors as it has accessible buffers List of Inputs _____
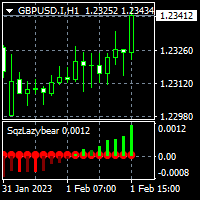
For MT5 version please click here . - This is the exact conversion from TradingView source: "Squeeze Momentum Indicator" By "LazyBear". - This is a non-repaint and light processing load indicator. - Buffers and inputs are available for use in EAs and optimization purposes. - You can message in private chat for further changes you need.
Thanks for downloading...

UR Vortex
The Probabilistic UR Vortex Formula: An Accurate System for Predictive Market Analysis using Volatility and Standard Deviation Calculations. The UR Vortex indicator is a technical analysis tool that uses volatility and standard deviation calculations to predict potential tops and bottoms in a market. It measures the strength of a trend by calculating the distance between the current price and a moving average, and then standardizing this distance by dividing it by the average true

MACD (short for M oving A verage C onvergence/ D ivergence) is a popular trading indicator used in technical analysis of securities prices. It is designed to identify changes in the strength, direction, momentum, and duration of a trend in a security's price.
History Gerald Appel created the MACD line in the late 1970s. Thomas Aspray added the histogram feature to Appel's MACD in 1986.
The three major components and their formula 1. The MACD line: First, "PM Colored MACD" employs two Movin

Previous Period High Low . This indicator shows the previous Day, Week, Month and Years High and Low. It's great for price action strategies. : Provides clear and visible breaks in structure. : Easy to see breakout levels. : Easy to see gaps between previous high, low levels after breakouts have occurred. The indicator works on every time frame. Multiple periods can be selected and be seen on the same chart. Every line can be customized to Your liking. Color, style and thickness. Enjoy!
RumahForexID Momentum Scalping Indicator is the best momentum indicator ever created, and why is that? The indicator works on all timeframes and assets, the indicator is made after 6 years of experience in forex. You know many momentum indicators on the internet are unhelpful, and difficult to trade, but RumahForexID Momentum Scalping Indicator is different , The indicator shows wave momentum, when the market is about to trend or consolidate, all that in one simple and clear indicator!
RumahF

Este indicador es una super combinación de nuestros 2 productos Advanced Currency IMPULSE with ALERT + Currency Strength Exotics .
¡Funciona para todos los marcos de tiempo y muestra gráficamente el impulso de fuerza o debilidad para las 8 divisas principales más un Símbolo!
Este Indicador está especializado en mostrar la aceleración de la fuerza de la divisa para cualquier símbolo como Oro, Pares Exóticos, Materias Primas, Índices o Futuros. Es el primero de su clase, cualquier símbol

Este indicador utiliza múltiples indicadores para generar operaciones de señales ganadoras El indicador R Signals es un completo sistema de negociación de divisas que imprime flechas precisas de compra y venta en el gráfico.
El indicador aparece en la ventana principal del gráfico MT4 como flechas de color verde y rojo.
El uso de señales generadas por un solo indicador puede ser riesgoso al operar. Esto se debe a que usar solo un indicador para operar puede dar más señales falsas. Por lo ta

Versión MT5 | Indicador Trend Monitor VZ | Indicador Owl Smart Levels | Estrategia Owl Smart Levels | FAQ La teoría de ondas de Elliott es una interpretación de los procesos en los mercados financieros que se basa en un modelo Visual de ondas en gráficos de precios. El indicador Valable ZigZag muestra la estructura de onda del mercado en la que se puede confiar para tomar decisiones comerciales. El indicador Valable ZigZag es más estable y no cambia a menudo su dirección como el i
FREE

Se encuentra disponible un indicador CCI preciso.
Dashboard Trend Bar Smart Level 9TF Doble CCI. Doble CCI, es decir, CCI rápido y CCI lento ¿Por qué necesita un segundo CCI? El uso de indicadores adicionales nos convencerá más en el comercio en vivo Curva CCI rápida 9TF 9TF Curva CCI lenta Ángulo CCI en tiempo real 9TF 9TF valor CCI en tiempo real 9TF dirección/fase CCI en tiempo real Barra de tendencia 9TF Nuevo algoritmo en el cálculo de la barra de tendencia. Boton de encendido / apagado.

Un indicador RSI preciso está disponible.
Dashboard Trend Bar Smart Level 9TF Doble RSI. Doble RSI, es decir, RSI rápido y RSI lento ¿Por qué necesitas un segundo RSI? El uso de indicadores adicionales nos convencerá más en el comercio en vivo Curva RSI rápida 9TF 9TF Curva RSI lenta Ángulo RSI en tiempo real 9TF Valor RSI en tiempo real 9TF 9TF RSI en tiempo real dirección/fase Barra de tendencia 9TF Nuevo algoritmo en el cálculo de la barra de tendencia. Boton de encendido / apagado. Muy út

Un indicador MACD preciso está disponible.
Dashboard Trend Bar Smart Level 9TF Doble MACD. MACD dual, es decir, rápido (MACD 1) y lento (MACD 2) ¿Por qué necesitas un segundo MACD? El uso de indicadores adicionales nos convencerá más en el comercio en vivo Curva 9TF Fast MACD 1 9TF Curva MACD 2 lenta Ángulo MACD en tiempo real 9TF Valor MACD en tiempo real 9TF Dirección MACD en tiempo real 9TFSe encuentra disponible un indicador MACD preciso.
Dashboard Trend Bar Smart Level 9TF Doble MACD.

Un indicador estocástico preciso está disponible.
Dashboard Trend Bar Smart Level 9TF Dual Stochastic. Estocástico dual, es decir, estocástico rápido y estocástico lento ¿Por qué necesitas un segundo estocástico? El uso de indicadores adicionales nos convencerá más en el comercio en vivo Curva estocástica rápida 9TF Curva estocástica lenta 9TF Ángulo estocástico en tiempo real 9TF 9TF valor estocástico en tiempo real 9TF dirección/fase estocástica en tiempo real Barra de tendencia 9TF Nuevo a
El Mercado MetaTrader es la única tienda donde se puede descargar la versión demo de un robot comercial y ponerla a prueba, e incluso optimizarla según los datos históricos.
Lea la descripción y los comentarios de los compradores sobre el producto que le interese, descárguelo directamente al terminal y compruebe cómo testar el robot comercial antes de la compra. Sólo con nosotros podrá hacerse una idea sobre el programa, sin pagar por ello.
Está perdiendo oportunidades comerciales:
- Aplicaciones de trading gratuitas
- 8 000+ señales para copiar
- Noticias económicas para analizar los mercados financieros
Registro
Entrada
Si no tiene cuenta de usuario, regístrese
Para iniciar sesión y usar el sitio web MQL5.com es necesario permitir el uso de Сookies.
Por favor, active este ajuste en su navegador, de lo contrario, no podrá iniciar sesión.