Nuevos indicadores técnicos para MetaTrader 4 - 43

Una de las secuencias numéricas se llama "Secuencia de incendios forestales". Ha sido reconocida como una de las secuencias nuevas más bellas. Su característica principal es que esta secuencia evita tendencias lineales, incluso las más cortas. Es esta propiedad la que formó la base de este indicador. Al analizar una serie de tiempo financiera, este indicador intenta rechazar todas las opciones de tendencia posibles. Y solo si falla, entonces reconoce la presencia de una tendencia y da la señal
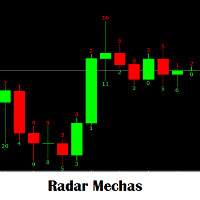
Indicador que sirve mirar el tamaño de la mecha que deja las velas segun el tamaño te genere alerta para hacer entradas manuales. Aprovechenlo al maximo que una plantea estrategia a vaces del tamaño de la mecha de la vela anterior o de la misma vela actual. para entran a comprar y vender. Es un indicador que es necesario para cualquier analisis que se tome para una entrada nueva. Sera su herramienta preferida.
FREE

UR FrontEndBackEnd
UR FrontEndBackEnd es mi fórmula favorita para encontrar los niveles más precisos de soporte y resistencia. También los he dividido en diferentes categorías (líneas discontinuas, líneas continuas y áreas) para marcar qué tan fuertes son. Todo se almacena en búferes, por lo que es fácil acceder a ellos e implementarlos dentro de otras herramientas.
Adición: es posible que la herramienta deba ajustarse al activo en el que se aplica: los activos difieren en términos de núm
Tron Scalper - un nuevo indicador de autor diseñado para scalping.
El indicador da señales basadas en las lecturas de todo un conjunto de herramientas estándar y de autor.
Características principales De tron Scalper: Funciones analíticas
Se puede utilizar en cualquier par de divisas y Marcos de tiempo; El indicador no se vuelve a dibujar; Excelente complemento a otros indicadores; Características gráficas
Ocupa la cantidad mínima de espacio en el gráfico; Tinturas flexibles; Fácil d

This indicator colors candles in accordance with the projected price movement. The analysis is based on the values of the classic ADX. If the DMI+ line is above the DMI- line and the main ADX line grows - the candlestick is painted in color that signals a price growth; If the DMI+ line is below the DMI- line and the main ADX line grows - the candlestick is painted in color that signals a price fall. The indicator does not redraw on completed candlesticks. The forming candlestick can change its c
FREE
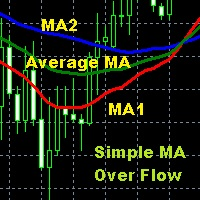
Moving Average is one of the indicators that is widely used in technical analysis which can help to smooth price movements by eliminating some price fluctuations that are less relevant based on past price calculations, so that an average line of price movements is formed within a certain time period. Simple Moving Average Over Flow is an indicator writen by MQL$ language that is given a special additional moving average line based on certain calculations so as to make this moving average better
FREE

Order Squeeze Easy to use indicator to predict the market movement with calculated HIGH important levels. These levels are calculated in the lowest time frame with candle details. Ind calculates the quantity of market tick, volume per tick, and orders per candle. So with this statistical data, you catch the important price levels that supply and demand in the market are attractive for sellers and buyers. Institutes and banks trade with huge order lots and they need a lot of sellers for their
Volume Oscilator is a popular indicator available in trading view which is very popular among traders Definition The Volume Oscillator is an indicator made up of two Moving Averages (MA) surrounding volume, one being fast and the other slow. The slow volume MA value is then subtracted from the value of the fastlow Moving Average. The Volume Oscillator measures volume by analyzing the relationship between the two Moving Averages mentioned. When combined with other indicators it provides a very st
FREE
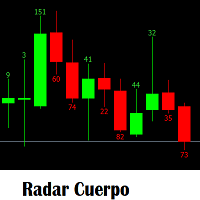
Indicador que sirve mirar el tamaño de velas segun el tamaño te genere alerta para hacer entradas manuales. Aprovechenlo al maximo que una plantea estrategia a vaces del tamñao de la vela anterior o de la misma vela actual. para entran a comprar y vender. Es un indicador que es necesario para cualquier analisis que se tome para una entrada nueva. Sera su herramienta preferida.
FREE
Golden Scalping & Day Trading Signal Indicator You Can Enable Or Disable Scalping Signal Option Once Enable For Scalping More Order Signals Option Or Disable For Scalping Option Intraday Signal Option Pairs : XAUUSD, XAGUSD - EURUSD, GBPUSD,USDJPY, AUDUSD, USDCAD, BTCUSD , USDCHF, GBPJPY Time Frame : 15 Mins, 30 Mins , 1 Hour 5 Purchases left & The Price Increases
Gold Scalping Pro Signal Indicator Pairs : XAUUSD, XAGUSD, Crude OIL , BTCUSD, ETHUSD, EURUSD, GBPUSD, USDJPY, AUDUSD, USDCHF, GBPJPY Setting : Once Market Are Up And Down Side , The Indicator Are Provide Buy And Sell Order Push Notification Time Frame - 5 Mins, 15 Mins, 1 Hour, 4 Hour Additional : You Have Also Trade Manual , Once Trend Power Is Up , Enter Buy Or Trend Power is Down, Enter Sell

Note: The PRICE IS SUBJECT TO INCREASE AT ANY TIME FROM NOW!! DON'T MISS THIS BEST OFFER.
Dear traders once again I am very glad to introduce to you my another trading tool called "Trend Hunter Indicator". This indicator is designed to help traders capture the trend from the beginning or the end of it. It is one of the indicator that if used wisely may help you improve in your trading decisions.
Timeframe
The indicator is for all timeframes
Pairs
The Indicator is for all pairs.
Mar

HEIKEN PLUS is the only indicator you really need to be a successful trader , without in depth knowledge of the forex trading or any tools. Also there is automatically trading MT5 EA available now: https://www.mql5.com/en/market/product/89517? with superb SL/TP management! and sky high profit targets ! MT5 ONLY !
For Metatrader5 version visit: https://www.mql5.com/en/market/product/83761?source=Site
Very suitable tool for new traders or advanced traders too.
HEIKEN+ is a co

DESCRIPTION Investing indicator help you get signal like Technical Analysis Summary of Investing.com When have signal strong ( Strong buy or Strong sell) at Time Frame M5, M15, H1, The Alert will announce to you HOW TO USE When have signal , you can entry Order and set TP & SL appropriately Recommend : This indicator also Technical Analysis Summary of Investing.com is suitable for medium and long term trading

The Cycle Identifier MT4 indicator is a great choice of custom indicator for both short-term and long-term traders. The Cycle Identifier MT4 generates filtered price action signals to assist traders to identify when the conditions are right to open buy and sell positions. How it works The Cycle Identifier MT4 indicator displays on a separate indicator chart below the main chart where it draws an oscillating gray line. This gray line is characterized by upward and downward spikes that are accompa
This indicator is used to show the PERFECT TREND . All Time Frame charts are available. The trend is determined based on the Cycle, Price and Volatility. This Trend Indicator will give 5 output values: Cycle Period: 48 is default
Graph Place: 0 Means Main Windows - 1 means Sub Windows (you can use in your indicator)
NumBars: you can decide how many older Bar use
Short Trend Color : You can decide which color to use for Short Trend
Long Trend Color : You can decide which color to use for Lo
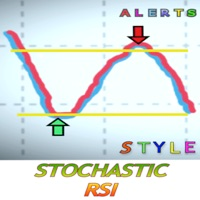
¿Qué es el RSI estocástico?
El RSI estocástico (StochRSI) es un indicador utilizado en el análisis técnico que oscila entre cero y uno (o cero y 100 en algunas plataformas de gráficos) y se crea aplicando la fórmula del oscilador estocástico a un conjunto de valores del índice de fuerza relativa (RSI) en lugar de a los datos estándar del precio. Esta versión incluye alertas para no perder oportunidades realmente buenas. Usted establece el parámetro cuando quiere recibir una señal de compra o
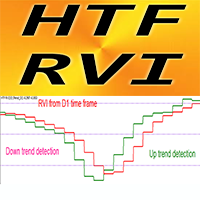
Indicador Forex HTF RVI Oscilador para MT4, sin repintado
Actualice sus métodos comerciales con el oscilador HTF RVI profesional para MT4. HTF significa - Marco de tiempo más alto RVI es uno de los mejores osciladores para la detección de cambios de tendencia y la entrada desde áreas de sobreventa/sobrecompra. Este indicador es excelente para sistemas de comercio de marcos de tiempo múltiples con entradas de acción de precio de áreas de sobreventa/compra. El indicador HTF RVI le permite adjun

Royal Prince Fibonacci , has the most advance Trend detection algorithm built into its Alert system combined with the RoyalPrince Non-repaint Arrows with it's own alert system you will never miss the opportunity of the trade.
2nd picture is how to use Guide on how i use it to Scalp or take long trades.
works on all Charts and all Timeframe on mt4. ︎Best Timeframe M15 for scalping H1 for Day Trading Options: • Fibonacci days High and Lows • Fibonacci Targets • Fibonacci Alert System • Tren
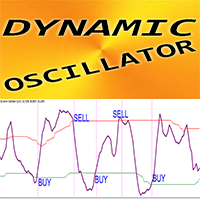
Oscilador dinámico: es un indicador personalizado avanzado: ¡una herramienta comercial eficiente para MT4! Nueva generación de osciladores: vea las imágenes para comprobar cómo usarlos. El oscilador dinámico tiene zonas adaptables de sobreventa/sobrecompra Oscillator es una herramienta auxiliar para encontrar puntos de entrada exactos en áreas de sobreventa/sobrecompra. Valores de sobreventa: por debajo de la línea verde; Valores de sobrecompra: por encima de la línea roja Es mucho más preciso

Shift Trend is a forex trend arrow indicator for identifying potential entry points. Determining the market trend is an important task for traders. The Shift Trend indicator implements an advanced algorithm for visualizing the market trend. Shows the opening points of transactions for sale or purchase, and also indicates the direction of the trend on: short-term and long-term periods. Suitable for trading on low timeframes because it ignores sudden price spikes or corrections in price action by

Support And Resistance Screener is in one level indicator for MetaTrader that provide multiple tools inside one indicator. The available tools are : 1. Market Structure Screener. 2. Bullish Pullback Zone. 3. Bearish Pullback Zone. 4. Daily Pivots Points 5. weekly Pivots Points 6. monthly Pivots Points 7. Strong Support and Resistance based on Harmonic Pattern and volume. 8. Bank Level Zones.
Key Features All in one level indicator.
All types of alerts ( Pop-up alert, puss notification aler

Balance Weighted Moving Hedge System- is the trend following manual system for forex/crypto market. Indicator represents custom balance-weighted moving average indicator. The main advantagies : very stable moving with really early signals, defines current trend power, ignores market noise. The more width of indicator line - the more expressive trend is. On the other hand thin moving line shows unstable / choppy market. Indicator can be used as single b alance weighted moving or with hedge strate

The presented indicator uses the Laguerre filter to build an oscillator. The indicator has the possibility of double additional smoothing, which can be useful for small values of the Gamma parameter. The indicator gives three types of signals: Exit of the oscillator from the overbought / oversold zone; The oscillator crossing the middle of the value between the overbought/oversold zones; The oscillator enters the overbought/oversold zone. On fully formed candles, the indicator does not redraw.
FREE

BSA indicator is a ZigZag based indicator. This indicator is used to find the reversal level of the price. You can use the existing risk ratio and calculation timeframe in the entries by optimizing them according to your usage preference. In lower time frames, the indicator can repaint. For healthier results, you can detect the least repainting by observing for a while according to the graphic you will apply.
Simple Dark Holder Tool
Arrow indicator for Forex and binary options
Already tuned for the best signals
Multicurrency and multitimeframe
Works on all currency pairs as well as raw materials, etc.
Works on the author's strategy and combines 3 indicators that show good results
Does not draw or redraw
The signal appears clearly at the opening of the candle
blue up
Red down
Alert is also built into it for your convenience.
Test and watch a video on how it works

My indicator is a great helper in the forex market. It shows possible market reversals with absolute accuracy. My indicator does not redraw and does not change values when switching timeframes. It works perfectly on all timeframes and can become a key indicator in your strategy. I would like to note that flexible indicator settings allow you to adapt the indicator to your strategy and can make a big contribution to your profitable strategy, although everything is already laid down in this indica
Cheap Rate limited COPIES HURRY UP! 5 LEFT COPIES Very precise patterns to detect High Accurate Order Blocks: It Draw zone after market Structure Breakout with a high Accuracy, institutional orders with the potential to change the price’s direction and keep moving towards it, have been placed. Features Auto Order Blocks Draw MTF Order Blocks Double Signal One Alert Signal Second Long Wick Rejection Signal Market Structure BOS LINE This Indicator is limited features if you want full Feature
ADX Pro Indicator This Indicator Are Advanced Pro ADX Indicator Multi Time Frame Are Same Window Multi Currency Are Same Windows All Time Frame And All Currency ADX Strenght Are Same Window Monitring You Will Add Manully All Currency Pairs , And Metel , And Also Crypto Currency Pairs : EURUSD , GBPUSD, USDJPY .... Etc , Metel : XAUUSD , XAGUSD ... Etc , Crypto : BTCUSD, ETHUSD... Etc
Hello; The product offers high quality trend tracking. Thanks to the arrows on the graph, you can easily follow the entry and exit signals. It provides ease of use thanks to a single input parameter. You can easily follow the signals thanks to the alarm options. Moreover, trend color lines provide convenience in determining the trend direction. Input parameter setting: Periodic: Indicates the number of bars that need to be calculated.
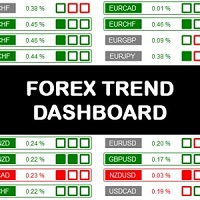
The Forex Trend Dashboard is a truly exceptional tool for analyzing and operating the choice of which exchange to try to trade. The analysis of currency baskets allows you to better understand the real situation of the market and better evaluate your own operational ideas. The dashboard analyzes the trend over different time horizons such as: daily, weekly and monthly. The resulting considerations are very simple, the session opening price and its strength condition are analyzed by recognizing t
Introduction and Description The commodity channel index (CCI) is an oscillator originally introduced by Donald Lambert in 1980. Since its introduction, the indicator has grown in popularity and is now a very common tool for traders in identifying cyclical trends not only in commodities but also equities and currencies. The CCI can be adjusted to the timeframe of the market traded on by changing the averaging period. CCI indicator with different colors at levels 0, 100 and -100. The cross is a
FREE

This tool provides a freehand drawing method, to treat the chart space as a blackboard and draw by-hand. Drawings can be made to stick to the CHART (moves with chart scroll), or to stick to the WINDOW (does not move with chart scroll).
Features: all drawings are individually styled, color, width
show/hide each drawing type
delete last drawing drawings, on chart and on window, remain through TF changes and terminal re-starts, until the indicator is removed
Panel: stylable colors scalable in
Master Trend Signal Indicator
TimeFrame - 15 Mins & More
Pairs - All Forex Currency Pairs , Gold , Silver , Crypto, Stock
Once Trend Is UP Cross The Yellow Line, It's Show Colour For Green
Once Trend Is Down Cross The Yellow Line, It's Show Colour For Red Easy TO Identify Trend Strength ON Trading For Scalping, Intraday Trading 5 Purchases left & The Price Increases

В основе индикатора EasyBands лежит тот же принцип, что и при построении Bollinger Band. Однако, данная модификация индикатора использует вместо стандартного отклонения средний торговый диапазон (Average True Range). Соответственно, с данным индикатором абсолютно аналогично можно использовать все стратегии, которые применяются с Bollinger Band. В данной версии индикатора используется двенадцать уровней и средняя линия (белый цвет). Индикация тренда выполнена в виде окраски свечей в зависимости
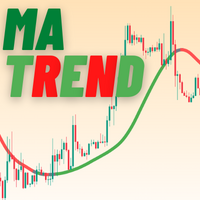
MATrend indicator makes the directional trend of the current market easily recognizable. Settings: MA Period : The amount of candles taken into consideration for the calculation of the moving average; MA Method : The method used for the calculation of the moving average. Selectable methods are: Simple averaging;
Exponential averaging;
Smoothed averaging;
Linear-weighed averaging; Usage: The color of the indcator will change based on the slope of the MA. Green : The indicator has a bullish
FREE

Welcome to Upside Down !
Upside Down is a powerful indicator that gives the perfect trading opportunities and a clear indication of the market. Upside Down has been created to be as simple as possible. Arrows are calculated based on ASC Trend and customs indicators . Signals appear without delay at the end of a candle, if it has tested the level. The signals do not overdraw.
THE BENEFIT:
Easily to enter in buy position/sell position Intuitive directional arrows by co
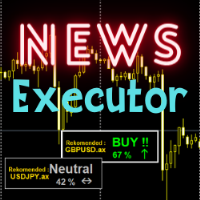
Several indicators are summarized in one display conclusion. Highly recommended indicator for all traders even beginners. You only need to make transactions according to the recommendations displayed by the indicator. It's obvious for trading news with big effects though. Trading is all about money, so love your money and make a profit with our tools. Trading recommendations on news on major currencies

Gold Buster M1 System es un sistema de negociación profesional para gráficos M1 en el par XAUUSD. Pero, a pesar de que el sistema se desarrolló originalmente exclusivamente para operar con oro, el sistema también se puede utilizar con otros pares de divisas. Después de la compra, le daré una lista de pares comerciales que se pueden usar con el sistema además de XAUUSD, lo que ampliará sus posibilidades para usar este sistema. ¡TODOS LOS INDICADORES DEL SISTEMA NO SE REPITE! Este sistema es un co

Gorilla Channel VZ es un indicador de canal modificado sobre la base de años de observaciones.
El indicador de comercio de señales se puede utilizar como un indicador que muestra el canal de tendencia y como una de las Fuentes de señales de entrada, siempre que se filtre adicionalmente. Con el enfoque adecuado, al menos 80% de transacciones exitosas.
Características principales de Gorilla Channel VZ: Funciones analíticas
Se puede utilizar en cualquier par de divisas y Marcos de tiempo; E
FREE

The Cat Trend VZ-un indicador en constante mejora, con señales de entrada precisas y rentables.
La línea del indicador the Cat Trend VZ cambia de color dependiendo de la dirección de la tendencia, y en los puntos de inversión del precio, el indicador dibuja flechas.
Además, el indicador the Cat Trend VZ implementa una alerta de sonido y texto sobre la aparición de una flecha.
IMPORTANTE: EL INDICADOR NO SE VUELVE A DIBUJAR.
Características principales de the Cat Trend VZ: Funci
FREE

Panda Oscillator - un nuevo indicador de autor diseñado para scalping.
El indicador da señales basadas en las lecturas de todo un conjunto de herramientas estándar y de autor.
Características principales de Panda Oscillator: Funciones analíticas
Se puede utilizar en cualquier par de divisas y Marcos de tiempo; El indicador no se vuelve a dibujar; Excelente complemento a otros indicadores; Características gráficas
Ocupa la cantidad mínima de espacio en el gráfico; Tinturas flexibles;
FREE

Night Ghost - Indicador de flecha para opciones binarias.
¡Este es un asistente confiable para usted en el futuro!
- Sin redibujar en el gráfico
-¡Funciona muy bien en todos los pares de divisas!
-Indicador de precisión de hasta el 90% (Especialmente de noche)
-No es necesario configurar durante mucho tiempo (configurar perfectamente para opciones binarias)
- Señales no tardías
- La aparición de una señal en la vela actual.
-Perfecto para el período M1 (¡No más!)
- Color de ve

Este es un indicador de tendencia. El indicador refleja los miles de cambios en los precios del mercado con una línea sólida roja y verde. El cambio de color de la línea sólida indica que el mercado ha cambiado y que es muy probable que haya una reversión! La línea verde indica que el precio de mercado está en un período ascende nte. La línea roja indica que el precio de mercado está en un período descendente.
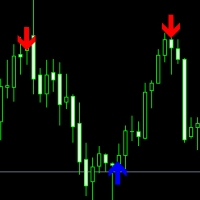
Price Reversal Pro : puntos en los que el precio se invertirá con un 95 % de probabilidad. Esta información ayudará a todos los comerciantes a abrir operaciones de manera efectiva. El indicador en el gráfico dibuja flechas en qué lugar y en qué dirección se invertirá el precio. Debe esperar a que el indicador dibuje una flecha y abrir una orden en la dirección indicada. Esta es la estrategia comercial más simple. El indicador no vuelve a dibujar sus flechas y muestra reversiones de precios para
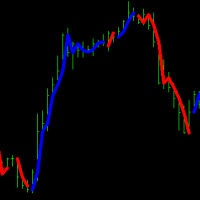
Indicador de tendencia para determinar la dirección de la tendencia. El indicador escanea el mercado en busca de reversiones bruscas de precios y muestra al comerciante dónde comienza una tendencia bajista o alcista. Cuando el mercado se mueve lateralmente, el indicador deja de dibujar líneas de señal. Gracias a este indicador, cada comerciante puede determinar rápidamente la dirección del mercado y abrir las órdenes correctas en la dirección del movimiento del precio. También puede analizar el

Forex Gump Trend es un indicador universal para la determinación altamente efectiva de la dirección de la tendencia. Si identifica la tendencia correctamente, este es el 95% del éxito comercial, ya que podrá abrir operaciones en la dirección del movimiento del precio y beneficiarse de ello. El indicador de tendencia Forex Gump ayuda a los operadores con un alto grado de eficiencia a determinar la dirección de la tendencia actual, así como los puntos de inversión de la tendencia. La dirección de

Polynomial Trend - A tool that allows you to determine the direction and strength of a trend. Unlike most indicators, Polynomial Trend finds longer-term trends and gives fewer false signals. This indicator allows you to find the most likely trend reversal points b allows you to identify the current market phase (uptrend, downtrend).
This indicator displays arrows of different colors depending on the current state of the market and thus signals the user about a change in trend. It is easy to u

What are "pivot points"? Pivot point analysis is often used in conjunction with the calculation of support and resistance levels, as is the case with trend line analysis. Pivot point analysis calculates the first support and resistance levels using the trading range width between the pivot point and the previous day's high or low price. The second support and resistance levels are calculated using the entire width between the previous day's high and low prices.
Looking for a quality pivot poi

Introduction to Chart Pattern MT Chart Pattern MT is a chart pattern scanner to detect the triangle pattern, falling wedge pattern, rising wedge pattern, channel pattern and so on. Chart Pattern MT uses highly sophisticated chart pattern detection algorithm. However, we have designed it in the easy to use with intuitive user interface. Chart Pattern MT will show all the patterns in your chart in the most efficient format for your trading. You do not have to do tedious manual pattern detection an

DESCRIPTION
The CHAOS INDICATOR has been developed to be used for the TRADING STRATEGY OF CHAOS, as described in the book. The book is in italian language only and can be obtained only on my website indicated below.
DATAS COLLECTED AND SHOWN ON GRAPHS
The CHAOS INDICATOR apply easily to any graph and any asset, and it is a TRADING FACILITATOR, as it identify immediately the following items on any graph: - The GP (= RIGHT PRICE) i.e. the price to which the asset should be attracted within 24
CONGESTION BREAKOUT INDICATOR: When you see a sideways price movement in a meaningless market, what goes through your mind? Is it a danger, an opportunity or completely a vacuum? Let's see if we can avoid the latter and focus on using it to our advantage. The ability to read price action through the display of rectangles on the chart could be the boost you need to achieve your trading goals. What is congestion? Congestion is a market situation where the price is trading around a particular leve

The Mechanism Trend indicator is a hybrid indicator that shows the moments for entering the market with arrows. This indicator was created on the basis of the original indicators for searching for extreme points, the indicator is well suited for determining a reversal or a large sharp jerk to one side.
When the trend changes, the Mechanism Trend indicator uses color signaling: green - when changing from a downtrend to an uptrend, and red - vice versa, to a downtrend. You can use the indicator

This indicator provides several drawing tools to assist in various methods of chart analysis.
The drawings will keep their proportions (according to their handle trendline) across different chart scales, update in real time, and multiple drawings are supported.
#
Drawing Option
Description
1 Grid box draggable boxed grid, user defines rows x colums, diagonal ray option 2 Grid partial or fullscreen grid, sized by handle line 3 Grid flex a diagonal grid, sized and sloped by handle line

Flow Trend BLACK FRIDAY: 50% DISCONT > OLD PRICE 100$ > NOW 50$
Flow trend is designed to detect the market trend with special calculation and a combination of Bolinger band and statistical moving period
to detect the market trend without frequency change and fault.
This indicator is designed with simple parameters to use fast and easy and helpful tools to trade in a pure direction and set your SL/TP with this indicator cloud system.
FREE

本指标 基于 Zigzag 基础上... 增加了: 1.增加了箭头指示,使图表更鲜明 2.增加了价格显示,使大家更清楚的看清价格. 3.增加了报警等设置,可以支持邮件发送 原指标特性: 1.基本的波段指标构型. 2.最近的2个ZIGZAG点不具有稳定性,随着行情而改变,(就是网友所说的未来函数) 3.原指标适合分析历史拐点,波段特性,对于价格波动有一定的指导性.
Zigzag的使用方法一 丈量一段行情的起点和终点 (1)用ZigZag标注的折点作为起点和终点之后,行情的走势方向就被确立了(空头趋势); (2)根据道氏理论的逻辑,行情会按照波峰浪谷的锯齿形运行,行情确立之后会走回撤行情,回撤的过程中ZigZag会再次形成折点,就是回撤点; (3)在回撤点选择机会进场,等待行情再次启动,止损可以放到回撤的高点。 一套交易系统基本的框架就建立起来了。 Zigzag的使用方法二 作为画趋势线的连接点 趋势线是很常见的技术指标,在技术分析中被广泛地使用。 但一直以来趋势线在实战中都存在一个BUG,那就是难以保证划线的一致性。 在图表上有很多的高低点,到底该连接哪一个呢?不同的书上画趋势线的方
FREE

Relative Volume or RVOL is an indicator that averages the volume of X amount of days, making it easy to compare sessions volumes.
The histogram only has 3 colors:
Green - Above average volume
Yellow - Average volume
Red - Below average volume
The default setting is 20 days, which corresponds more or less to a month of trading.
With the data obtained from this indicator you can better gauge the commitment behind a move. For example, you will be better equipped to judge if a bre
FREE
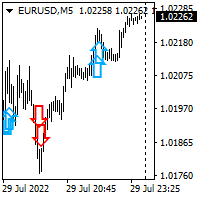
Hello all. This indicator helps you to open a trade, when break out occurred, also you can add to your position and ride it if trend continued. I use it on 1-5 min chart, as you can use short stop loss. Also profit target should be small as well. It is better to enter few small position, so you can book some profit early and ride the rest for bigger gains. Look at the past to have a plan. Enjoy.
FREE

Hello all. This indicator helps you to open a trade, when break out occurred, also you can add to your position and ride it if trend continued. I use it on 1-5 min chart, as you can use short stop loss. Also profit target should be small as well. It is better to enter few small position, so you can book some profit early and ride the rest for bigger gains. Look at the past to have a plan. Enjoy.
FREE
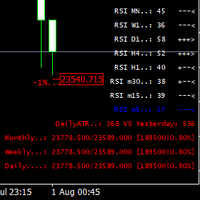
This indicator was created most for personal use. I decided to look up the last 3 bars of RSI, it is good for scalping or for weekly trading and looks as universal fx-toy. In menu you can turn on daily percentage gain info, it is good for crypto as for me, weekly and monthly gains also included as informers. Short ATR helps to determine when price was stopped and entry for pulse pump/dump. The filter of numbers of RSI can be tuned for overbought/oversold values with colors you needed. Exam
FREE
Divergence is one best ways to trade the financial market as it is a leading indicator of price action that detect high probability reversal and continuation setups. The AlgoKing Divergence Detector is an RSI and Stochastics Indicator with Divergence Detection. Features Hidden Divergence for trend continuation. Standard or Normal Divergence for trend reversal. Screen Alerts. MetaQuotes Notifications. Email Notifications. RSI Indicator built in. Stochastics Indicator built in. Types of Divergen
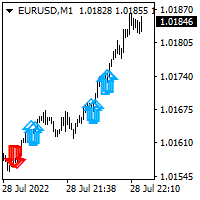
This indicator helps you to build position and profit when market turns in your favor. You will build your full position by trading many small position. Once blue arrow appear on the chart, you could add long position. Once red arrow appear on the chart, you could add short position. I personally spread my full size position in to 5-10 small position. I use small target of 2-5 pips on eurusd pair.
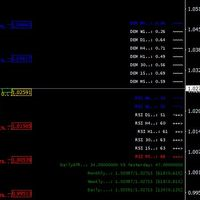
I decided to add parallel function with DeMarker to free version of my indicator with RSI MTF. it is good for scalping or for weekly trading and looks as universal fx-toy. In menu you can turn on daily percentage gain info, it is good for crypto as for me, weekly and monthly gains also included as informers. Short ATR helps to determine when price was stopped and entry for pulse pump/dump. The filter of numbers of RSI can be tuned for overbought/oversold values with colors you needed. Examp

Long term stats is a trend indicator. As the name suggests, it computes long term running average, standard deviation and min/max values Average and standard deviation are plotted on the graph and deviation value is taken as input parameter (similarly to bollinger bands). Historical minimum and maximum are plotted on the graph and updated for each bar, considering historical time series slope. (this is to somehow account for inflation/deflation) Can be used as filter for signals, as trigger to
FREE

Currently switched to the 4 hour chart - but use other time frames for confirmation. :-) I change my main time frame based on the market movement at the time. The Hurricane Forex Indicator is a multi time frame indicator that includes such things as Trade Notifications, Trade Calculator, Momentum Indicator, risk reward and much more. We have a free Trade room for our users as well. Please check out the video for full details of how this indicator works as it has over 15 years worth of developme

Las líneas de resistencia de velocidad son una poderosa herramienta para determinar la tendencia y las líneas de resistencia. El indicador construye líneas utilizando gráficos extremos y fórmulas matemáticas especiales. El indicador se puede utilizar para determinar la dirección de la tendencia y los puntos de inversión.
<---------------------------->
Parámetros del indicador:
"Depth of search" - profundidad (en barras) de búsqueda de gráficos extremos "Back step of search" - distancia mí
FREE

Máximos y mínimos de UR
UR Highs&Lows realiza un análisis en profundidad del movimiento de precios y su volatilidad, y crea un canal dentro del cual se mueve el precio. Ese canal se mueve ahora como un oscilador y se superpone con la desviación del precio para señalar posibles agotamientos y posibles reversiones.
Ventajas de usar UR Highs&Lows:
Sin parámetros Tiene 3 líneas que describen el movimiento del precio: la línea blanca, que es un promedio del precio, y las líneas azules, que s
Binaripex es un indicador de opciones binarias. El indicador muestra con una flecha en el gráfico en qué dirección irá el precio en un futuro próximo. Según nuestras estadísticas, en el 95 % de los casos, el precio en un futuro cercano (de 1 a 5 minutos en pequeños marcos de tiempo) irá por encima o por debajo de la indicación de la flecha. Esto le permite usar este indicador con alta eficiencia para operar con opciones binarias. Además, el indicador en el gráfico indica cerca de cada transacci

- 50% OFF -
Telegram group : https://t.me/+5RIceImV_OJmNDA0 MT5 version : https://www.mql5.com/en/market/product/85917?source=Site+Market+Product+Page
Master Pullback is a complete system that gives unique trading opportunities and a clear indication of the market: trend, signals as well as stop loss and take profit levels. This system has been designed to be as simple as possible and detects extreme overbought and oversold zones, support and resistance levels, as well as the major trend. You
AverageDirectionalIndex : fórmula de indicador mejorada. Esta versión de ADX determina con mucha más precisión los puntos de inversión del precio y la dirección de la tendencia actual. Además, utilizando este indicador, puede determinar la fuerza de la tendencia. Cuando la línea verde cruza la línea roja de abajo hacia arriba, significa que la tendencia está aumentando o que se está formando un retroceso temporal. Cuando la línea roja cruza la línea verde de arriba hacia abajo, significa que la
El Mercado MetaTrader es la única tienda donde se puede descargar la versión demo de un robot comercial y ponerla a prueba, e incluso optimizarla según los datos históricos.
Lea la descripción y los comentarios de los compradores sobre el producto que le interese, descárguelo directamente al terminal y compruebe cómo testar el robot comercial antes de la compra. Sólo con nosotros podrá hacerse una idea sobre el programa, sin pagar por ello.
Está perdiendo oportunidades comerciales:
- Aplicaciones de trading gratuitas
- 8 000+ señales para copiar
- Noticias económicas para analizar los mercados financieros
Registro
Entrada
Si no tiene cuenta de usuario, regístrese
Para iniciar sesión y usar el sitio web MQL5.com es necesario permitir el uso de Сookies.
Por favor, active este ajuste en su navegador, de lo contrario, no podrá iniciar sesión.