MQL4 and MQL5 Programming Articles

Study the MQL5 language for programming trading strategies in numerous published articles mostly written by you - the community members. The articles are grouped into categories to help you quicker find answers to any questions related to programming: Integration, Tester, Trading Strategies, etc.
Follow our new publications and discuss them on the Forum!
Add a new article

You are missing trading opportunities:
- Free trading apps
- Over 8,000 signals for copying
- Economic news for exploring financial markets
Registration
Log in
You agree to website policy and terms of use
If you do not have an account, please register


MetaTrader 5 Machine Learning Blueprint (Part 10): Bet Sizing for Financial Machine Learning
Fixed fractions and raw probabilities misallocate risk under overlapping labels and induce overtrading. This article delivers four AFML-compliant sizers: probability-based (z-score → CDF, active-bet averaging, discretization), forecast-price (sigmoid/power with w calibration and limit price), budget-constrained (direction-only), and reserve (mixture-CDF via EF3M). You get a signed, bounded position series with documented conditions of use.


From "Best Pass" to Robust Solutions: Exploring the Optimization Surface in MetaTrader 5
The article examines an engineering approach to optimizing an Expert Advisor in MetaTrader 5: from collecting custom metrics through Optimization Frames to parameter surface analysis. A simple event-driven EMA/RSI model demonstrates CSV export, smoothing, and local stability assessment in Python. The goal is to find stable areas of configurations and validate them with forward optimization for reliable implementation.


Population optimization algorithms: Firefly Algorithm (FA)
In this article, I will consider the Firefly Algorithm (FA) optimization method. Thanks to the modification, the algorithm has turned from an outsider into a real rating table leader.


Neural networks made easy (Part 66): Exploration problems in offline learning
Models are trained offline using data from a prepared training dataset. While providing certain advantages, its negative side is that information about the environment is greatly compressed to the size of the training dataset. Which, in turn, limits the possibilities of exploration. In this article, we will consider a method that enables the filling of a training dataset with the most diverse data possible.


Population optimization algorithms: Stochastic Diffusion Search (SDS)
The article discusses Stochastic Diffusion Search (SDS), which is a very powerful and efficient optimization algorithm based on the principles of random walk. The algorithm allows finding optimal solutions in complex multidimensional spaces, while featuring a high speed of convergence and the ability to avoid local extrema.


Developing a trading Expert Advisor from scratch (Part 25): Providing system robustness (II)
In this article, we will make the final step towards the EA's performance. So, be prepared for a long read. To make our Expert Advisor reliable, we will first remove everything from the code that is not part of the trading system.


Interview with Nikolay Kositsin: multicurrency EA are less risky (ATC 2010)
Nikolay Kositsin has told us about his developments. He believes multicurrency Expert Advisors are a promising direction; and he is an experienced developer of such robots. At the championships, Nikolay participates only with multicurrency EAs. His Expert Advisor was the only multicurrency EA among the prize winners of all the ATC contests.


Reimagining Classic Strategies in Python: MA Crossovers
In this article, we revisit the classic moving average crossover strategy to assess its current effectiveness. Given the amount of time since its inception, we explore the potential enhancements that AI can bring to this traditional trading strategy. By incorporating AI techniques, we aim to leverage advanced predictive capabilities to potentially optimize trade entry and exit points, adapt to varying market conditions, and enhance overall performance compared to conventional approaches.


Data Science and Machine Learning(Part 14): Finding Your Way in the Markets with Kohonen Maps
Are you looking for a cutting-edge approach to trading that can help you navigate complex and ever-changing markets? Look no further than Kohonen maps, an innovative form of artificial neural networks that can help you uncover hidden patterns and trends in market data. In this article, we'll explore how Kohonen maps work, and how they can be used to develop smarter, more effective trading strategies. Whether you're a seasoned trader or just starting out, you won't want to miss this exciting new approach to trading.


Using PSAR, Heiken Ashi, and Deep Learning Together for Trading
This project explores the fusion of deep learning and technical analysis to test trading strategies in forex. A Python script is used for rapid experimentation, employing an ONNX model alongside traditional indicators like PSAR, SMA, and RSI to predict EUR/USD movements. A MetaTrader 5 script then brings this strategy into a live environment, using historical data and technical analysis to make informed trading decisions. The backtesting results indicate a cautious yet consistent approach, with a focus on risk management and steady growth rather than aggressive profit-seeking.


DoEasy. Controls (Part 5): Base WinForms object, Panel control, AutoSize parameter
In the article, I will create the base object of all library WinForms objects and start implementing the AutoSize property of the Panel WinForms object — auto sizing for fitting the object internal content.


Developing a multi-currency Expert Advisor (Part 5): Variable position sizes
In the previous parts, the Expert Advisor (EA) under development was able to use only a fixed position size for trading. This is acceptable for testing, but is not advisable when trading on a real account. Let's make it possible to trade using variable position sizes.


Utilizing CatBoost Machine Learning model as a Filter for Trend-Following Strategies
CatBoost is a powerful tree-based machine learning model that specializes in decision-making based on stationary features. Other tree-based models like XGBoost and Random Forest share similar traits in terms of their robustness, ability to handle complex patterns, and interpretability. These models have a wide range of uses, from feature analysis to risk management. In this article, we're going to walk through the procedure of utilizing a trained CatBoost model as a filter for a classic moving average cross trend-following strategy.

Graphical Interfaces X: Updates for the Rendered table and code optimization (build 10)
We continue to complement the Rendered table (CCanvasTable) with new features. The table will now have: highlighting of the rows when hovered; ability to add an array of icons for each cell and a method for switching them; ability to set or modify the cell text during the runtime, and more.


DoEasy. Controls (Part 23): Improving TabControl and SplitContainer WinForms objects
In this article, I will add new mouse events relative to the boundaries of the working areas of WinForms objects and fix some shortcomings in the functioning of the TabControl and SplitContainer controls.


Category Theory in MQL5 (Part 15) : Functors with Graphs
This article on Category Theory implementation in MQL5, continues the series by looking at Functors but this time as a bridge between Graphs and a set. We revisit calendar data, and despite its limitations in Strategy Tester use, make the case using functors in forecasting volatility with the help of correlation.


Data Science and ML (Part 33): Pandas Dataframe in MQL5, Data Collection for ML Usage made easier
When working with machine learning models, it’s essential to ensure consistency in the data used for training, validation, and testing. In this article, we will create our own version of the Pandas library in MQL5 to ensure a unified approach for handling machine learning data, for ensuring the same data is applied inside and outside MQL5, where most of the training occurs.


Timeseries in DoEasy library (part 57): Indicator buffer data object
In the article, develop an object which will contain all data of one buffer for one indicator. Such objects will be necessary for storing serial data of indicator buffers. With their help, it will be possible to sort and compare buffer data of any indicators, as well as other similar data with each other.


Population optimization algorithms: Artificial Bee Colony (ABC)
In this article, we will study the algorithm of an artificial bee colony and supplement our knowledge with new principles of studying functional spaces. In this article, I will showcase my interpretation of the classic version of the algorithm.


From Novice to Expert: Animated News Headline Using MQL5 (VI) — Pending Order Strategy for News Trading
In this article, we shift focus toward integrating news-driven order execution logic—enabling the EA to act, not just inform. Join us as we explore how to implement automated trade execution in MQL5 and extend the News Headline EA into a fully responsive trading system. Expert Advisors offer significant advantages for algorithmic developers thanks to the wide range of features they support. So far, we’ve focused on building a news and calendar events presentation tool, complete with integrated AI insights lanes and technical indicator insights.


Understand and Efficiently use OpenCL API by Recreating built-in support as DLL on Linux (Part 2): OpenCL Simple DLL implementation
Continued from the part 1 in the series, now we proceed to implement as a simple DLL then test with MetaTrader 5. This will prepare us well before developing a full-fledge OpenCL as DLL support in the following part to come.


Matrix Utils, Extending the Matrices and Vector Standard Library Functionality
Matrix serves as the foundation of machine learning algorithms and computers in general because of their ability to effectively handle large mathematical operations, The Standard library has everything one needs but let's see how we can extend it by introducing several functions in the utils file, that are not yet available in the library

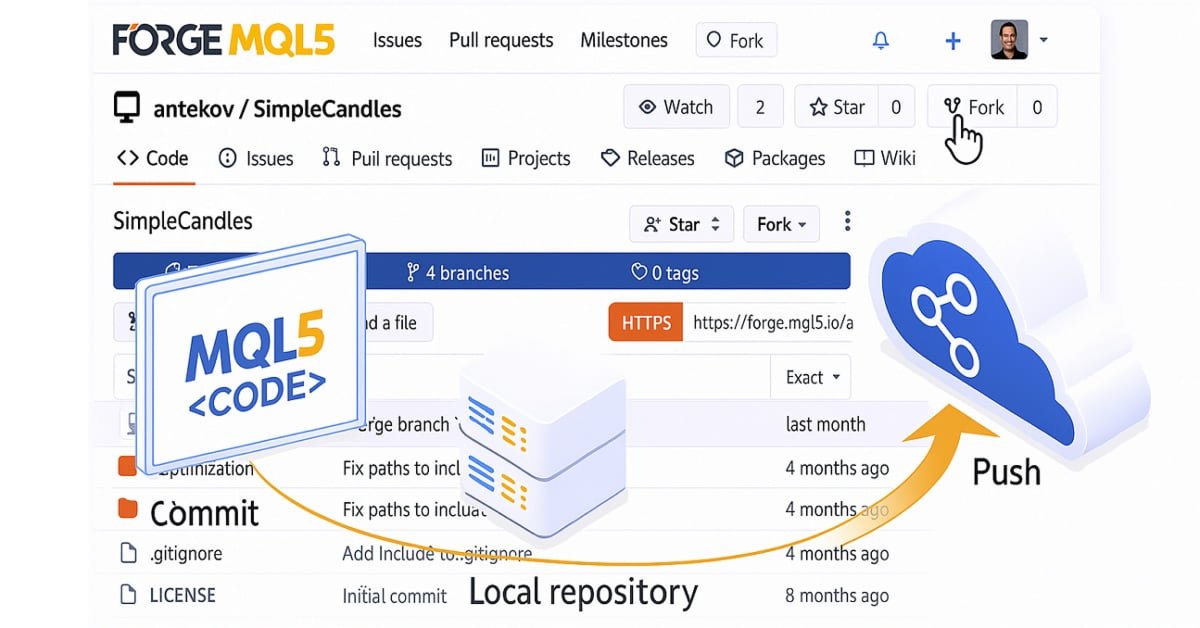
Moving to MQL5 Algo Forge (Part 2): Working with Multiple Repositories
In this article, we are considering one of the possible approaches to organizing the storage of the project's source code in a public repository. We will distribute the code across different branches to establish clear and convenient rules for the project development.

Interview with Egidijus Bockus (ATC 2012)
"I examined many indicators before realizing that they are not necessary for making money on Forex" - our present interviewee Egidijus Bockus (Egidijus) told us boldly. We have all reasons to take his words seriously, as his Expert Advisor occupies the third place with more than $32 000 beginning from the third week of the Automated Trading Championship 2012.


Multiple Symbol Analysis With Python And MQL5 (Part 3): Triangular Exchange Rates
Traders often face drawdowns from false signals, while waiting for confirmation can lead to missed opportunities. This article introduces a triangular trading strategy using Silver’s pricing in Dollars (XAGUSD) and Euros (XAGEUR), along with the EURUSD exchange rate, to filter out noise. By leveraging cross-market relationships, traders can uncover hidden sentiment and refine their entries in real time.


Developing a trading Expert Advisor from scratch (Part 23): New order system (VI)
We will make the order system more flexible. Here we will consider changes to the code that will make it more flexible, which will allow us to change position stop levels much faster.


Quick Integration of a Large Language Model into MetaTrader 5 (Part I): Building the Model
The article explores the revolutionary integration of large language models (LLMs) with the MetaTrader 5 trading platform, where AI does not simply predict prices but makes autonomous trading decisions by analyzing market context much like an experienced trader. The author highlights a fundamental difference between LLMs and classical machine learning models such as CatBoost — the ability to engage in metacognition and self-reflection, which allows the system to learn from its own mistakes and improve its strategy.


How to Detect Round-Number Liquidity in MQL5
The article presents an MQL5 method for detecting psychological round numbers by converting prices to strings and counting trailing zeros (ZeroSize). It outlines the theory of institutional liquidity at integers, explains the GetZeroCount logic with tick-size normalization to avoid floating‑point errors, and details hierarchical visualization. Case studies across forex, metals, and crypto, plus timeframe filters and inputs, show how to use confluence and basic risk controls in practice.


SQLite capabilities in MQL5: Example of a dashboard with trading statistics by symbols and magic numbers
In this article, we will consider creating an indicator that displays trading statistics on a dashboard by account and by symbols and trading strategies. We will implement the code based on examples from the Documentation and the article on working with databases.


From Novice to Expert: Parameter Control Utility
Imagine transforming the traditional EA or indicator input properties into a real-time, on-chart control interface. This discussion builds upon our foundational work in the Market Periods Synchronizer indicator, marking a significant evolution in how we visualize and manage higher-timeframe (HTF) market structures. Here, we turn that concept into a fully interactive utility—a dashboard that brings dynamic control and enhanced multi-period price action visualization directly onto the chart. Join us as we explore how this innovation reshapes the way traders interact with their tools.


DoEasy. Controls (Part 29): ScrollBar auxiliary control
In this article, I will start developing the ScrollBar auxiliary control element and its derivative objects — vertical and horizontal scrollbars. A scrollbar is used to scroll the content of the form if it goes beyond the container. Scrollbars are usually located at the bottom and to the right of the form. The horizontal one at the bottom scrolls content left and right, while the vertical one scrolls up and down.

Algorithmic Trading Strategies: AI and Its Road to Golden Pinnacles
This article demonstrates an approach to creating trading strategies for gold using machine learning. Considering the proposed approach to the analysis and forecasting of time series from different angles, it is possible to determine its advantages and disadvantages in comparison with other ways of creating trading systems which are based solely on the analysis and forecasting of financial time series.


Introduction to MQL5 (Part 42): Beginner Guide to File Handling in MQL5 (IV)
This article shows how to build an MQL5 indicator that reads a CSV trading history, extracts Profit($) values and total trades, and computes a cumulative balance progression. We plot the curve in a separate indicator window, auto-scale the Y-axis, and draw horizontal and vertical axes for alignment. The indicator updates on a timer and redraws only when new trades appear. Optional labels display per-trade profit and loss to help assess performance and drawdowns directly on the chart.


Automating Market Memory Zones Indicator: Where Price is Likely to Return
This article turns Market Memory Zones from a chart-only concept into a complete MQL5 Expert Advisor. It automates Displacement, Structure Transition (CHoCH), and Liquidity Sweep zones using ATR- and candle-structure filters, applies lower-timeframe confirmation, and enforces risk-based position sizing with dynamic SL and structure-based TP. You will get the code architecture for detection, entries, trade management, and visualization, plus a brief backtest review.


Reimagining Classic Strategies (Part II): Bollinger Bands Breakouts
This article explores a trading strategy that integrates Linear Discriminant Analysis (LDA) with Bollinger Bands, leveraging categorical zone predictions for strategic market entry signals.

Testing Visualization: Account State Charts
Enjoy the process of testing with charts, displaying the balance - now all the necessary information is always in view!

Andrey Voitenko: Programming errors cost me $15,000 (ATC 2010)
Andrey Voitenko is participating in the Automated Trading Championship for the first time, but his Expert Advisor is showing mature trading. For already several weeks Andrey's Expert Advisors has been listed in the top ten and seems to be continuing his positive performance. In this interview Andrey is telling about his EA's features, errors and the price they cost him.


Neural Networks in Trading: Scene-Aware Object Detection (HyperDet3D)
We invite you to get acquainted with a new approach to detecting objects using hypernetworks. A hypernetwork generates weights for the main model, which allows taking into account the specifics of the current market situation. This approach allows us to improve forecasting accuracy by adapting the model to different trading conditions.

Two-Stage Modification of Opened Positions
The two-stage approach allows you to avoid the unnecessary closing and re-opening of positions in situations close to the trend and in cases of possible occurrence of divirgence.


Neural networks made easy (Part 35): Intrinsic Curiosity Module
We continue to study reinforcement learning algorithms. All the algorithms we have considered so far required the creation of a reward policy to enable the agent to evaluate each of its actions at each transition from one system state to another. However, this approach is rather artificial. In practice, there is some time lag between an action and a reward. In this article, we will get acquainted with a model training algorithm which can work with various time delays from the action to the reward.