
MQL5 Wizard Techniques you should know (Part 27): Moving Averages and the Angle of Attack
Introduction
We continue the series on trade setups and ideas that can be quickly tested and fool-proofed thanks to the MQL5 wizard by considering the angle of attack. Broadly, the phrase ‘angle of attack’ is associated with the ideal angle at which a fighter jet ought to take off, when optimizing for maximum air lift and minimum fuel consumption.
For traders, though, this phrase usually refers to the trajectory of a security’s price when in the midst of a trend, with the loose consensus being that a steep angle points to a strong trend. We therefore start this article by exploring not just this view, but more importantly by also adopting the means by which the indicator or price angle could be measured. We then criticize this approach by trying to point out some of the problems with it, propose a possibly better alternative, and conclude as always with test results and reports.
We as always use an instance of a custom signal class to test our hypotheses on how to measure the attack angle, and we measure this angle not off of raw price but a moving average. We use the decaying moving average as our indicator for measuring and tracking the significance of the attack angle. Raw prices can also be used to monitor attack angles, however since they are bound to have more volatile values than an indicator buffer, we adopt the former. Any moving average could have been used as well, but we adopted the decaying moving average because it is a bit novel and may not be familiar to most traders.
Current Approaches to Using the Angle of Attack
The pedestrian approach to working out the attack angle starts by identifying two price points within a price or indicator buffer from which the angle will be measured. This buffer can be the raw security prices, but these tend to be very volatile, so it is more common to use a smoothed buffer like a moving average buffer. So, if we are performing this on the daily time frame, we would get the moving average for today and the moving average of N days ago.
What would follow this is determining the change in the moving average per period, which in our case is the N periods across which the two moving average values are got. The first thing that is determined usually is the slope, m, that can be computed by using the formula presented below:
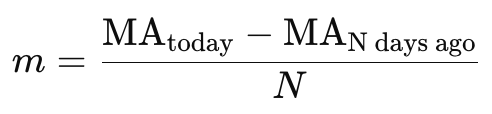
Where:
- MA (today) is the moving average value today.
- MA (N days ago) is the moving average value N days ago.
- N is the number of days between the two points.
The returned value of m from our formula above does represent slope and is proportional to the attack angle of the moving average. It can be used in its present format as a gauge for steepness and therefore price momentum. However, for many people, the notion of an angle refers to something on paper that for the purposes of this price action would be in the range 0 – 90 degrees.
If you want to represent this slope therefore as an angle, you would use the arc-tangent function (inverse tangent) to convert the slope to degrees:
![]()
The returned value θ is the angle in radians. To convert it to degrees, you would multiply it by:
![]()
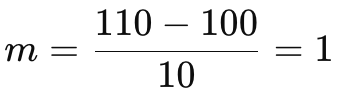
To see this in action, let us consider a very simple application example. Suppose you have the following data for a 10-day period:
- 10 days ago, the MA was: 100
- Today the MA is: 110
From our simple formula above the slope, m, would be:
From this, the angle θ(theta) in radians would be:
![]()
And if we convert this to degrees:
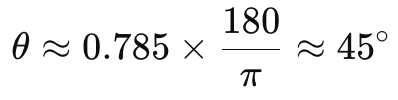
We would end up with a value that in many people’s minds is on the cusp of being very steep. 45 degrees. If the security in question was a yen forex pair, you could justify or wrap your head around the idea of 45 degrees. However, consider a situation where the price is of a tech company, and it rises by the same amount but in one day. If we do the same calculations we have gone through above, our angle is 84 degrees, which is close to 90! However, the basic interpretation of "angle of attack" with this approach, which isn't a standard term in financial analysis, leads to interpreting the slope of a moving average as providing insight into the trend's strength and direction. The steeper the angle (or slope), the stronger the trend.
Problems with the Current Approach & Methods
As mentioned above in the application of current angle of attack measurements, there are a number of problems, primarily stemming from the over-sensitivity to the price scale and inconsistent angle results in varying time frames. To illustrate these, let’s start with the problem of price sensitivity.
If our traded security was a non-yen forex pair such as GBPUSD, then a comparable 10-day price change, which for this pair would be about 0.10 give or take, would give an m value of 0.01. If we multiply this by 180 and then divide the result by PI, we get an angle of 0.57 degrees. We all know from our observations that 45 degrees and 0.57 degrees are miles apart in magnitude and yet both currencies, the yen pair and GBPUSD had 10000 points moves! You could make the argument that this difference in angles is down to yen pairs being more volatile, but the ratio of the two angles is 90x!! As most traders would agree, the yen is not 90 times more volatile than non-yen pairs like GBPUSD. This is obviously because in order to properly assess the change in forex pair prices, the tick value of the point move needs to be put into consideration. And to this end, according to forex.com, the most volatile pairs are topped by AUDUSD and NZDUSD in 2023!
The most volatile yen pair comes in at number 3 and this is despite both AUDUSD and NZDUSD trading with 5-digit decimals, implying that our 0.10 point move above would yield the same angle of 0.57 degrees.
According to the forex.com list, AUDUSD topped with the most volatility due to an average 1.04% daily change. With a price in the ballpark of 0.68150, a move over 10 days with 1.04% per day would amount to 0.070876. This would give us an m, or slope of 0.0070876, and an angle, over the 10 days, of 0.406 degrees. Less than the 0.507 we had estimated with GBPUSD above, but more to the point GBPJPY which ranked 7thon the list was reported to have an average price change of 0.81%. This price change over a similar 10 days, with a base price of 147.679, would work out to an angle of 50.1 degrees!
Now granted the attack angle is not meant to measure volatility per se, however most readers and traders I think would expect the magnitude of an estimated attack angle to be a measure, in some way, of the size of the eventual security price move. The fact that this is clearly not the case does throw this approach in measuring this angle in jeopardy. In addition to these inconsistencies from sensitivity to price, changes in a chart/ analysis time frame can hugely sway the size of the attack angle.
Consider for instance in our cases above if we were to switch from the daily time frame to say the 4-hour time frame. In the very first illustration where we had the 45 degrees angle, that value would change to 0.95 degrees! Which warrants the question that why on simply ‘detailing’ the period across which we are measuring the angle, without making any changes to the price scale, do we suddenly get a very flat angle that is less than one degree? The raw answer to this is we have a lengthened base and therefore the angle rises less when compared to the same height, but since the length of the base is really the same when measure in time and not its units, this distortion should not be present.
Introducing an Alternative Method
A closer examination of the problems from changes in the time frame, though, does present a possible solution. In any triangle, whenever we are looking for the angle size, and we are presented with both a height and base for this right-angled triangle the arctangent of the base divided by the height should give us one of the angles in degrees.
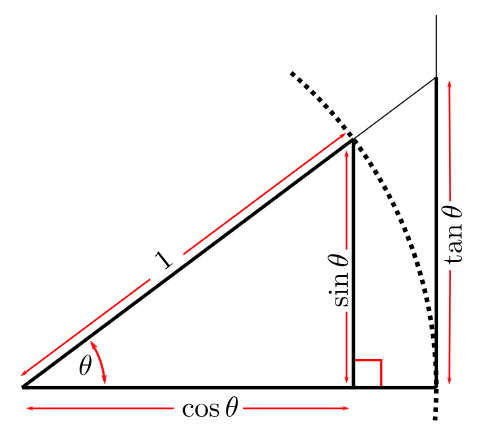
So, from our image above, the base to the larger right-angled triangle is actually 1, (it is more than cosθ), which is why our opposite side has a height of tanθ. The key point to note here is that the units of the adjacent side (the base) are similar to the units of the opposite side (the height). When this is the case you do get meaningful degree values for theta when you find the arc-tangent or arc-cosine whatever the case may be of the angle theta.
The diagram shared above, though providing ‘too much information’, emphasizes the definition of the tangent as being a ratio. Sine to Cosine. Or like to like. You need to have the horizontal axis in the same units as the vertical axis if the angle theta is going to be meaningful. This then begs the question of how can the two axes of price and time be harmonized into having the same units?
The choices faced in this normalization are either both the time axis and price axis get converted to units of time, or both get converted to units of price. This conversion notion may seem radical at first, but once we start to view and compare the results, it will all make sense. Because price is what is critical, a price move in the wrong direction is what costs you draw-downs, we will have both the ‘vertical’ and ‘horizontal’ axes of our price action marked in price units. This then begs the question; how do we rescale a time axis into price?
There are a number of approaches that can be taken in doing this, and our purpose with this article is not to enumerate all of them or necessarily use the ‘best’ one. What we will use though will be a variable scale. When presented with any two price points that are at a distance D apart in time, the distance D will be converted to the price units of the range in price over the previous distance D before it. It seems very simple, but it does produce relatively consistent results for the attack angle size. In MQL5, we would implement this as follows:
//+------------------------------------------------------------------+
//| Get Angle function
//+------------------------------------------------------------------+
double CSignalAA::Angle(int Index)
{  double _angle = 0.0;
   double _price = DM(Index) - DM(Index+m_length_period);
   double _max = DM(Index+m_length_period+1);
   double _min = DM(Index+m_length_period+1);
   for(int i=Index+m_length_period+2;i<Index+(2*m_length_period);i++)
   {  double _dm = DM(i);
      _max = fmax(_max, _dm);
      _min = fmin(_min, _dm);
   }
   double _time = fmax(m_symbol.Point(), _max - _min);
   _angle = (180.0 / M_PI) * MathArctan(fabs(_price) / _time);
   if(_price < 0.0)
   {  _angle *= -1.0;
   }
   return(_angle);
}
Our function simply takes two index placeholders and uses these to determine where to measure the attack angle from and also as mentioned above how far back in history to go in search of the price range which serves as our measure of time or horizontal axis value. The price range in the picked history could be zero that is why we have a point as determined by the traded security’s minimum price point size, serve as the minimum range. Readers can change this value to be the spread at the time, or any value, so long as zero divides are avoided. We are referencing the decaying moving average function (DM) and this is introduced below.
Decaying Moving Average (DMA)
This moving average gives exponentially decaying weights, which fall off faster than in traditional exponential moving averages. It is defined by the formula presented below:
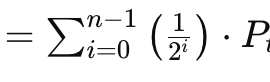
Where
- n is the size of the averaged sample
- i is a position index within the sample
- P is the price at time i
Like some of the novel moving averages we have looked at in recent articles, within this series, this one can be implemented as a function or a custom indicator if you’re looking to trade manually with it. Custom Indicators are good at buffering which can bring that extra efficiency even to an Expert Advisor. However we are sticking with the function approach for our testing purposes as a Custom Indicator implies our compiled Expert Advisor will have extra requirements.
There are a lot of exponential averages that give more weight to recent prices, I think the decaying moving average does this on steroids. We can implement it in MQL5 as follows:
//+------------------------------------------------------------------+
//| Decaying Mean                                                   |
//+------------------------------------------------------------------+
double CSignalAA::DM(int Index, int Mask = 8)
{  double _dm = 0.0;
   vector _r;
   if(_r.CopyRates(m_symbol.Name(), m_period, Mask, Index, m_length_period))
   {  //vectors are not series
      double _weight = 0.0;
      for(int i = 0; i < m_length_period; i++)
      {  _dm += (1.0/pow(2.0, m_length_period-i))*_r[i];
         _weight += (1.0/pow(2.0, m_length_period-i));
      }
      if(_weight != 0.0)
      {  _dm /= _weight;
      }
   }
   return(_dm);
}
We are simply applying a weight to each price within the sample that is being averaged, with the main caution here being that vectors do not copy rates as series. This means we need to be cognizant of the highest index price being the latest price or price closest to the index from which we began our copy. This implies that our weighting (exponent given to the 2 denominator) will be reversed as we are counting up in a for loop.
Signal Class
To put this all together into a class, we do add the decay-mean and angle functions to an instance of a signal class and of course make changes to the long and short conditions as shown below:
//+------------------------------------------------------------------+
//| "Voting" that price will grow.                                   |
//+------------------------------------------------------------------+
int CSignalAA::LongCondition(void)
{  int result = 0;
   double _angle = Angle(StartIndex());
   if(_angle >= m_threshold)
   {  result = int(round(100.0 * ((_angle) / (90.0))));
   }
   return(result);
}
//+------------------------------------------------------------------+
//| "Voting" that price will fall.                                   |
//+------------------------------------------------------------------+
int CSignalAA::ShortCondition(void)
{  int result = 0;
   double _angle = Angle(StartIndex());
   if(_angle <= -m_threshold)
   {  result = int(round(100.0 * (fabs(_angle) / (90.0))));
   }
   return(result);
}
Our conditions are really simple and all they check is if the angle, as measured from an input distance, exceeds or is equal to an input threshold in magnitude. This means our conditions are inherently trend following. The ‘Angle’ function does return a positive or negative value, therefore the long and short conditions check for this before opening a position. The trend following approach could be flipped in situations where the angle is too steep. This is something we have not explored in this article but is left to the reader to pursuit and see if it could have some merits. One more point of interest could be how we have sized the ‘result’ value in the conditions. Since our Angle function is now returning more ‘consistent’ values as opposed to those from the orthodox approach, we can be confident that we will not get an angle exceeding or even near 90 degrees in magnitude.
That’s why we normalize the absolute value of the angle by dividing it by 90 and re-scaling it to be in the required 0 – 100 range so that it serves as the result. Alternative approaches at normalizing this, again, can be explored, but this is the one that tends to give most weight to the value of the attack angle that is the main subject for this article.
Strategy Testing and Reports for Both Approaches
If we perform tests on the 4-hour time frame for the pair GBPCHF over the year 2023 (from 2023.01.01 to 2024.01.01) we do get the following results:


They do indicate some potential, however the argument could be made that not enough trades are being placed. And of course, these runs besides being limited to just a year, they are not utilizing the walk forward feature of strategy tester which can serve as a quick sifter of what will work and what will not. We have however used the decaying moving average slope as our proxy for price slope and because this particular average is heavily skewed towards the most recent prices, we are bound to get a lot of wild swings in signals.
Critical Attack Angle
The critical angle is a concept we will borrow from aerodynamics. This far, our setup has been looking for long or short conditions by solely basing off the magnitude of the decaying moving average angle. The critical angle of attack introduces the notion that this angle, on which we base our opening decisions, rather than being defined by a solo threshold value is actually better defined to be within a band or specific range. To test and exploit this, we modify our custom signal class by introducing an extra parameter.
The parameter we add to our signal class is the ‘m_band’ double type value that helps set the outer range of the trigger angle, since we already have the threshold value. This modification would be reflected as follows in the long and short condition functions:
//+------------------------------------------------------------------+
//| "Voting" that price will grow.                                   |
//+------------------------------------------------------------------+
int CSignalAA::LongCondition(void)
{  int result = 0;
   double _angle = Angle(StartIndex());
   if(_angle >= m_threshold && _angle <= m_threshold+m_band)
   {  result = int(round(100.0 * ((_angle) / (90.0))));
   }
   return(result);
}
//+------------------------------------------------------------------+
//| "Voting" that price will fall.                                   |
//+------------------------------------------------------------------+
int CSignalAA::ShortCondition(void)
{  int result = 0;
   double _angle = Angle(StartIndex());
   if(_angle <= -m_threshold && _angle >= -(m_threshold+m_band))
   {  result = int(round(100.0 * (fabs(_angle) / (90.0))));
   }
   return(result);
}
The main change is the check that the angle is more than the threshold as had been the case with our first signal but also that it is below an upper limit that is defined by the band parameter. If we perform tests with this signal file, once assembled into an Expert Advisor (guides to this for those who are new can be found here and here), we do get the following results from a similar test run as we had above:


A quick comparison with our earlier results clearly shows we are not trading as frequently and perhaps this is bound to be expected because we now require the angle to not only exceed the threshold, but also remain within a certain band. Overall performance was better from most metrics i.e. profit factor, recovery factor, drawdowns percent etc. This is something, therefore, that could be explored further through testing over longer periods and with tick data, before conclusions can be drawn on its efficacy.
Conclusion
So, to sum up, looked at the angle of attack as a metric for financial time series from both its traditional view of simply taking the angle basing off of price and raw time changes as well as from a novel approach of converting the time series time axis into price units. Testing from the former approach has not been showcased in this article because we spotted so many inconsistencies in how the attack angle is measure that it seemed futile and a waste of compute resources to try to perform strategy tester runs.
Testing though with our novel approach of having the horizontal or time axis demarcated in units of time, before we compute the attack angle, has yielded some promising results. We performed tests with this approach in two modes. First, we simply used an angle threshold to sift through which positions we should open and secondly, we engaged the critical angle concept where to open a position, the attack angle had to not just exceed the threshold, but also be close enough to the threshold by being within a certain band.
- Free trading apps
- Over 8,000 signals for copying
- Economic news for exploring financial markets
You agree to website policy and terms of use
Stephen,
I am reviewing this article as it seems to complement ideas I have had in the past. It appears that the code referenced in the article is missing. The <code:.../> inclusion symbols are there but the label appears to reference an unknown source file. Is the source for the file included as Attack_Angle_cr.mq5 & Signalwz_c.mqh?
Thanks, CapeCoddah
Hello,
The code was part of the attached file. It has been included within the text and sent for publishing.
The article MQL5 Wizard Features you need to know (Part 27) has been published : Moving averages and angle of attack:
Author: Stephen Njuki