
Automating Trading Strategies in MQL5 (Part 6): Mastering Order Block Detection for Smart Money Trading
Introduction
In the previous article (Part 5 of the series), we developed the Adaptive Crossover RSI Trading Suite Strategy, combining moving average crossovers with RSI filtering to identify high-probability trade opportunities. Now, in Part 6, we focus on pure price action analysis with an automated Order Block Detection System in MetaQuotes Language 5 (MQL5), a powerful tool used in smart money trading. This strategy identifies key institutional order blocks—zones where large players accumulate or distribute positions—helping traders anticipate potential reversals and trend continuations.
Unlike traditional indicators, this approach relies entirely on price structure, detecting bullish and bearish order blocks dynamically based on historical price behavior. The system visualizes these zones directly on the chart, providing traders with clear market context and potential trade setups. In this article, we will cover the step-by-step development of this strategy, from defining order blocks to implementing them in MQL5, backtesting their effectiveness, and analyzing performance. We will structure this discussion through the following sections:
- Strategy Blueprint
- Implementation in MQL5
- Backtesting
- Conclusion
By the end, you will have a solid foundation in automating order block detection, enabling you to integrate smart money concepts into your trading algorithms. Let’s get started.
Strategy Blueprint
We will begin by identifying consolidation ranges, which occur when the price moves within a confined range without a clear trend direction. To do this, we will scan the market for areas where price action lacks significant breakouts. Once we detect a breakout from this range, we will assess whether an order block can be formed. Our validation process will involve checking the three preceding candles before the breakout. If these candles exhibit impulsive movement, we will classify the order block as either bullish or bearish based on the breakout direction. A bullish order block will be identified when the breakout is to the upside, while a bearish order block will be marked when the breakout is to the downside. Once validated, we will plot the order block on the chart for future reference. Here is an example.
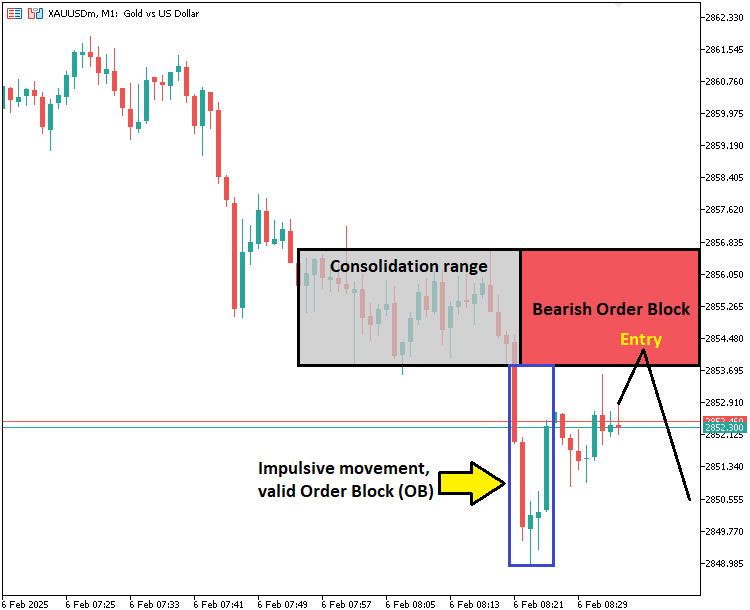
If the preceding three candles do not show impulsive movement, we will not validate an order block. Instead, we will only draw the consolidation range, ensuring that we do not mark weak or insignificant zones. After marking the valid order blocks, we will continuously monitor price action. If the price retraces back to a previously validated order block, we will execute trades in alignment with the initial breakout direction, expecting the trend to continue. However, if an order block extends beyond the last significant price point, we will remove it from our valid order block array, ensuring that we only trade relevant and fresh zones. This structured approach will help us focus on high-probability setups, filtering out weak breakouts and ensuring that our trades align with smart money movements.
Implementation in MQL5
To implement the identification of the Order Blocks in MQL5, we will need to define some global variables that will be necessary throughout the process.
#include <Trade/Trade.mqh>
CTrade obj_Trade;

// Struct to hold both the price and the index of the high or low
struct PriceIndex {
    double price;
    int index;
};

// Global variables to track the range and breakout state
PriceIndex highestHigh = {0, 0}; // Stores the highest high of the range
PriceIndex lowestLow = {0, 0};  // Stores the lowest low of the range
bool breakoutDetected = false;  // Tracks if a breakout has occurred

double impulseLow = 0.0;
double impulseHigh = 0.0;
int breakoutBarIndex = -1; // To track the bar at which breakout occurred
datetime breakoutTime = 0; // To store the breakout time

string totalOBs_names[];
datetime totalOBs_dates[];
bool totalOBs_is_signals[];

#define OB_Prefix "OB REC "
#define CLR_UP clrLime
#define CLR_DOWN clrRed

bool is_OB_UP = false;
bool is_OB_DOWN = false;
We begin by including the "Trade.mqh" library and creating a "CTrade" object, "obj_Trade", to handle trade execution. We define a "PriceIndex" struct to store both the price level and its corresponding index, which helps us track the highest high and lowest low within the consolidation range. The global variables "highestHigh" and "lowestLow" store these key levels, while the "breakoutDetected" flag indicates whether a breakout has occurred.
To validate impulsive movement, we introduce "impulseLow" and "impulseHigh", which will help determine the strength of the breakout. The variable "breakoutBarIndex" tracks the exact bar where the breakout occurred, and "breakoutTime" stores the corresponding timestamp. For order block management, we maintain three global arrays: "totalOBs_names", "totalOBs_dates", and "totalOBs_is_signals". These arrays store order block names, their respective timestamps, and whether they are valid trade signals.
We define the order block prefix as "OB_Prefix" and assign color codes for bullish and bearish order blocks using "CLR_UP" for bullish (lime) and "CLR_DOWN" for bearish (red). Finally, the boolean flags "is_OB_UP" and "is_OB_DOWN" help us track whether the last detected order block is bullish or bearish. We don't need to track the Order Blocks on the initialization of the program since we want to start fresh on a clean slate. Thus, we will implement the control logic on the OnTick event handler directly.
//+------------------------------------------------------------------+
//| Expert ontick function                                           |
//+------------------------------------------------------------------+
void OnTick() {
    static bool isNewBar = false;
    int currBars = iBars(_Symbol, _Period);
    static int prevBars = currBars;

    // Detect a new bar
    if (prevBars == currBars) {
        isNewBar = false;
    } else if (prevBars != currBars) {
        isNewBar = true;
        prevBars = currBars;
    }

    if (!isNewBar)
        return; // Process only on a new bar

    int rangeCandles = 7;         // Initial number of candles to check
    double maxDeviation = 50;     // Max deviation between highs and lows in points
    int startingIndex = 1;        // Starting index for the scan
    int waitBars = 3;

   //---

}
On the OnTick event handler, we begin by detecting the formation of a new bar using "currBars" and "prevBars". We set "isNewBar" to "true" when a new bar appears and return early if no new bar is detected. We then define "rangeCandles" as "7", which represents the minimum number of candles we analyze to identify consolidation. The "maxDeviation" variable is set to "50" points, limiting the acceptable difference between the highest and lowest prices within the range. The "startingIndex" is initialized to "1", ensuring that we start scanning from the most recent completed bar. Additionally, we set "waitBars" to "3" to define how many bars should pass before validating an order block. Next, we need to check for consolidation ranges and get the prices for further determination of valid order blocks.
// Check for consolidation or extend the range
if (!breakoutDetected) {
  if (highestHigh.price == 0 && lowestLow.price == 0) {
      // If range is not yet established, look for consolidation
      if (IsConsolidationEqualHighsAndLows(rangeCandles, maxDeviation, startingIndex)) {
          GetHighestHigh(rangeCandles, startingIndex, highestHigh);
          GetLowestLow(rangeCandles, startingIndex, lowestLow);

          Print("Consolidation range established: Highest High = ", highestHigh.price,
                " at index ", highestHigh.index,
                " and Lowest Low = ", lowestLow.price,
                " at index ", lowestLow.index);

      }
  } else {
      // Extend the range if the current bar's prices remain within the range
      ExtendRangeIfWithinLimits();
  }
}
On every new bar that forms, we check for consolidation or extend the existing range if no breakout has been detected. If "highestHigh.price" and "lowestLow.price" are both zero, it means no consolidation range has been established yet. We then call the "IsConsolidationEqualHighsAndLows" function to check if the last "rangeCandles" form a consolidation within the allowed "maxDeviation". If confirmed, we use the "GetHighestHigh" and "GetLowestLow" functions to determine the exact highest and lowest prices within the range, storing their values along with their respective bar indices.
If a range is already established, we ensure that the current bar remains within the defined limits by calling the "ExtendRangeIfWithinLimits" function. This function helps dynamically adjust the range as long as no breakout occurs. Here is the implementation of the custom functions code snippets.
// Function to detect consolidation where both highs and lows are nearly equal
bool IsConsolidationEqualHighsAndLows(int rangeCandles, double maxDeviation, int startingIndex) {
    // Loop through the last `rangeCandles` to check if highs and lows are nearly equal
    for (int i = startingIndex; i < startingIndex + rangeCandles - 1; i++) {
        // Compare the high of the current candle with the next one
        if (MathAbs(high(i) - high(i + 1)) > maxDeviation * Point()) {
            return false; // If the high difference is greater than allowed, it's not a consolidation
        }

        // Compare the low of the current candle with the next one
        if (MathAbs(low(i) - low(i + 1)) > maxDeviation * Point()) {
            return false; // If the low difference is greater than allowed, it's not a consolidation
        }
    }

    // If both highs and lows are nearly equal, it's a consolidation range
    return true;
}
We define a boolean "IsConsolidationEqualHighsAndLows" function which is responsible for detecting consolidation by verifying whether the highs and lows of the last "rangeCandles" are nearly equal within a specified "maxDeviation". We achieve this by iterating over each bar, starting from "startingIndex", and comparing the highs and lows of consecutive candles.
Inside the for loop, we use the MathAbs function to calculate the absolute difference between the high of the current bar ("high(i)") and the next high. If this difference exceeds the maximum deviation converted to point form, Point, the function immediately returns false, indicating that the highs are not equal enough to be considered a consolidation. Similarly, we apply the MathAbs function again to compare the lows of consecutive bars ("low(i)" and "low(i + 1)"), ensuring the lows are also within the allowed deviation. If any check fails, the function exits early with false. If all highs and lows remain within the acceptable deviation, we return true, confirming a valid consolidation range. The next functions that we define are the ones responsible for retrieving the highest and lowest bar prices.
// Function to get the highest high and its index in the last `rangeCandles` candles, starting from `startingIndex`
void GetHighestHigh(int rangeCandles, int startingIndex, PriceIndex &highestHighRef) {
    highestHighRef.price = high(startingIndex); // Start by assuming the first candle's high is the highest
    highestHighRef.index = startingIndex;       // The index of the highest high (starting with the `startingIndex`)

    // Loop through the candles and find the highest high and its index
    for (int i = startingIndex + 1; i < startingIndex + rangeCandles; i++) {
        if (high(i) > highestHighRef.price) {
            highestHighRef.price = high(i); // Update highest high
            highestHighRef.index = i;       // Update index of highest high
        }
    }
}

// Function to get the lowest low and its index in the last `rangeCandles` candles, starting from `startingIndex`
void GetLowestLow(int rangeCandles, int startingIndex, PriceIndex &lowestLowRef) {
    lowestLowRef.price = low(startingIndex); // Start by assuming the first candle's low is the lowest
    lowestLowRef.index = startingIndex;      // The index of the lowest low (starting with the `startingIndex`)

    // Loop through the candles and find the lowest low and its index
    for (int i = startingIndex + 1; i < startingIndex + rangeCandles; i++) {
        if (low(i) < lowestLowRef.price) {
            lowestLowRef.price = low(i); // Update lowest low
            lowestLowRef.index = i;      // Update index of lowest low
        }
    }
}
The "GetHighestHigh" function is responsible for identifying the highest high and its corresponding index within the last "rangeCandles" bars, starting from "startingIndex". We initialize "highestHighRef.price" with the high of the first candle in the range ("high(startingIndex)") and set "highestHighRef.index" to "startingIndex". Then, we iterate through the remaining candles in the specified range, checking if any of them have a higher price than the current "highestHighRef.price". If a new highest high is found, we update both "highestHighRef.price" and "highestHighRef.index". This function helps us determine the upper boundary of a consolidation range.
Similarly, the "GetLowestLow" function finds the lowest low and its index within the same range. We initialize "lowestLowRef.price" with "low(startingIndex)" and "lowestLowRef.index" with "startingIndex". As we loop through the candles, we check if any have a lower price than the current "lowestLowRef.price". If so, we update both "lowestLowRef.price" and "lowestLowRef.index". This function determines the lower boundary of a consolidation range. Finally, we have the function that will extend the range.
// Function to extend the range if the latest bar remains within the range limits
void ExtendRangeIfWithinLimits() {
    double currentHigh = high(1); // Get the high of the latest closed bar
    double currentLow = low(1);   // Get the low of the latest closed bar

    if (currentHigh <= highestHigh.price && currentLow >= lowestLow.price) {
        // Extend the range if the current bar is within the established range
        Print("Range extended: Including candle with High = ", currentHigh, " and Low = ", currentLow);
    } else {
        Print("No extension possible. The current bar is outside the range.");
    }
}
Here, the "ExtendRangeIfWithinLimits" function ensures that the previously identified consolidation range remains valid if new bars continue to fall within its boundaries. We first retrieve the high and low of the most recently closed candle using "high(1)" and "low(1)" functions. Then, we check if the "currentHigh" is less than or equal to "highestHigh.price" and if "currentLow" is greater than or equal to "lowestLow.price". If both conditions are met, the range is extended, and we print a confirmation message indicating that the new candle is included within the existing range.
Otherwise, if the new candle moves outside the established range, no extension occurs, and we print a message stating that the range cannot be extended. This function plays a key role in maintaining valid consolidation zones and prevents unnecessary breakout detection if the market remains within the predefined range.
We did use predefined functions as well responsible for retrieving bar price data. Here is their code snippets.
//--- One-line functions to access price data
double high(int index) { return iHigh(_Symbol, _Period, index); }
double low(int index) { return iLow(_Symbol, _Period, index); }
double open(int index) { return iOpen(_Symbol, _Period, index); }
double close(int index) { return iClose(_Symbol, _Period, index); }
datetime time(int index) { return iTime(_Symbol, _Period, index); }
These one-line functions "high", "low", "open", "close", and "time" serve as simple wrappers for retrieving price and time data of historical bars. Each function calls the respective MQL5 built-in function—iHigh, iLow, iOpen, iClose, and iTime—to fetch the requested value for a given "index". The "high" function returns the high price of a specific bar, while the "low" function returns the low price. Similarly, "open" retrieves the opening price, and "close" fetches the closing price. The "time" function returns the timestamp of the bar. We use them to improve code readability and allow for cleaner, more structured access to historical data throughout our program.
Armed with the functions, we can now check for breakouts if a consolidation range is established via the following code snippet.
// Check for breakout if a consolidation range is established
if (highestHigh.price > 0 && lowestLow.price > 0) {
  breakoutDetected = CheckRangeBreak(highestHigh, lowestLow);
}
Here, if a consolidation range is established, we check for range breakout using a custom function again called "CheckRangeBreak", and store the result in the "breakoutDetected" variable. The function implementation is as below.
// Function to check for range breaks
bool CheckRangeBreak(PriceIndex &highestHighRef, PriceIndex &lowestLowRef) {
    double closingPrice = close(1); // Get the closing price of the current candle

    if (closingPrice > highestHighRef.price) {
        Print("Range break upwards detected. Closing price ", closingPrice, " is above the highest high: ", highestHighRef.price);
        return true; // Breakout detected
    } else if (closingPrice < lowestLowRef.price) {
        Print("Range break downwards detected. Closing price ", closingPrice, " is below the lowest low: ", lowestLowRef.price);
        return true; // Breakout detected
    }
    return false; // No breakout
}
For the boolean "CheckRangeBreak" function, we compare the "closingPrice" of the current candle to the "highestHighRef.price" and "lowestLowRef.price". If the "closingPrice" is higher than the "highestHighRef.price", we detect an upward breakout. If it’s lower than the "lowestLowRef.price", we detect a downward breakout. In both cases, we return "true" and print the breakout direction. If neither condition is met, we return "false".
We can now use the variable to detect a breakout where we need to reset the range state to get ready for a next possible consolidation range as follows.
// Reset state after breakout
if (breakoutDetected) {
  Print("Breakout detected. Resetting for the next range.");

  breakoutBarIndex = 1; // Use the current bar's index (index 1 refers to the most recent completed bar)
  breakoutTime = TimeCurrent();
  impulseHigh = highestHigh.price;
  impulseLow = lowestLow.price;

  breakoutDetected = false;
  highestHigh.price = 0;
  highestHigh.index = 0;

  lowestLow.price = 0;
  lowestLow.index = 0;
}
After a breakout is detected, we reset the state for the next range. We set "breakoutBarIndex" to 1, referring to the most recent completed bar. We also update "breakoutTime" with the current time using the "TimeCurrent" function. The "impulseHigh" and "impulseLow" are set to the previous range's "highestHigh.price" and "lowestLow.price". We then mark "breakoutDetected" as "false", and reset both "highestHigh" and "lowestLow" prices and indices to 0, preparing for the next range detection. We can now proceed to check for valid order blocks based on impulsive movement.
if (breakoutBarIndex >= 0 && TimeCurrent() > breakoutTime + waitBars * PeriodSeconds()) {
  DetectImpulsiveMovement(impulseHigh,impulseLow,waitBars,1);

   bool is_OB_Valid = is_OB_DOWN || is_OB_UP;

   datetime time1 = iTime(_Symbol,_Period,rangeCandles+waitBars+1);
   double price1 = impulseHigh;

   int visibleBars = (int)ChartGetInteger(0,CHART_VISIBLE_BARS);
   datetime time2 = is_OB_Valid ? time1 + (visibleBars/1)*PeriodSeconds() : time(waitBars+1);

   double price2 = impulseLow;
   string obNAME = OB_Prefix+"("+TimeToString(time1)+")";
   color obClr = clrBlack;

   if (is_OB_Valid){obClr = is_OB_UP ? CLR_UP : CLR_DOWN;}
   else if (!is_OB_Valid){obClr = clrBlue;}

   string obText = "";

   if (is_OB_Valid){obText = is_OB_UP ? "Bullish Order Block"+ShortToString(0x2BED) : "Bearish Order Block"+ShortToString(0x2BEF);}
   else if (!is_OB_Valid){obText = "Range";}

   //---

}
Here, we first check if the "breakoutBarIndex" is greater than or equal to 0 and if the current time is greater than the "breakoutTime" plus a wait period, calculated by multiplying "waitBars" with the period in seconds (using PeriodSeconds function). If this condition is met, we call the function "DetectImpulsiveMovement" to identify impulsive market movements, passing the values of "impulseHigh", "impulseLow", "waitBars", and a fixed parameter of 1.
We then validate the order block by checking if either "is_OB_DOWN" or "is_OB_UP" is true, storing the result in "is_OB_Valid". We retrieve the timestamp of the bar with iTime, which gives the time of a specific bar on the symbol and period, and store it in "time1". The price of this bar is stored in "impulseHigh", which we use for further calculations. Next, we get the number of visible bars on the chart using the ChartGetInteger function with the parameter CHART_VISIBLE_BARS, which returns how many bars are visible on the chart. We then calculate "time2", which depends on whether the order block is valid. If "is_OB_Valid" is true, we adjust the time by adding the visible bars to "time1", multiplied by the period in seconds. Otherwise, we use the time of the next bar, determined by "time(waitBars+1)". We determine this using a Ternary operator.
The "price2" is set to "impulseLow". Then, we generate the order block name using "OB_Prefix" along with the formatted time using the TimeToString function. The color for the order block is set using the "obClr" variable, which is black by default. If the order block is valid, we set the color to either "CLR_UP" (for an upward order block) or "CLR_DOWN" (for a downward order block). If the order block is invalid, the color is set to blue.
The order block text, stored in "obText", is set based on the order block direction. If the order block is valid, we display "Bullish Order Block" or "Bearish Order Block" with unique Unicode character codes (0x2BED for bullish, 0x2BEF for bearish), which we convert using the "ShortToString" function. If not, we label it as "Range". These Unicode symbols are as below.
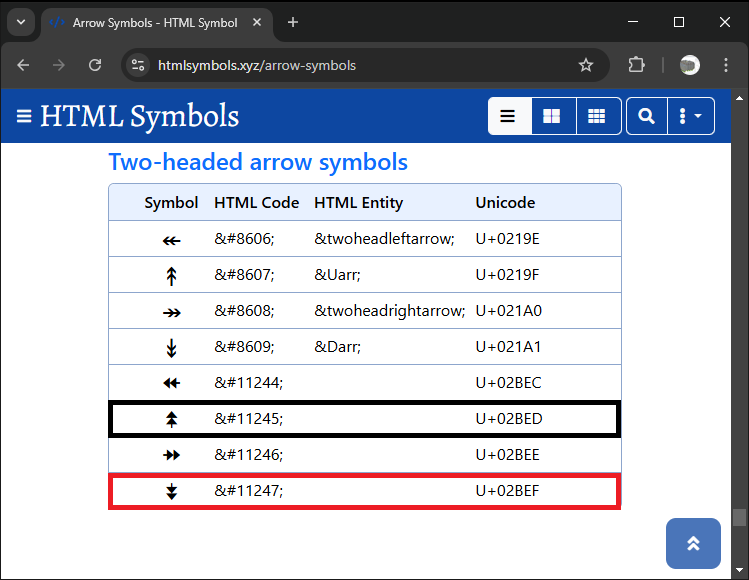
The function to detect impulsive movements is as below.
// Function to detect impulsive movement after breakout
void DetectImpulsiveMovement(double breakoutHigh, double breakoutLow, int impulseBars, double impulseThreshold) {
    double range = breakoutHigh - breakoutLow;         // Calculate the breakout range
    double impulseThresholdPrice = range * impulseThreshold; // Threshold for impulsive move

    // Check for the price movement in the next `impulseBars` bars after breakout
    for (int i = 1; i <= impulseBars; i++) {
        double closePrice = close(i); // Get the close price of the bar

        // Check if the price moves significantly beyond the breakout high
        if (closePrice >= breakoutHigh + impulseThresholdPrice) {
            is_OB_UP = true;
            Print("Impulsive upward movement detected: Close Price = ", closePrice,
                  ", Threshold = ", breakoutHigh + impulseThresholdPrice);
            return;
        }
        // Check if the price moves significantly below the breakout low
        else if (closePrice <= breakoutLow - impulseThresholdPrice) {
            is_OB_DOWN = true;
            Print("Impulsive downward movement detected: Close Price = ", closePrice,
                  ", Threshold = ", breakoutLow - impulseThresholdPrice);
            return;
        }
    }

    // If no impulsive movement is detected
    is_OB_UP = false;
    is_OB_DOWN = false;
    Print("No impulsive movement detected after breakout.");
}
In the function, to detect if the price moves impulsively after a breakout, we first calculate the "range" by subtracting the "breakoutLow" from the "breakoutHigh". The "impulseThresholdPrice" is determined by multiplying the range by the "impulseThreshold" value, which defines how far the price should move to be considered impulsive. We then check the price movement in the next "impulseBars" bars using a for loop.
For each bar, we get the "closePrice" using the "close(i)" function, which retrieves the closing price of the i-th bar. If the closing price exceeds the "breakoutHigh" by at least the "impulseThresholdPrice", we consider this an impulsive upward movement, setting "is_OB_UP" to true and printing the detected movement. Similarly, if the closing price falls below the "breakoutLow" by at least the "impulseThresholdPrice", we detect an impulsive downward movement, setting "is_OB_DOWN" to true and printing the result.
If no significant price movement is detected after checking all the bars, both "is_OB_UP" and "is_OB_DOWN" are set to false, and we print that no impulsive movement was detected. Now, we can plot the ranges on the chart as well as the order blocks as follows.
if (!is_OB_Valid){
   if (ObjectFind(0,obNAME) < 0){
      CreateRec(obNAME,time1,price1,time2,price2,obClr,obText);
   }
}
else if (is_OB_Valid){
   if (ObjectFind(0,obNAME) < 0){
      CreateRec(obNAME,time1,price1,time2,price2,obClr,obText);

      Print("Old ArraySize = ",ArraySize(totalOBs_names));
      ArrayResize(totalOBs_names,ArraySize(totalOBs_names)+1);
      Print("New ArraySize = ",ArraySize(totalOBs_names));
      totalOBs_names[ArraySize(totalOBs_names)-1] = obNAME;
      ArrayPrint(totalOBs_names);

      Print("Old ArraySize = ",ArraySize(totalOBs_dates));
      ArrayResize(totalOBs_dates,ArraySize(totalOBs_dates)+1);
      Print("New ArraySize = ",ArraySize(totalOBs_dates));
      totalOBs_dates[ArraySize(totalOBs_dates)-1] = time2;
      ArrayPrint(totalOBs_dates);

      Print("Old ArraySize = ",ArraySize(totalOBs_is_signals));
      ArrayResize(totalOBs_is_signals,ArraySize(totalOBs_is_signals)+1);
      Print("New ArraySize = ",ArraySize(totalOBs_is_signals));
      totalOBs_is_signals[ArraySize(totalOBs_is_signals)-1] = false;
      ArrayPrint(totalOBs_is_signals);

   }
}

breakoutBarIndex = -1; // Use the current bar's index (index 1 refers to the most recent completed bar)
breakoutTime = 0;
impulseHigh = 0;
impulseLow = 0;
is_OB_UP = false;
is_OB_DOWN = false;
Here, we check if the order block ("is_OB_Valid") is valid. If it is not valid, we use the function ObjectFind to determine if an object with the name "obNAME" already exists on the chart. If the object is not found (the function returns a negative value), we call "CreateRec" to create the order block on the chart using the provided parameters such as time, price, color, and text.
If the order block is valid, we again check if the object exists. If not, we create it and then manage the order block data by resizing using the function ArrayResize and updating our three arrays: "totalOBs_names" to store the order block names, "totalOBs_dates" for the timestamps, and "totalOBs_is_signals" to store whether each order block is a valid signal (initially set to false). After resizing the arrays, we print the old and new array sizes with ArraySize and display the array contents using the ArrayPrint function. Finally, we reset the breakout state by setting "breakoutBarIndex" to -1, resetting "breakoutTime", "impulseHigh", and "impulseLow" to 0, and setting the order block direction flags, "is_OB_UP" and "is_OB_DOWN", to false.
To create the rectangles with text, we used a custom function "CreateRec" as follows.
void CreateRec(string objName,datetime time1,double price1,
               datetime time2,double price2,color clr,string txt){
   if (ObjectFind(0,objName) < 0){
      ObjectCreate(0,objName,OBJ_RECTANGLE,0,time1,price1,time2,price2);

      Print("SUCCESS CREATING OBJECT >",objName,"< WITH"," T1: ",time1,", P1: ",price1,
            ", T2: ",time2,", P2: ",price2);

      ObjectSetInteger(0,objName,OBJPROP_TIME,0,time1);
      ObjectSetDouble(0,objName,OBJPROP_PRICE,0,price1);
      ObjectSetInteger(0,objName,OBJPROP_TIME,1,time2);
      ObjectSetDouble(0,objName,OBJPROP_PRICE,1,price2);
      ObjectSetInteger(0,objName,OBJPROP_FILL,true);
      ObjectSetInteger(0,objName,OBJPROP_COLOR,clr);
      ObjectSetInteger(0,objName,OBJPROP_BACK,false);

    // Calculate the center position of the rectangle
    datetime midTime = time1 + (time2 - time1) / 2;
    double midPrice = (price1 + price2) / 2;

    // Create a descriptive text label centered in the rectangle
    string description = txt;
    string textObjName = objName + description; // Unique name for the text object
    if (ObjectFind(0, textObjName) < 0) {
        ObjectCreate(0, textObjName, OBJ_TEXT, 0, midTime, midPrice);
        ObjectSetString(0, textObjName, OBJPROP_TEXT, description);
        ObjectSetInteger(0, textObjName, OBJPROP_COLOR, clrBlack);
        ObjectSetInteger(0, textObjName, OBJPROP_FONTSIZE, 15);
        ObjectSetInteger(0, textObjName, OBJPROP_ANCHOR, ANCHOR_CENTER);

        Print("SUCCESS CREATING LABEL >", textObjName, "< WITH TEXT: ", description);
    }

      ChartRedraw(0);
   }
}
In the "CreateRec" function that we define, we check if the object "objName" exists using the ObjectFind function. If not, we create a rectangle with the given time and price points using the ObjectCreate function, defined by OBJ_RECTANGLE, and set its properties (e.g., color, fill, visibility) using ObjectSetInteger and ObjectSetDouble. We calculate the center position of the rectangle and create a label in the middle using ObjectCreate for text, defined by OBJ_TEXT, setting its properties (text, color, size, anchor). Finally, we call the ChartRedraw function to update the chart. If the object or label already exists, no action is taken.
With the order blocks plotted, we can now graduate to determining if we retest them and open positions when the price enters and breaks outside their ranges.
for (int j=ArraySize(totalOBs_names)-1; j>=0; j--){
   string obNAME = totalOBs_names[j];
   bool obExist = false;
   //Print("name = ",fvgNAME," >",ArraySize(totalFVGs)," >",j);
   //ArrayPrint(totalFVGs);
   //ArrayPrint(barTIMES);
   double obHigh = ObjectGetDouble(0,obNAME,OBJPROP_PRICE,0);
   double obLow = ObjectGetDouble(0,obNAME,OBJPROP_PRICE,1);
   datetime objTime1 = (datetime)ObjectGetInteger(0,obNAME,OBJPROP_TIME,0);
   datetime objTime2 = (datetime)ObjectGetInteger(0,obNAME,OBJPROP_TIME,1);
   color obColor = (color)ObjectGetInteger(0,obNAME,OBJPROP_COLOR);

   if (time(1) < objTime2){
      //Print("FOUND: ",obNAME," @ bar ",j,", H: ",obHigh,", L: ",obLow);
      obExist = true;
   }

   double Ask = NormalizeDouble(SymbolInfoDouble(_Symbol,SYMBOL_ASK),_Digits);
   double Bid = NormalizeDouble(SymbolInfoDouble(_Symbol,SYMBOL_BID),_Digits);

   if (obColor == CLR_UP && Ask > obHigh && close(1) > obHigh && open(1) < obHigh && !totalOBs_is_signals[j]){
      Print("BUY SIGNAL For (",obNAME,") Now @ ",Ask);
      double sl = Bid - 1500*_Point;
      double tp = Bid + 1500*_Point;
      obj_Trade.Buy(0.01,_Symbol,Ask,sl,tp);
      totalOBs_is_signals[j] = true;
      ArrayPrint(totalOBs_names,_Digits," [< >] ");
      ArrayPrint(totalOBs_is_signals,_Digits," [< >] ");
   }
   else if (obColor == CLR_DOWN && Bid < obLow && close(1) < obLow && open(1) > obLow && !totalOBs_is_signals[j]){
      Print("SELL SIGNAL For (",obNAME,") Now @ ",Bid);
      double sl = Ask  + 1500*_Point;
      double tp = Ask - 1500*_Point;
      obj_Trade.Sell(0.01,_Symbol,Bid,sl,tp);
      totalOBs_is_signals[j] = true;
      ArrayPrint(totalOBs_names,_Digits," [< >] ");
      ArrayPrint(totalOBs_is_signals,_Digits," [< >] ");
   }

   if (obExist == false){
      bool removeName = ArrayRemove(totalOBs_names,0,1);
      bool removeTime = ArrayRemove(totalOBs_dates,0,1);
      bool remove_isSignal = ArrayRemove(totalOBs_is_signals,0,1);
      if (removeName && removeTime && remove_isSignal){
         Print("Success removing the OB DATA from arrays. New Data as below:");
         Print("Total Sizes => OBs: ",ArraySize(totalOBs_names),", TIMEs: ",ArraySize(totalOBs_dates),", SIGNALs: ",ArraySize(totalOBs_is_signals));
         ArrayPrint(totalOBs_names);
         ArrayPrint(totalOBs_dates);
         ArrayPrint(totalOBs_is_signals);
      }
   }
}
Here, we loop through the "totalOBs_names" array to process each order block ("obNAME"). We retrieve the order block's high and low prices, timestamps, and color using ObjectGetDouble and ObjectGetInteger functions. We then check if the current time is earlier than the order block’s end time. If the time condition is met, we proceed to check for buy or sell signals based on the order block's color and price conditions. If the conditions are satisfied, we execute a buy or sell trade using the "obj_Trade.Buy" or "obj_Trade.Sell" functions, and update the "totalOBs_is_signals" array to mark the order block as having triggered a signal, so we don't trade it again in case the price retraces.
If an order block does not meet the time condition, we remove it from the arrays "totalOBs_names", "totalOBs_dates", and "totalOBs_is_signals" using the ArrayRemove function. If the removal is successful, we print updated array sizes and contents. Here is the current milestone that we have achieved.
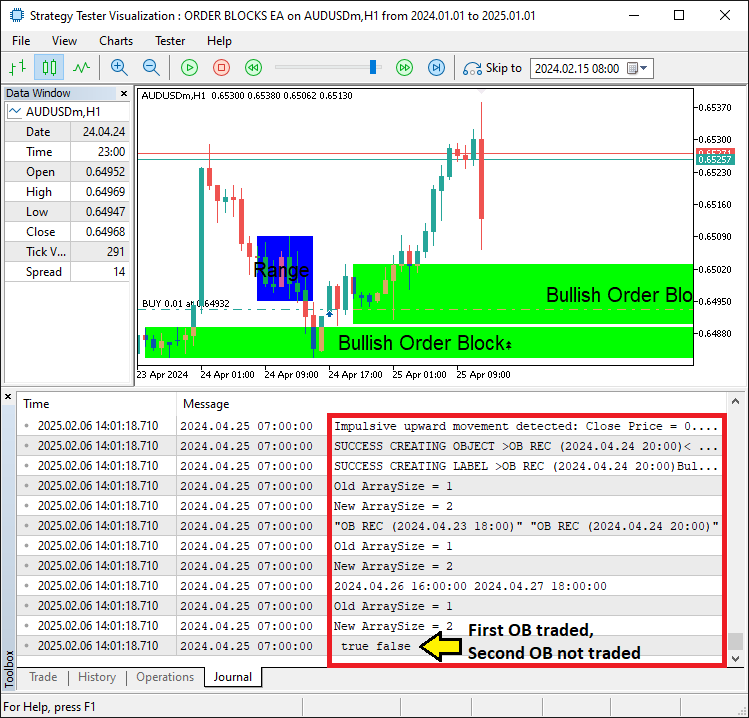
From the image, we can see that the order blocks are detected and traded, achieving our objective, and what remains is to backtest the program and analyze its performance. This is handled in the next section.
Backtesting and Optimization
After thorough backtesting, we have the following results.
Backtest graph:
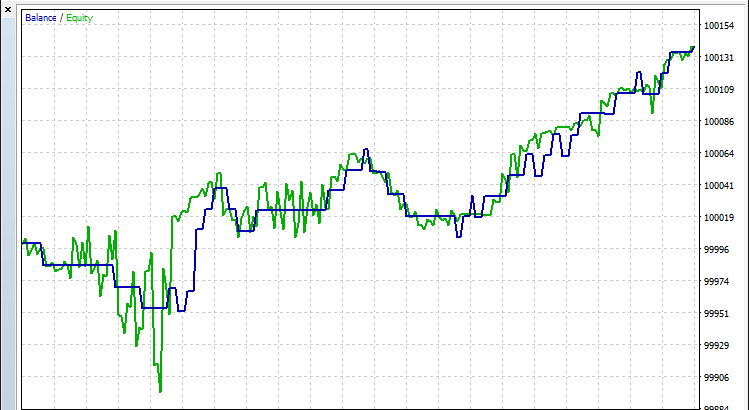
Backtest report:
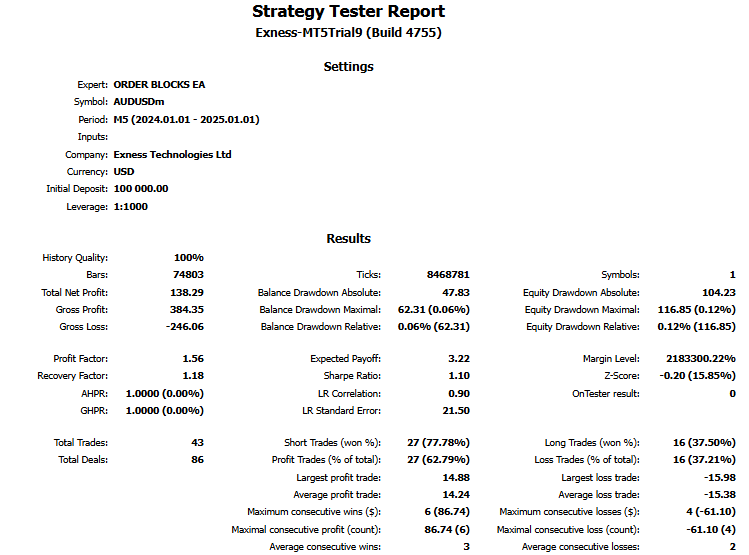
Here is also a video format showcasing the whole strategy backtest within a period of 1 year, 2024.
Conclusion
In conclusion, we have demonstrated the process of developing a sophisticated MQL5 Expert Advisor (EA) that leverages Order Block detection for smart money trading strategies. By incorporating tools such as dynamic range analysis, price action, and real-time breakout detection, we created a program that can identify key support and resistance levels, generate actionable trade signals, and manage orders with high precision.
Disclaimer: This article is intended for educational purposes only. Trading carries substantial financial risk, and market behavior can be highly unpredictable. The strategies outlined in this article offer a structured approach but do not guarantee future profitability. Proper testing and risk management are essential before live trading.
By applying these methods, you can build more effective trading systems, refine your approach to market analysis, and take your algorithmic trading to the next level. Best of luck in your trading journey!
 Mastering Log Records (Part 5): Optimizing the Handler with Cache and Rotation
 Neural Networks in Trading: Lightweight Models for Time Series Forecasting
 Robustness Testing on Expert Advisors
 Price Action Analysis Toolkit Development (Part 12): External Flow (III) TrendMap
- Free trading apps
- Over 8,000 signals for copying
- Economic news for exploring financial markets
You agree to website policy and terms of use