Automating Trading Strategies in MQL5 (Part 5): Developing the Adaptive Crossover RSI Trading Suite Strategy
Introduction
In the previous article (Part 4 of the series), we introduced the Multi-Level Zone Recovery System, showcasing how to extend Zone Recovery principles to manage multiple independent trade setups simultaneously in MetaQuotes Language 5 (MQL5). In this article (Part 5), we take a new direction with the Adaptive Crossover RSI Trading Suite Strategy, a comprehensive system designed to identify and act on high-probability trading opportunities. This strategy combines two critical technical analysis tools—Adaptive Moving Average crossovers (14-period and 50-period) as the core signal generator and a 14-period Relative Strength Indicator (RSI) as a filter for confirmation.
Additionally, it employs a trading day filter to exclude low-probability trading sessions, ensuring better accuracy and performance. To enhance usability, the system visualizes confirmed trade signals directly on the chart by drawing arrows and annotating them with clear signal descriptions. A dashboard is also included to provide a real-time summary of the strategy’s status, key metrics, and signal activity, offering traders a complete overview at a glance. This article will guide you through the step-by-step process of developing this strategy, from outlining the blueprint to implementing it in MQL5, backtesting its performance, and analyzing the results. We will structure this via the following topics:
- Strategy Blueprint
- Implementation in MQL5
- Backtesting
- Conclusion
By the end, you will have a practical understanding of how to create an adaptive, filter-based trading system and refine it for robust performance across various market conditions. Let's get started.
Strategy Blueprint
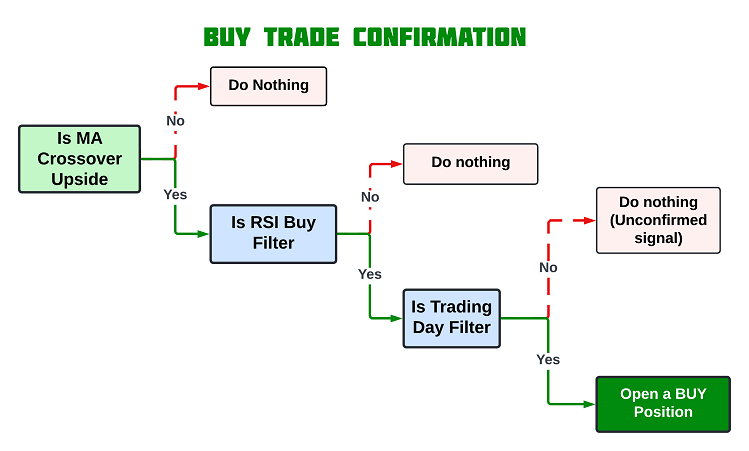
The Adaptive Crossover RSI Trading Suite Strategy is built on a foundation of moving average crossovers and momentum confirmation, creating a balanced approach to trading. The core signals will be derived from the interaction between a 14-period fast-moving average and a 50-period slow-moving average. A buy signal will occur when the fast-moving average crosses above the slow-moving average, suggesting a bullish trend, while a sell signal will be generated when the fast-moving average crosses below the slow-moving average, indicating a bearish trend.
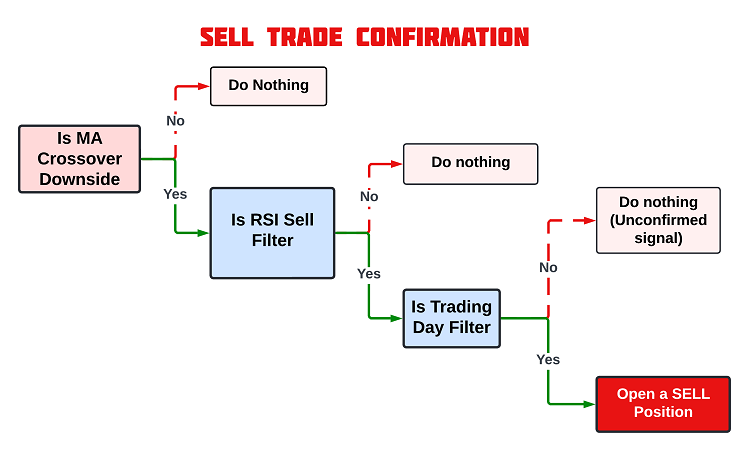
To enhance the accuracy of these signals, a 14-period Relative Strength Index (RSI) will be employed as a confirmation filter. The RSI will ensure that trades align with prevailing market momentum, reducing the likelihood of entering trades in overbought or oversold conditions. For instance, a buy signal will only be validated if the RSI is above a threshold of 50, while a sell signal will require the RSI to be below its corresponding threshold. The strategy will also incorporate a trading day filter to optimize performance by avoiding trades on days with historically low volatility or poor performance. This filter will ensure that the system focuses only on high-probability trading opportunities. In a nutshell, the strategy blueprint is as follows.
Sell Trade Confirmation Blueprint:
Buy Trade Confirmation Blueprint:
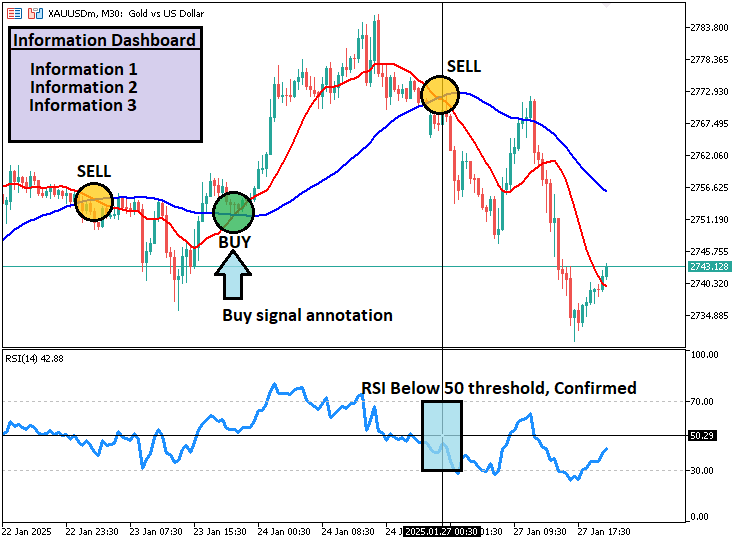
Also, once a trade is confirmed, the system will mark the chart with signal arrows and annotations, clearly identifying the entry points. A dashboard will provide real-time updates, offering a snapshot of signal activity, key metrics, and the overall status of the system. This structured and adaptive approach will ensure the strategy is robust and user-friendly. The final outlook will depict the one visualized below.
Implementation in MQL5
After learning all the theories about the Adaptive Crossover RSI Trading Suite strategy, let us then automate the theory and craft an Expert Advisor (EA) in MetaQuotes Language 5 (MQL5) for MetaTrader 5.
To create an expert advisor (EA), on your MetaTrader 5 terminal, click the Tools tab and check MetaQuotes Language Editor, or simply press F4 on your keyboard. Alternatively, you can click the IDE (Integrated Development Environment) icon on the tools bar. This will open the MetaQuotes Language Editor environment, which allows the writing of trading robots, technical indicators, scripts, and libraries of functions. Once the MetaEditor is opened, on the tools bar, navigate to the File tab and check New File, or simply press CTRL + N, to create a new document. Alternatively, you can click on the New icon on the tools tab. This will result in a MQL Wizard pop-up.
On the Wizard that pops, check Expert Advisor (template) and click Next. On the general properties of the Expert Advisor, under the name section, provide your expert's file name. Note that to specify or create a folder if it doesn't exist, you use the backslash before the name of the EA. For example, here we have "Experts\" by default. That means that our EA will be created in the Experts folder and we can find it there. The other sections are pretty much straightforward, but you can follow the link at the bottom of the Wizard to know how to precisely undertake the process.
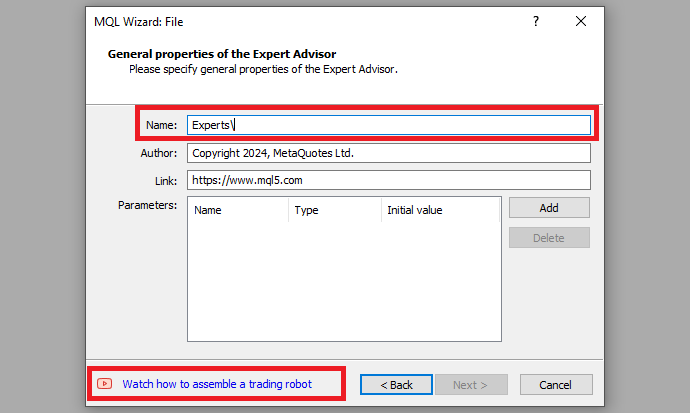
After providing your desired Expert Advisor file name, click on Next, click Next, and then click Finish. After doing all that, we are now ready to code and program our strategy.
First, we start by defining some metadata about the Expert Advisor (EA). This includes the name of the EA, the copyright information, and a link to the MetaQuotes website. We also specify the version of the EA, which is set to "1.00".
//+------------------------------------------------------------------+
//|                         Adaptive Crossover RSI Trading Suite.mq5 |
//|                                  Copyright 2025, MetaQuotes Ltd. |
//|                                             https://www.mql5.com |
//+------------------------------------------------------------------+
#property copyright "Forex Algo-Trader, Allan"
#property link      "https://t.me/Forex_Algo_Trader"
#property version   "1.00"
#property description "EA that trades based on MA Crossover, RSI + Day Filter"
#property strict
This will display the system metadata when loading the program. We can then move on to adding some global variables that we will use within the program. First, we include a trade instance by using #include at the beginning of the source code. This gives us access to the "CTrade class", which we will use to create a trade object. This is crucial as we need it to open trades.
#include <Trade/Trade.mqh>
CTrade obj_Trade;
The preprocessor will replace the line #include <Trade/Trade.mqh> with the content of the file Trade.mqh. Angle brackets indicate that the Trade.mqh file will be taken from the standard directory (usually it is terminal_installation_directory\MQL5\Include). The current directory is not included in the search. The line can be placed anywhere in the program, but usually, all inclusions are placed at the beginning of the source code, for a better code structure and easier reference. Declaration of the "obj_Trade" object of the CTrade class will give us access to the methods contained in that class easily, thanks to the MQL5 developers.
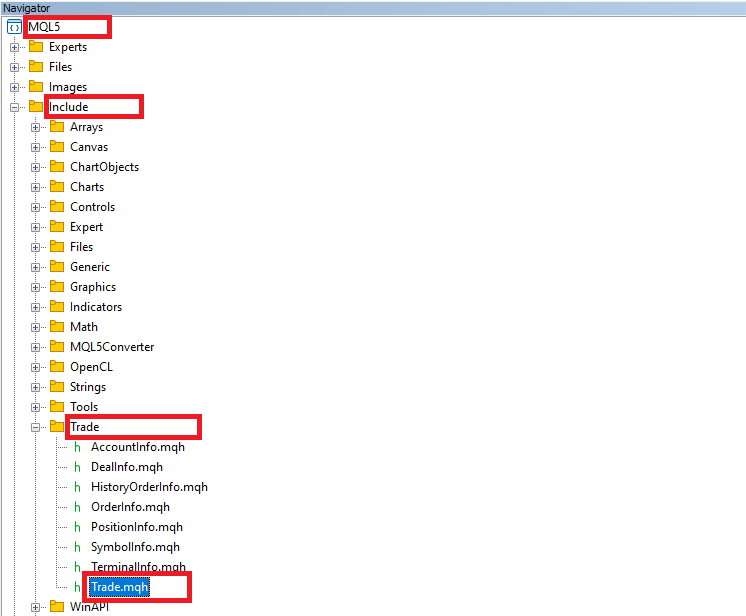
After that, we need to declare several important input variables that will allow the user to change the trading values to the desired ones without altering the code itself. To attain that, we organize the inputs into groups for clarity, that is, general, indicator, and filter settings.
sinput group "GENERAL SETTINGS"
sinput double inpLots = 0.01; // LotSize
input int inpSLPts = 300; // Stoploss Points
input double inpR2R = 1.0; // Risk to Reward Ratio
sinput ulong inpMagicNo = 1234567; // Magic Number
input bool inpisAllowTrailingStop = true; // Apply Trailing Stop?
input int inpTrailPts = 50; // Trailing Stop Points
input int inpMinTrailPts = 50; // Minimum Trailing Stop Points

sinput group "INDICATOR SETTINGS"
input int inpMA_Fast_Period = 14; // Fast MA Period
input ENUM_MA_METHOD inpMA_Fast_Method = MODE_EMA; // Fast MA Method
input int inpMA_Slow_Period = 50; // Slow MA Period
input ENUM_MA_METHOD inpMA_Slow_Method = MODE_EMA; // Slow MA Method

sinput group "FILTER SETTINGS"
input ENUM_TIMEFRAMES inpRSI_Tf = PERIOD_CURRENT; // RSI Timeframe
input int inpRSI_Period = 14; // RSI Period
input ENUM_APPLIED_PRICE inpRSI_Applied_Price = PRICE_CLOSE; // RSI Application Price
input double inpRsiBUYThreshold = 50; // BUY Signal Threshold
input double inpRsiSELLThreshold = 50; // SELL Signal Threshold

input bool Sunday = false; // Trade on Sunday?
input bool Monday = false; // Trade on Monday?
input bool Tuesday = true; // Trade on Tuesday?
input bool Wednesday = true; // Trade on Wednesday?
input bool Thursday = true; // Trade on Thursday?
input bool Friday = false; // Trade on Friday?
input bool Saturday = false; // Trade on Saturday?
Here, we define the core parameters and configurations for the Adaptive Crossover RSI Trading Suite program, enabling precise control over its behavior. We divide these settings into three main groups: "GENERAL SETTINGS," "INDICATOR SETTINGS," and "FILTER SETTINGS," along with specific controls for trading days. The use of variable types and enumerations enhances flexibility and clarity in the system's design.
In the "GENERAL SETTINGS" group, we define trade management parameters. We use the keyword input for optimizable parameters and sinput for string or non-optimizable parameters. The variable "inpLots" specifies the trade's lot size, while "inpSLPts" set the stop-loss level in points, ensuring risk is controlled for each trade. The "inpR2R" variable establishes the desired risk-to-reward ratio, maintaining a favorable balance between risk and potential reward. A unique trade identifier is assigned using "inpMagicNo", which the program uses to differentiate its orders. Trailing stop functionality is managed using "inpisAllowTrailingStop", enabling users to activate or deactivate it. The "inpTrailPts" and "inpMinTrailPts" variables specify the trailing stop distance and the minimum activation threshold, respectively, ensuring that trailing stops align with market conditions.
In the "INDICATOR SETTINGS" group, we configure the parameters for moving averages, which form the backbone of signal generation. The fast-moving average's period is defined by "inpMA_Fast_Period", and its calculation method is chosen using the enumeration ENUM_MA_METHOD with variable "inpMA_Fast_Method", which supports options such as MODE_SMA, MODE_EMA, MODE_SMMA, and MODE_LWMA. Similarly, the slow-moving average is set with "inpMA_Slow_Period", while its method is determined using "inpMA_Slow_Method". These enumerations ensure users can customize the strategy with their preferred moving average types for different market conditions.
The "FILTER SETTINGS" group focuses on the RSI indicator, which serves as a momentum filter. The variable "inpRSI_Tf", defined using the ENUM_TIMEFRAMES enumeration, allows users to select the RSI's timeframe, such as PERIOD_M1, "PERIOD_H1", or "PERIOD_D1". The RSI period is specified with "inpRSI_Period", while "inpRSI_Applied_Price", an ENUM_APPLIED_PRICE enumeration, determines the price data (e.g., "PRICE_CLOSE", "PRICE_OPEN", or "PRICE_MEDIAN") used for calculations. Thresholds for validating buy and sell signals are set using "inpRsiBUYThreshold" and "inpRsiSELLThreshold", ensuring the RSI aligns with market momentum before executing trades.
Lastly, we implement a trading day filter using boolean variables, such as "Sunday", "Monday", and so on, allowing control over the EA's activity on specific days. By disabling trading on less favorable days, the system avoids unnecessary exposure to potentially unprofitable conditions. Afterward, we need to define the indicator handles that we will use.
int handleMAFast = INVALID_HANDLE;
int handleMASlow = INVALID_HANDLE;
int handleRSIFilter = INVALID_HANDLE;
We initialize three key variables—"handleMAFast", "handleMASlow", and "handleRSIFilter"—and set them to INVALID_HANDLE. By doing this, we ensure that our EA starts with a clean and controlled state, avoiding potential issues from uninitialized or invalid indicator handles. We use "handleMAFast" to manage the fast-moving average indicator, which we configure to capture short-term price trends based on the parameters we define.
Similarly, "handleMASlow" is designated to handle the slow-moving average indicator, allowing us to track longer-term price trends. These handles are vital for dynamically retrieving and processing the moving average values needed for our strategy. With "handleRSIFilter", we prepare to connect to the RSI indicator, which we use as a momentum filter to confirm our signals. Next, we will need to define the storage arrays in which we will store the retrieved data from the indicators. This will require three arrays as well.
double bufferMAFast[];
double bufferMASlow[];
double bufferRSIFilter[];
Here, we declare three dynamic arrays: "bufferMAFast[]", "bufferMASlow[]", and "bufferRSIFilter[]". These arrays will serve as storage containers where we will collect and manage the calculated values of the indicators used in our strategy. By organizing the data this way, we ensure that our EA has direct and efficient access to the indicator results during its operation. From here now, we will need to go to the initialization function and create the indicator handles.
//+------------------------------------------------------------------+
//| Expert initialization function                                   |
//+------------------------------------------------------------------+
int OnInit(){
//---

   handleMAFast = iMA(_Symbol,_Period,inpMA_Fast_Period,0,inpMA_Fast_Method,PRICE_CLOSE);
   handleMASlow = iMA(_Symbol,_Period,inpMA_Slow_Period,0,inpMA_Slow_Method,PRICE_CLOSE);

   handleRSIFilter = iRSI(_Symbol,inpRSI_Tf,inpRSI_Period,inpRSI_Applied_Price);

//----

}
Here, we initialize the handles for the indicators we’ll use in the strategy: the fast-moving average, the slow-moving average, and the RSI filter. We begin by initializing the fast-moving average using the function iMA. This function requires several parameters. The first, _Symbol, tells the function to calculate the moving average for the current trading instrument. The second, _Period, specifies the timeframe of the chart (like 1-minute, 1-hour).
We also pass the fast-moving average period ("inpMA_Fast_Period"), which determines how many bars are used to calculate the moving average. The "0" parameter is for the "shift" of the moving average, where "0" means no shift. The moving average method ("inpMA_Fast_Method") specifies whether it’s an Exponential or Simple moving average, and "PRICE_CLOSE" indicates that we are using the closing prices of each bar to calculate the average.
The result of this function is assigned to "handleMAFast", allowing us to access the fast-moving average value for future computations.
Next, we initialize the slow-moving average in the same way by calling the iMA function. Here, we use the same _Symbol, _Period, and the slow-moving average period ("inpMA_Slow_Period"). Again, we specify the method and price ("PRICE_CLOSE") used to calculate this moving average. This value is stored in "handleMASlow" for future use. Finally, we initialize the RSI filter using the function iRSI function. We provide the _Symbol to specify the instrument, the RSI timeframe ("inpRSI_Tf"), the RSI period ("inpRSI_Period"), and the applied price ("inpRSI_Applied_Price"). The result of the function is stored in "handleRSIFilter", which will allow us to use the RSI value to confirm trade signals in the strategy.
Since these handles are the backbone of our strategy, we need to ensure that they are properly initialized, and if not, then there is clearly no point in us continuing to run the program.
if (handleMAFast == INVALID_HANDLE || handleMASlow == INVALID_HANDLE || handleRSIFilter == INVALID_HANDLE){
   Print("ERROR! Unable to create the indicator handles. Reveting Now!");
   return (INIT_FAILED);
}
Here, we check whether the initialization of the indicator handles was successful. We evaluate if any of the handles ("handleMAFast", "handleMASlow", or "handleRSIFilter") are equal to INVALID_HANDLE, which would indicate a failure to create the corresponding indicators. If any of the handles fail, we use the function "Print" to display an error message in the terminal, alerting us to the issue. Finally, we return INIT_FAILED, which halts the EA’s execution if any of the indicator handles are invalid, ensuring that the EA does not continue running under faulty conditions.
Another fault would also occur where the user provides unrealistic periods, technically less than or equal to zero. Thus, we need to check the user-defined input values for the periods of the fast-moving average, slow-moving average, and RSI to ensure that the periods ("inpMA_Fast_Period", "inpMA_Slow_Period", "inpRSI_Period") are greater than zero.
if (inpMA_Fast_Period <= 0 || inpMA_Slow_Period <= 0 || inpRSI_Period <= 0){
   Print("ERROR! Periods cannot be <= 0. Reverting Now!");
   return (INIT_PARAMETERS_INCORRECT);
}
Here, if the user input values are not greater than zero, we terminate the program by returning INIT_PARAMETERS_INCORRECT. If we do pass here, then we have the indicator handles ready and we can set the storage arrays as time series.
ArraySetAsSeries(bufferMAFast,true);
ArraySetAsSeries(bufferMASlow,true);
ArraySetAsSeries(bufferRSIFilter,true);

obj_Trade.SetExpertMagicNumber(inpMagicNo);

Print("SUCCESS INITIALIZATION. ACCOUNT TYPE = ",trading_Account_Mode());
Finally, we perform a few key actions to finalize the initialization process. First, we use the function ArraySetAsSeries to set the arrays ("bufferMAFast", "bufferMASlow", and "bufferRSIFilter") as time series. This is important because it ensures the data within these arrays is stored in a way that is compatible with how MetaTrader handles time series data—storing the most recent data at index 0. By setting each of these arrays as a series, we ensure that the indicators are accessed in the correct order during trading.
Next, we call the method "SetExpertMagicNumber" on the object "obj_Trade", passing the "inpMagicNo" value as the magic number. The magic number is a unique identifier for the EA's trades, ensuring that they can be differentiated from other trades placed manually or by other EAs. Finally, we use the function Print to output a success message in the terminal, confirming that the initialization process has been completed. The message includes the account type, which is retrieved using the function "trading_Account_Mode"—indicating whether the account is a demo or live account. The function responsible for this is as follows.
string trading_Account_Mode(){
   string account_mode;
   switch ((ENUM_ACCOUNT_TRADE_MODE)AccountInfoInteger(ACCOUNT_TRADE_MODE)){
      case ACCOUNT_TRADE_MODE_DEMO:
         account_mode = "DEMO";
         break;
      case ACCOUNT_TRADE_MODE_CONTEST:
         account_mode = "COMPETITION";
         break;
      case ACCOUNT_TRADE_MODE_REAL:
         account_mode = "REAL";
         break;
   }
   return account_mode;
}
Here, we define a string function "trading_Account_Mode" to determine the trading account type (whether it's a demo account, competition account, or real account) based on the value of the ACCOUNT_TRADE_MODE parameter. We begin by declaring a variable "account_mode" to store the account type as a string. Then, we use a "switch" statement to evaluate the account trade mode, which is obtained by calling the function "AccountInfoInteger" with the parameter ACCOUNT_TRADE_MODE. This function returns the account's trade mode as an integer value. The switch statement checks the value of this integer and compares it against the possible account modes:
- If the account mode is ACCOUNT_TRADE_MODE_DEMO, we set "account_mode" to "DEMO".
- If the account mode is ACCOUNT_TRADE_MODE_CONTEST, we set "account_mode" to "COMPETITION".
- If the account mode is ACCOUNT_TRADE_MODE_REAL, we set "account_mode" to "REAL".
Finally, the function returns the "account_mode" as a string, which indicates the type of account the EA is connected to. Therefore, the final initialization function is as follows:
//+------------------------------------------------------------------+
//| Expert initialization function                                   |
//+------------------------------------------------------------------+
int OnInit(){
//---

   handleMAFast = iMA(_Symbol,_Period,inpMA_Fast_Period,0,inpMA_Fast_Method,PRICE_CLOSE);
   handleMASlow = iMA(_Symbol,_Period,inpMA_Slow_Period,0,inpMA_Slow_Method,PRICE_CLOSE);

   handleRSIFilter = iRSI(_Symbol,inpRSI_Tf,inpRSI_Period,inpRSI_Applied_Price);

   if (handleMAFast == INVALID_HANDLE || handleMASlow == INVALID_HANDLE || handleRSIFilter == INVALID_HANDLE){
      Print("ERROR! Unable to create the indicator handles. Reveting Now!");
      return (INIT_FAILED);
   }

   if (inpMA_Fast_Period <= 0 || inpMA_Slow_Period <= 0 || inpRSI_Period <= 0){
      Print("ERROR! Periods cannot be <= 0. Reverting Now!");
      return (INIT_PARAMETERS_INCORRECT);
   }

   ArraySetAsSeries(bufferMAFast,true);
   ArraySetAsSeries(bufferMASlow,true);
   ArraySetAsSeries(bufferRSIFilter,true);

   obj_Trade.SetExpertMagicNumber(inpMagicNo);

   Print("SUCCESS INITIALIZATION. ACCOUNT TYPE = ",trading_Account_Mode());

//---
   return(INIT_SUCCEEDED);
}
Now we graduate to the OnDeinit event handler, where we will need to free the indicator handles since we won't be needing them any longer.
//+------------------------------------------------------------------+
//| Expert deinitialization function                                 |
//+------------------------------------------------------------------+
void OnDeinit(const int reason){
//---
   IndicatorRelease(handleMAFast);
   IndicatorRelease(handleMASlow);
   IndicatorRelease(handleRSIFilter);
}
To release the resources allocated to the indicator handles, we begin by calling the function IndicatorRelease for each of the indicators handles: "handleMAFast", "handleMASlow", and "handleRSIFilter". The purpose of the function is to free the memory and resources associated with the indicator handles that were initialized during the EA’s execution. This ensures that the platform’s resources are not unnecessarily occupied by indicators that are no longer in use. Next, we graduate to the OnTick event handler which is where most of our trading logic will be handled. We will first need to retrieve the indicator data from the handles.
//+------------------------------------------------------------------+
//| Expert tick function                                             |
//+------------------------------------------------------------------+
void OnTick(){
//--- Check if data can be retrieved for the fast moving average (MA)
   if (CopyBuffer(handleMAFast,0,0,3,bufferMAFast) < 3){
   //--- Print error message for fast MA data retrieval failure
      Print("ERROR! Failed to retrieve the requested FAST MA data. Reverting.");
   //--- Exit the function if data retrieval fails
      return;
   }
//--- Check if data can be retrieved for the slow moving average (MA)
   if (CopyBuffer(handleMASlow,0,0,3,bufferMASlow) < 3){
   //--- Print error message for slow MA data retrieval failure
      Print("ERROR! Failed to retrieve the requested SLOW MA data. Reverting.");
   //--- Exit the function if data retrieval fails
      return;
   }
//--- Check if data can be retrieved for the RSI filter
   if (CopyBuffer(handleRSIFilter,0,0,3,bufferRSIFilter) < 3){
   //--- Print error message for RSI data retrieval failure
      Print("ERROR! Failed to retrieve the requested RSI data. Reverting.");
   //--- Exit the function if data retrieval fails
      return;
   }

   //---

}
Here, we focus on retrieving the latest indicator data for the fast-moving average, slow-moving average, and RSI filter to ensure the EA has the necessary information to make trading decisions. First, we use the function CopyBuffer for the fast-moving average handle ("handleMAFast"). The function extracts the indicator values into the corresponding buffer ("bufferMAFast") for processing. Specifically, we request 3 data points starting from index 0, which represents the most recent data on the chart. If the number of values retrieved is less than 3, it indicates a failure to access the required data. In this case, we print an error message using the Print function and terminate the function early with return operator.
Next, we repeat a similar process for the slow-moving average handle ("handleMASlow") and its buffer ("bufferMASlow"). Again, if the CopyBuffer function fails to retrieve at least 3 data points, we print an error message and exit the function to prevent further execution. Finally, we use the same function for the RSI filter handle ("handleRSIFilter") and its buffer ("bufferRSIFilter"). As before, we ensure that the requested data points are successfully retrieved; otherwise, an error message is printed, and the function is terminated. If we don't return up to this point, we have the necessary data and we can continue to generate signals. However, we want to generate signals on every bar and not on every tick. Thus, we will need a function to detect new bars generation.
//+------------------------------------------------------------------+
//|     Function to detect if a new bar is formed                    |
//+------------------------------------------------------------------+
bool isNewBar(){
//--- Static variable to store the last bar count
   static int lastBarCount = 0;
//--- Get the current bar count
   int currentBarCount = iBars(_Symbol,_Period);
//--- Check if the bar count has increased
   if (currentBarCount > lastBarCount){
   //--- Update the last bar count
      lastBarCount = currentBarCount;
   //--- Return true if a new bar is detected
      return true;
   }
//--- Return false if no new bar is detected
   return false;
}
Here, we define the "isNewBar" function, which is designed to detect the appearance of a new bar on the chart. This function will be crucial for ensuring that our operations are performed only once per bar, rather than repeatedly on every tick. We begin by declaring a static variable "lastBarCount" and initializing it to 0. A static variable retains its value between function calls, allowing us to compare the current state with the previous state. Then, we retrieve the total number of bars on the chart using the iBars function, passing in _Symbol (the current trading instrument) and _Period (the current timeframe). The result is stored in "currentBarCount".
Next, we compare "currentBarCount" to "lastBarCount". If "currentBarCount" is greater, it indicates that a new bar has been formed on the chart. In this case, we update "lastBarCount" to match "currentBarCount" and return true, signaling the presence of a new bar. If no new bar is detected, the function returns false. Now we can use this function on the tick event handler.
//--- Check if a new bar has formed
if (isNewBar()){
//--- Print debug message for a new tick
   //Print("THIS IS A NEW TICK");

//--- Identify if a buy crossover has occurred
   bool isMACrossOverBuy = bufferMAFast[1] > bufferMASlow[1] && bufferMAFast[2] <= bufferMASlow[2];
//--- Identify if a sell crossover has occurred
   bool isMACrossOverSell = bufferMAFast[1] < bufferMASlow[1] && bufferMAFast[2] >= bufferMASlow[2];

//--- Check if the RSI confirms a buy signal
   bool isRSIConfirmBuy = bufferRSIFilter[1] >= inpRsiBUYThreshold;
//--- Check if the RSI confirms a sell signal
   bool isRSIConfirmSell = bufferRSIFilter[1] <= inpRsiSELLThreshold;

   //---
}
Here, we implement the core logic to detect specific trading signals based on the relationship between moving averages and RSI confirmations. The process begins by checking if a new bar has formed using the "isNewBar" function. This ensures that the subsequent logic is executed only once per bar, avoiding repeated evaluations within the same bar.
If a new bar is detected, we first prepare to identify a buy crossover by evaluating the relationship between the fast and slow-moving averages. Specifically, we check if the fast-moving average value for the previous bar ("bufferMAFast[1]") is greater than the slow-moving average value for the same bar ("bufferMASlow[1]"), while at the same time, the fast moving average value two bars ago ("bufferMAFast[2]") was less than or equal to the slow moving average value for that bar ("bufferMASlow[2]"). If both conditions are true, we set the boolean variable "isMACrossOverBuy" to true, indicating a buy crossover.
Similarly, we identify a sell crossover by checking if the fast-moving average value for the previous bar ("bufferMAFast[1]") is less than the slow-moving average value for the same bar ("bufferMASlow[1]"), while the fast moving average value two bars ago ("bufferMAFast[2]") was greater than or equal to the slow moving average value for that bar ("bufferMASlow[2]"). If these conditions are met, we set the boolean variable "isMACrossOverSell" to true, indicating a sell crossover.
Next, we incorporate RSI as a confirmation filter for the detected crossovers. For a buy confirmation, we verify that the RSI value for the previous bar ("bufferRSIFilter[1]") is greater than or equal to the buy threshold ("inpRsiBUYThreshold"). If true, we set the boolean variable "isRSIConfirmBuy" to true. Similarly, for a sell confirmation, we check that the RSI value for the previous bar ("bufferRSIFilter[1]") is less than or equal to the sell threshold ("inpRsiSELLThreshold"). If true, we set the boolean variable "isRSIConfirmSell" to true. We can now use these variables to make trading decisions.
//--- Handle buy signal conditions
if (isMACrossOverBuy){
   if (isRSIConfirmBuy){
   //--- Print buy signal message
      Print("BUY SIGNAL");

   //---
}
Here, we check if there is a cross in moving averages and rsi confirms the signal and if all conditions are true, we print a buy signal. However, before we open a buy position, we need to check adherence to the trading days filter. Hence, we need a function to keep everything modularized.
//+------------------------------------------------------------------+
//|     Function to check trading days filter                        |
//+------------------------------------------------------------------+
bool isCheckTradingDaysFilter(){
//--- Structure to store the current date and time
   MqlDateTime dateTIME;
//--- Convert the current time into structured format
   TimeToStruct(TimeCurrent(),dateTIME);
//--- Variable to store the day of the week
   string today = "DAY OF WEEK";

//--- Assign the day of the week based on the numeric value
   if (dateTIME.day_of_week == 0){today = "SUNDAY";}
   if (dateTIME.day_of_week == 1){today = "MONDAY";}
   if (dateTIME.day_of_week == 2){today = "TUESDAY";}
   if (dateTIME.day_of_week == 3){today = "WEDNESDAY";}
   if (dateTIME.day_of_week == 4){today = "THURSDAY";}
   if (dateTIME.day_of_week == 5){today = "FRIDAY";}
   if (dateTIME.day_of_week == 6){today = "SATURDAY";}

//--- Check if trading is allowed based on the input parameters
   if (
      (dateTIME.day_of_week == 0 && Sunday == true) ||
      (dateTIME.day_of_week == 1 && Monday == true) ||
      (dateTIME.day_of_week == 2 && Tuesday == true) ||
      (dateTIME.day_of_week == 3 && Wednesday == true) ||
      (dateTIME.day_of_week == 4 && Thursday == true) ||
      (dateTIME.day_of_week == 5 && Friday == true) ||
      (dateTIME.day_of_week == 6 && Saturday == true)
   ){
   //--- Print acceptance message for trading
      Print("Today is on ",today,". Trade ACCEPTED.");
   //--- Return true if trading is allowed
      return true;
   }
   else {
   //--- Print rejection message for trading
      Print("Today is on ",today,". Trade REJECTED.");
   //--- Return false if trading is not allowed
      return false;
   }
}
Here, we create a function "isCheckTradingDaysFilter" to determine if trading is allowed on the current day based on the user's input settings. This ensures that trades are executed only on permitted trading days, improving precision and avoiding unintended operations on restricted days. First, we define a structured object "MqlDateTime dateTIME" to hold the current date and time. Using the TimeToStruct function, we convert the current server time (TimeCurrent) into the "dateTIME" structure, enabling us to easily access components such as the day of the week.
Next, we define a variable "today" and assign a placeholder string "DAY OF WEEK". This will later store the name of the current day in human-readable format. Using a series of if conditions, we map the numeric "day_of_week" value (ranging from 0 for Sunday to 6 for Saturday) to its corresponding day name, updating the "today" variable with the correct day.
Following this, we check whether trading is allowed on the current day by comparing "dateTIME.day_of_week" with the corresponding boolean input variables ("Sunday", "Monday", etc.). If the current day matches one of the enabled trading days, a message is printed using "Print" to indicate that trading is allowed, including the day's name, and the function returns true. Conversely, if trading is not permitted, a message is printed to indicate that trading is rejected, and the function returns false. Technically, this function serves as a gatekeeper, ensuring that trading operations align with the user's day-specific preferences. We can use it to make the trading day filter.
//--- Verify trading days filter before placing a trade
if (isCheckTradingDaysFilter()){
//--- Retrieve the current ask price
   double Ask = SymbolInfoDouble(_Symbol,SYMBOL_ASK);
//--- Retrieve the current bid price
   double Bid = SymbolInfoDouble(_Symbol,SYMBOL_BID);

//--- Set the open price to the ask price
   double openPrice = Ask;
//--- Calculate the stop-loss price
   double stoploss = Bid - inpSLPts*_Point;
//--- Calculate the take-profit price
   double takeprofit = Bid + (inpSLPts*inpR2R)*_Point;
//--- Define the trade comment
   string comment = "BUY TRADE";

//--- Execute a buy trade
   obj_Trade.Buy(inpLots,_Symbol,openPrice,stoploss,takeprofit,comment);
//--- Initialize the ticket variable
   ulong ticket = 0;
//--- Retrieve the order result ticket
   ticket = obj_Trade.ResultOrder();
//--- Print success message if the trade is opened
   if (ticket > 0){
      Print("SUCCESS. Opened the BUY position with ticket # ",ticket);
   }
//--- Print error message if the trade fails to open
   else {Print("ERROR! Failed to open the BUY position.");}
}
Here, we check if trading is permitted on the current day by calling the "isCheckTradingDaysFilter" function. If the function returns true, we proceed to gather market data and place a trade, ensuring that trading adheres to user-defined day filters. First, we retrieve the current market prices using the SymbolInfoDouble function. The SYMBOL_ASK and SYMBOL_BID parameters are used to fetch the current ask and bid prices for the active trading symbol (_Symbol). These values are stored in the variables "Ask" and "Bid", respectively, providing the basis for further calculations.
Next, we calculate the price levels required for the trade. The "Ask" price is set as the "openPrice", representing the entry price for a buy position. We calculate the stop-loss price by subtracting "inpSLPts" (the input stop-loss points) multiplied by _Point from the "Bid" price. Similarly, the take-profit price is determined by adding the product of "inpSLPts", the risk-to-reward ratio ("inpR2R"), and _Point to the "Bid" price. These calculations define the risk and reward boundaries for the trade.
We then define a trade comment ("BUY TRADE") to label the trade for future reference. Afterward, we execute the buy trade using the "obj_Trade.Buy" method, passing the lot size ("inpLots"), trading symbol, entry price, stop-loss price, take-profit price, and comment as parameters. This function sends the trade order to the market. Following the trade execution, we initialize the "ticket" variable to 0 and assign it the order ticket returned by the "obj_Trade.ResultOrder" method. If the ticket is greater than 0, it indicates that the trade was successfully opened, and a success message is printed with the ticket number. If the ticket remains 0, it signifies a trade failure and an error message is displayed. For a sell position, we follow the same procedure, but with inverse conditions. Its code snippet is as follows:
//--- Handle sell signal conditions
else if (isMACrossOverSell){
   if (isRSIConfirmSell){
   //--- Print sell signal message
      Print("SELL SIGNAL");
   //--- Verify trading days filter before placing a trade
      if (isCheckTradingDaysFilter()){
      //--- Retrieve the current ask price
         double Ask = SymbolInfoDouble(_Symbol,SYMBOL_ASK);
      //--- Retrieve the current bid price
         double Bid = SymbolInfoDouble(_Symbol,SYMBOL_BID);

      //--- Set the open price to the bid price
         double openPrice = Bid;
      //--- Calculate the stop-loss price
         double stoploss = Ask + inpSLPts*_Point;
      //--- Calculate the take-profit price
         double takeprofit = Ask - (inpSLPts*inpR2R)*_Point;
      //--- Define the trade comment
         string comment = "SELL TRADE";

      //--- Execute a sell trade
         obj_Trade.Sell(inpLots,_Symbol,openPrice,stoploss,takeprofit,comment);
      //--- Initialize the ticket variable
         ulong ticket = 0;
      //--- Retrieve the order result ticket
         ticket = obj_Trade.ResultOrder();
      //--- Print success message if the trade is opened
         if (ticket > 0){
            Print("SUCCESS. Opened the SELL position with ticket # ",ticket);
         }
      //--- Print error message if the trade fails to open
         else {Print("ERROR! Failed to open the SELL position.");}
      }
   }
}
Upon running the program, we have the following outcome.
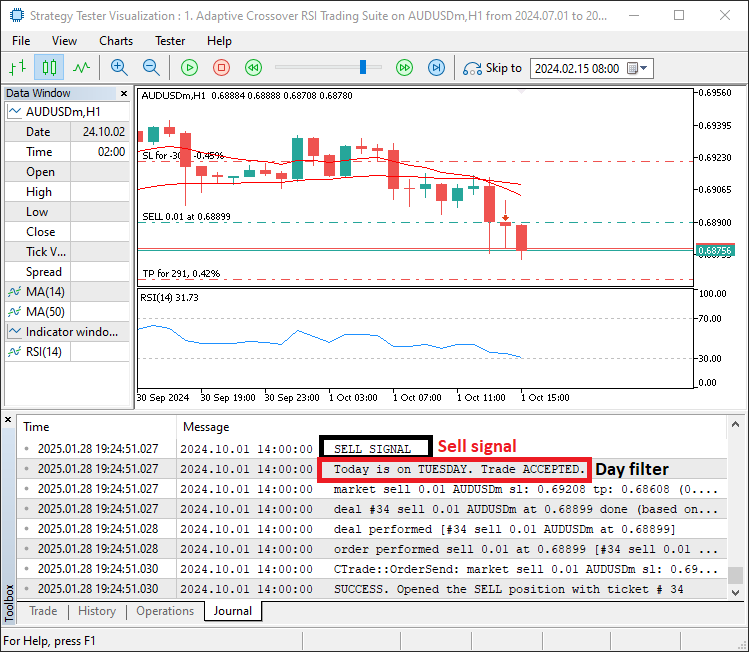
From the image, we can see that we confirm the trades. However, it would be a good idea to visualize the signals on the chart for clarity. Hence, we need a function to draw arrows with annotations.
//+------------------------------------------------------------------+
//|    Create signal text function                                   |
//+------------------------------------------------------------------+
void createSignalText(datetime time,double price,int arrowcode,
            int direction,color clr,double angle,string txt
){
//--- Generate a unique name for the signal object
   string objName = " ";
   StringConcatenate(objName, "Signal @ ",time," at Price ",DoubleToString(price,_Digits));
//--- Create the arrow object at the specified time and price
   if (ObjectCreate(0,objName,OBJ_ARROW,0,time,price)){
   //--- Set arrow properties
      ObjectSetInteger(0,objName,OBJPROP_ARROWCODE,arrowcode);
      ObjectSetInteger(0,objName,OBJPROP_COLOR,clr);
      if (direction > 0) ObjectSetInteger(0,objName,OBJPROP_ANCHOR,ANCHOR_TOP);
      if (direction < 0) ObjectSetInteger(0,objName,OBJPROP_ANCHOR,ANCHOR_BOTTOM);
   }

//--- Generate a unique name for the description text object
   string objNameDesc = objName+txt;
//--- Create the text object at the specified time and price
   if (ObjectCreate(0,objNameDesc,OBJ_TEXT,0,time,price)){
   //--- Set text properties
      ObjectSetInteger(0,objNameDesc,OBJPROP_COLOR,clr);
      ObjectSetDouble(0,objNameDesc,OBJPROP_ANGLE,angle);
      if (direction > 0){
         ObjectSetInteger(0,objNameDesc,OBJPROP_ANCHOR,ANCHOR_LEFT);
         ObjectSetString(0,objNameDesc,OBJPROP_TEXT,"    "+txt);
      }
      if (direction < 0){
         ObjectSetInteger(0,objNameDesc,OBJPROP_ANCHOR,ANCHOR_BOTTOM);
         ObjectSetString(0,objNameDesc,OBJPROP_TEXT,"    "+txt);
      }

   }

}
Here, we define the "createSignalText" function to visually represent trading signals on the chart with arrows and descriptive text. This function enhances the chart's clarity by marking significant events such as buy or sell signals. First, we generate a unique name for the arrow object using the StringConcatenate function. The name includes the word "Signal", the specified time, and the price of the signal. This unique naming ensures no overlap with other objects on the chart.
Next, we create an arrow object on the chart at the specified time and price using the ObjectCreate function. If the creation is successful, we proceed to customize its properties. The "arrowcode" parameter determines the type of arrow to display, while the "clr" parameter specifies the arrow's color. Based on the signal direction, the arrow's anchor point is set to the top (ANCHOR_TOP) for upward signals or to the bottom (ANCHOR_BOTTOM) for downward signals. This ensures the arrow's position aligns correctly with the signal's context.
We then create a description text object to accompany the arrow. A unique name for the text object is generated by appending the "txt" description to the arrow's name. The text object is placed at the same time and price coordinates as the arrow. The properties of the text object are set to improve its appearance and alignment. The "clr" parameter defines the text color, and the angle parameter determines its rotation. For upward signals, the anchor is aligned to the left (ANCHOR_LEFT), and the txt is prepended with spaces to adjust spacing. Similarly, for downward signals, the anchor is aligned to the bottom (ANCHOR_BOTTOM) with the same spacing adjustment.
Now we can use this function to create the arrows with respective annotations.
//--- FOR A BUY SIGNAL
//--- Retrieve the time of the signal
datetime textTime = iTime(_Symbol,_Period,1);
//--- Retrieve the price of the signal
double textPrice = iLow(_Symbol,_Period,1);
//--- Create a visual signal on the chart for a buy
createSignalText(textTime,textPrice,221,1,clrBlue,-90,"Buy Signal");

//...

//--- FOR A SELL SIGNAL
//--- Retrieve the time of the signal
datetime textTime = iTime(_Symbol,_Period,1);
//--- Retrieve the price of the signal
double textPrice = iHigh(_Symbol,_Period,1);
//--- Create a visual signal on the chart for a sell
createSignalText(textTime,textPrice,222,-1,clrRed,90,"Sell Signal");
Here, we create visual markers on the chart to represent Buy and Sell signals. These markers consist of arrows and accompanying descriptive text to enhance chart clarity and aid in decision-making.
For a Buy Signal:
- Retrieve the Time of the Signal:
Using the iTime function, we obtain the datetime of the second-to-last completed bar (index 1) on the chart for the current symbol and timeframe (_Symbol and _Period). This ensures that the signal corresponds to a confirmed bar.
- Retrieve the Price of the Signal:
We use the iLow function to fetch the lowest price of the same bar (1). This serves as the position where we want to place the marker.
- Create a Visual Signal:
The "createSignalText" function is called with the retrieved "textTime" and "textPrice" values, along with additional parameters:
- "221": The arrow code for a specific arrow type representing a buy signal.
- "1": Direction of the signal, indicating upward movement.
- "clrBlue": Color of the arrow and text, representing a positive signal.
- "-90": Text angle for proper alignment.
- "Buy Signal": The descriptive text is displayed near the arrow. This visually marks the buy signal on the chart.
For a Sell Signal:
- Retrieve the Time of the Signal:
As with the buy signal, we use iTime to fetch the datetime of the bar at index 1.
- Retrieve the Price of the Signal:
The iHigh function is used to get the highest price of the same bar. This represents the placement position for the sell signal marker.
- Create a Visual Signal:
The "createSignalText" function is invoked with:
- "222": The arrow code representing a sell signal.
- "-1": Direction of the signal, indicating downward movement.
- "clrRed": Color of the arrow and text, signifying a negative signal.
- "90": Text angle for alignment.
- "Sell Signal": The descriptive text displayed near the arrow. This adds a clear marker for the sell signal on the chart.
Upon running the program, we have the following output.
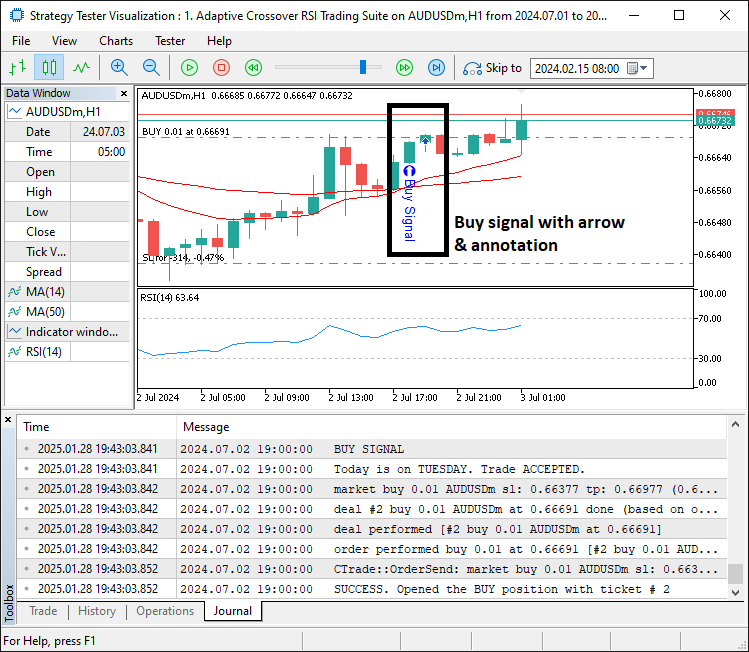
From the image, we can see that once we have a confirmed signal, we have the arrow and its respective annotation on the chart for clarity. This adds a professional touch to the chart, making it easier to interpret trading signals through clear visual cues. We can now graduate to adding a trailing stop feature to the code so that we can lock in some profits once we hit certain predefined levels. For simplicity, we will use a function.
//+------------------------------------------------------------------+
//|         Trailing stop function                                   |
//+------------------------------------------------------------------+
void applyTrailingStop(int slpoints, CTrade &trade_object,ulong magicno=0,int minProfitPts=0){
//--- Calculate the stop loss price for buy positions
   double buySl = NormalizeDouble(SymbolInfoDouble(_Symbol,SYMBOL_BID) - slpoints*_Point,_Digits);
//--- Calculate the stop loss price for sell positions
   double sellSl = NormalizeDouble(SymbolInfoDouble(_Symbol,SYMBOL_ASK) + slpoints*_Point,_Digits);

//--- Loop through all positions in the account
   for (int i=PositionsTotal()-1; i>=0; i--){
   //--- Get the ticket of the position
      ulong ticket = PositionGetTicket(i);
   //--- Ensure the ticket is valid
      if (ticket > 0){
      //--- Select the position by ticket
         if (PositionSelectByTicket(ticket)){
         //--- Check if the position matches the symbol and magic number (if provided)
            if (PositionGetSymbol(POSITION_SYMBOL) == _Symbol &&
               (magicno == 0 || PositionGetInteger(POSITION_MAGIC) == magicno)
            ){
            //--- Retrieve the open price and current stop loss of the position
               double positionOpenPrice = PositionGetDouble(POSITION_PRICE_OPEN);
               double positionSl = PositionGetDouble(POSITION_SL);

            //--- Handle trailing stop for buy positions
               if (PositionGetInteger(POSITION_TYPE) == POSITION_TYPE_BUY){
               //--- Calculate the minimum profit price for the trailing stop
                  double minProfitPrice = NormalizeDouble((positionOpenPrice+minProfitPts*_Point),_Digits);
               //--- Apply trailing stop only if conditions are met
                  if (buySl > minProfitPrice &&
                     buySl > positionOpenPrice &&
                     (positionSl == 0 || buySl > positionSl)
                  ){
                  //--- Modify the position's stop loss
                     trade_object.PositionModify(ticket,buySl,PositionGetDouble(POSITION_TP));
                  }
               }
               //--- Handle trailing stop for sell positions
               else if (PositionGetInteger(POSITION_TYPE) == POSITION_TYPE_SELL){
               //--- Calculate the minimum profit price for the trailing stop
                  double minProfitPrice = NormalizeDouble((positionOpenPrice-minProfitPts*_Point),_Digits);
               //--- Apply trailing stop only if conditions are met
                  if (sellSl < minProfitPrice &&
                     sellSl < positionOpenPrice &&
                     (positionSl == 0 || sellSl < positionSl)
                  ){
                  //--- Modify the position's stop loss
                     trade_object.PositionModify(ticket,sellSl,PositionGetDouble(POSITION_TP));
                  }
               }

            }
         }
      }
   }

}
Here, we implement a trailing stop mechanism in the "applyTrailingStop" function to dynamically adjust stop-loss levels for active trading positions. This ensures that as the market moves favorably, we secure profits while minimizing risks. The function operates using the following logic. First, we calculate the stop-loss levels for both buy and sell positions. Using the SymbolInfoDouble function, we retrieve the SYMBOL_BID price to determine the "buySl" level, subtracting the specified "slpoints" (stop-loss distance in points) and normalizing it to the correct number of decimal places using NormalizeDouble function. Similarly, we calculate the "sellSl" level by adding the "slpoints" to the SYMBOL_ASK price and normalizing it.
Next, we iterate through all active positions in the trading account using a reverse for loop ("for (int i=PositionsTotal()-1; i>=0; i--)"). For each position, we retrieve its "ticket" using the PositionGetTicket function. If the "ticket" is valid, we select the corresponding position using the PositionSelectByTicket function. Within the loop, we check if the position matches the current "symbol" and the provided "magicno" (magic number). If "magicno" is 0, we include all positions regardless of their magic number. For eligible positions, we retrieve their POSITION_PRICE_OPEN (open price) and POSITION_SL (current stop-loss level).
For buy positions, we calculate the "minProfitPrice" by adding the "minProfitPts" (minimum profit in points) to the open price and normalizing it. We only apply the trailing stop if the "buySl" level meets all conditions:
- "buySl" exceeds the "minProfitPrice".
- "buySl" is higher than the open price.
- "buySl" is either greater than the current stop-loss or there is no stop-loss set ("positionSl == 0").
If these conditions are satisfied, we modify the position's stop-loss using the "PositionModify" method from the "CTrade" object. For sell positions, we calculate the "minProfitPrice" by subtracting the "minProfitPts" from the open price and normalizing it. Similarly, we apply the trailing stop if the "sellSl" level meets the following conditions:
- "sellSl" is below the "minProfitPrice".
- "sellSl" is lower than the open price.
- "sellSl" is either lower than the current stop-loss or there is no stop-loss set.
If these conditions are met, we modify the position's stop-loss using the "PositionModify" method as well. We can then call these functions on every tick to apply the trailing stop logic for the open positions as follows.
//--- Apply trailing stop if allowed in the input parameters
if (inpisAllowTrailingStop){
   applyTrailingStop(inpTrailPts,obj_Trade,inpMagicNo,inpMinTrailPts);
}
Here, we call the trailing stop function and upon running the program, we have the following outcome.
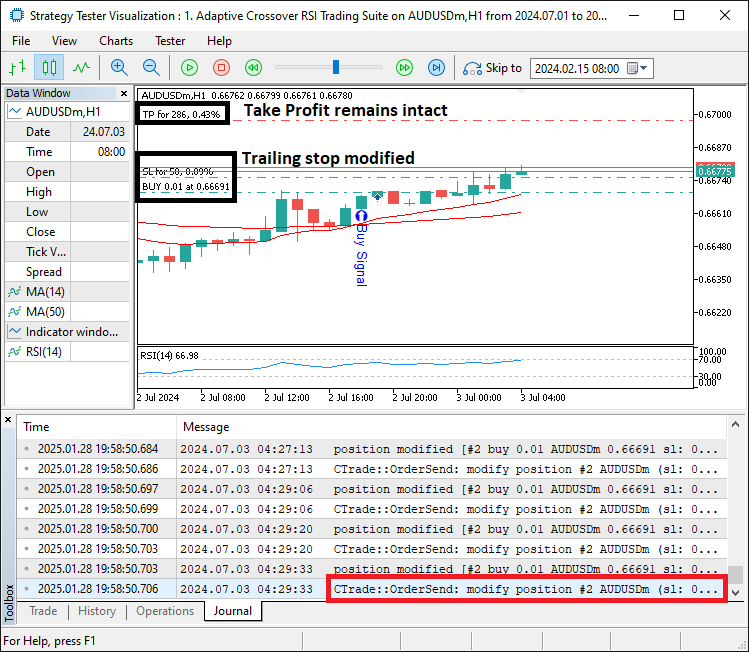
From the image, we can see that the trailing stop objective is achieved with success. We now need to visualize the data on the chart. For that, we will need a dashboard with a main base and labels. For the base, we will require a rectangle label. Here is the function's implementation.
//+------------------------------------------------------------------+
//|     Create Rectangle label function                              |
//+------------------------------------------------------------------+
bool createRecLabel(string objNAME,int xD,int yD,int xS,int yS,
                  color clrBg,int widthBorder,color clrBorder = clrNONE,
                  ENUM_BORDER_TYPE borderType = BORDER_FLAT,ENUM_LINE_STYLE borderStyle = STYLE_SOLID
){
//--- Reset the last error code
   ResetLastError();
//--- Attempt to create the rectangle label object
   if (!ObjectCreate(0,objNAME,OBJ_RECTANGLE_LABEL,0,0,0)){
   //--- Log the error if creation fails
      Print(__FUNCTION__,": Failed to create the REC LABEL. Error Code = ",_LastError);
      return (false);
   }

//--- Set rectangle label properties
   ObjectSetInteger(0, objNAME,OBJPROP_XDISTANCE, xD);
   ObjectSetInteger(0, objNAME,OBJPROP_YDISTANCE, yD);
   ObjectSetInteger(0, objNAME,OBJPROP_XSIZE, xS);
   ObjectSetInteger(0, objNAME,OBJPROP_YSIZE, yS);
   ObjectSetInteger(0, objNAME,OBJPROP_CORNER, CORNER_LEFT_UPPER);
   ObjectSetInteger(0, objNAME,OBJPROP_BGCOLOR, clrBg);
   ObjectSetInteger(0, objNAME,OBJPROP_BORDER_TYPE, borderType);
   ObjectSetInteger(0, objNAME,OBJPROP_STYLE, borderStyle);
   ObjectSetInteger(0, objNAME,OBJPROP_WIDTH, widthBorder);
   ObjectSetInteger(0, objNAME,OBJPROP_COLOR, clrBorder);
   ObjectSetInteger(0, objNAME,OBJPROP_BACK, false);
   ObjectSetInteger(0, objNAME,OBJPROP_STATE, false);
   ObjectSetInteger(0, objNAME,OBJPROP_SELECTABLE, false);
   ObjectSetInteger(0, objNAME,OBJPROP_SELECTED, false);

//--- Redraw the chart to reflect changes
   ChartRedraw(0);

   return (true);
}
In the "createRecLabel" boolean function that we define, we create a customizable rectangle label on the chart by following a series of steps. First, we reset any previous error codes using the ResetLastError function. Then, we attempt to create the rectangle label object using the ObjectCreate function. If this creation fails, we print an error message with the failure reason and return "false". If the creation is successful, we proceed to set various properties for the rectangle label using the ObjectSetInteger function.
These properties allow us to define the position, size, background color, border style, and other visual aspects of the rectangle. We assign the "xD", "yD", "xS", and "yS" parameters to determine the position and size of the rectangle label, using OBJPROP_XDISTANCE, "OBJPROP_YDISTANCE", "OBJPROP_XSIZE", and "OBJPROP_YSIZE". Additionally, we set the background color, border type, and border style through OBJPROP_BGCOLOR, "OBJPROP_BORDER_TYPE", and "OBJPROP_STYLE", respectively.
Finally, to ensure the label's visual representation is updated, we call the ChartRedraw function to refresh the chart. If the rectangle label is successfully created and all the properties are set correctly, the function returns "true". This way, we can visually annotate the chart with customized rectangle labels based on the parameters provided. We do the same for a label function.
//+------------------------------------------------------------------+
//|    Create label function                                         |
//+------------------------------------------------------------------+
bool createLabel(string objNAME,int xD,int yD,string txt,
                  color clrTxt = clrBlack,int fontSize = 12,
                  string font = "Arial Rounded MT Bold"
){
//--- Reset the last error code
   ResetLastError();
//--- Attempt to create the label object
   if (!ObjectCreate(0,objNAME,OBJ_LABEL,0,0,0)){
   //--- Log the error if creation fails
      Print(__FUNCTION__,": Failed to create the LABEL. Error Code = ",_LastError);
      return (false);
   }

//--- Set label properties
   ObjectSetInteger(0, objNAME,OBJPROP_XDISTANCE, xD);
   ObjectSetInteger(0, objNAME,OBJPROP_YDISTANCE, yD);
   ObjectSetInteger(0, objNAME,OBJPROP_CORNER, CORNER_LEFT_UPPER);
   ObjectSetString(0, objNAME,OBJPROP_TEXT, txt);
   ObjectSetInteger(0, objNAME,OBJPROP_COLOR, clrTxt);
   ObjectSetString(0, objNAME,OBJPROP_FONT, font);
   ObjectSetInteger(0, objNAME,OBJPROP_FONTSIZE, fontSize);
   ObjectSetInteger(0, objNAME,OBJPROP_BACK, false);
   ObjectSetInteger(0, objNAME,OBJPROP_STATE, false);
   ObjectSetInteger(0, objNAME,OBJPROP_SELECTABLE, false);
   ObjectSetInteger(0, objNAME,OBJPROP_SELECTED, false);

//--- Redraw the chart to reflect changes
   ChartRedraw(0);

   return (true);
}
Armed with these functions, we can now create a function to handle the creation of the dashboard whenever necessary.
//+------------------------------------------------------------------+
//|    Create dashboard function                                     |
//+------------------------------------------------------------------+
void createDashboard(){

   //---
}
Here, we create the void function called "createDashboard", and we can use it to house the logic for the creation of the dashboard. To effectively keep track of the changes, we can call the function on the OnInit event handler first before defining its body, as below.
//---

createDashboard();

//---
After calling the function, we can define the function's body. The first thing we do is define the dashboard body, and we will need to define its name as a global constant.
//+------------------------------------------------------------------+
//|    Global constants for dashboard object names                   |
//+------------------------------------------------------------------+
const string DASH_MAIN = "MAIN";
Here, we define a constant string, const meaning it will not be changed throughout the program. We now use the constant for the creation of the label as follows.
//+------------------------------------------------------------------+
//|    Create dashboard function                                     |
//+------------------------------------------------------------------+
void createDashboard(){
//--- Create the main dashboard rectangle
   createRecLabel(DASH_MAIN,10,50+30,200,120,clrBlack,2,clrBlue,BORDER_FLAT,STYLE_SOLID);

   //---

}
In the "createDashboard" function, we initiate the process of creating a visual dashboard on the chart. To achieve this, we call the "createRecLabel" function, which is responsible for drawing a rectangle on the chart to serve as the base of the dashboard. The function is provided with specific parameters to define the appearance and positioning of this rectangle. First, we specify the name of the rectangle as "DASH_MAIN", which will allow us to identify this object later. We then define the rectangle's position by setting its top-left corner at the coordinates (10, 50+30) on the chart, using the "xD" and "yD" parameters. The width and height of the rectangle are set to 200 and 120 pixels, respectively, through the "xS" and "yS" parameters, but can be adjusted afterward.
Next, we define the visual appearance of the rectangle. The background color of the rectangle is set to "clrBlack", and we choose a blue color ("clrBlue") for the border. The border has a width of 2 pixels and a solid line style (STYLE_SOLID), and the border type is set to flat (BORDER_FLAT). These settings ensure that the rectangle has a clear and distinct appearance. This rectangle serves as the foundational element of the dashboard, and additional elements such as text or interactive components can be added to it in subsequent steps. However, let us run the current milestone and get the outcome.
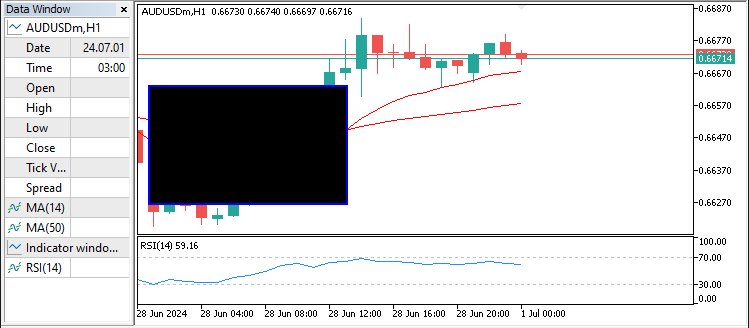
From the image, we can see that the dashboard's base is as we anticipated it to be. We can then create the other elements for the dashboard using the label function and following the same procedure. So we define the rest of the objects as follows.
//+------------------------------------------------------------------+
//|    Global constants for dashboard object names                   |
//+------------------------------------------------------------------+
const string DASH_MAIN = "MAIN";
const string DASH_HEAD = "HEAD";
const string DASH_ICON1 = "ICON 1";
const string DASH_ICON2 = "ICON 2";
const string DASH_NAME = "NAME";
const string DASH_OS = "OS";
const string DASH_COMPANY = "COMPANY";
const string DASH_PERIOD = "PERIOD";
const string DASH_POSITIONS = "POSITIONS";
const string DASH_PROFIT = "PROFIT";
Here, we just define the rest of the objects. Again, we use the label function to create the header label as below.
//+------------------------------------------------------------------+
//|    Create dashboard function                                     |
//+------------------------------------------------------------------+
void createDashboard(){
//--- Create the main dashboard rectangle
   createRecLabel(DASH_MAIN,10,50+30,200,120+30,clrBlack,2,clrBlue,BORDER_FLAT,STYLE_SOLID);

//--- Add icons and text labels to the dashboard
   createLabel(DASH_ICON1,13,53+30,CharToString(40),clrRed,17,"Wingdings");
   createLabel(DASH_ICON2,180,53+30,"@",clrWhite,17,"Webdings");
   createLabel(DASH_HEAD,65,53+30,"Dashboard",clrWhite,14,"Impact");
}
Here, we enhance the dashboard by adding icons and a heading using the "createLabel" function. This function is called multiple times to place text-based elements at specific positions on the chart, allowing us to build a visually appealing and informative interface. First, we create an icon labeled "DASH_ICON1", which is positioned at coordinates (13, 53+30) relative to the chart. The icon is represented by the character code 40, converted to a string using the "CharToString(40)" function. This icon is displayed in red ("clrRed") with a font size of 17, and the font style is set to "Wingdings" to render the character as a graphical symbol.
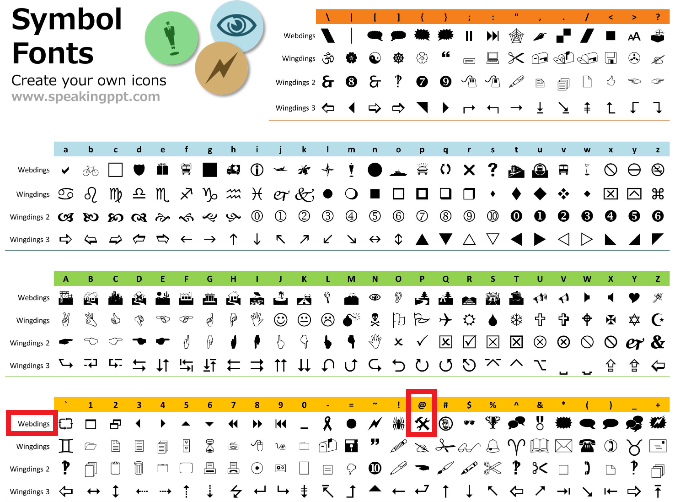
Next, we add another icon labeled "DASH_ICON2", placed at coordinates (180, 53+30). This icon uses the "@" character, displayed in white ("clrWhite") with a font size of 17. The font style is "Webdings", ensuring that the "@" character appears in a decorative and stylized manner. Here is the representation.
Finally, we include a text heading labeled "DASH_HEAD" at position (65, 53+30). The heading displays the text "Dashboard" in white ("clrWhite") with a font size of 14. The font style is set to "Impact", which gives the heading a bold and distinctive appearance. We can then define the rest of the labels.
createLabel(DASH_NAME,20,90+30,"EA Name: Crossover RSI Suite",clrWhite,10,"Calibri");
createLabel(DASH_COMPANY,20,90+30+15,"LTD: "+AccountInfoString(ACCOUNT_COMPANY),clrWhite,10,"Calibri");
createLabel(DASH_OS,20,90+30+15+15,"OS: "+TerminalInfoString(TERMINAL_OS_VERSION),clrWhite,10,"Calibri");
createLabel(DASH_PERIOD,20,90+30+15+15+15,"Period: "+EnumToString(Period()),clrWhite,10,"Calibri");

createLabel(DASH_POSITIONS,20,90+30+15+15+15+30,"Positions: "+IntegerToString(PositionsTotal()),clrWhite,10,"Calibri");
createLabel(DASH_PROFIT,20,90+30+15+15+15+30+15,"Profit: "+DoubleToString(AccountInfoDouble(ACCOUNT_PROFIT),2)+" "+AccountInfoString(ACCOUNT_CURRENCY),clrWhite,10,"Calibri");
Here, we populate the dashboard with important informational labels using the "createLabel" function. First, we create a label "DASH_NAME", positioned at (20, 90+30). This label displays the text "EA Name: Crossover RSI Suite" in white ("clrWhite") with a font size of 10, and the font style is "Calibri". This label serves as the name of the Expert Advisor, giving the user clear identification.
Next, we add the "DASH_COMPANY" label at (20, 90+30+15). It displays the text "LTD: ", followed by the account's company information, which is retrieved using the AccountInfoString function with parameter ACCOUNT_COMPANY. The label is styled in white with a font size of 10 and uses the "Calibri" font. Following that, the "DASH_OS" label is placed at (20, 90+30+15+15). It shows the operating system version, with the text "OS: ", combined with the result of TerminalInfoString function with parameter TERMINAL_OS_VERSION. This label helps the user know the terminal's operating system, also styled in white with a font size of 10 and the "Calibri" font.
Then, we include the "DASH_PERIOD" label at (20, 90+30+15+15+15). This label displays the chart's current timeframe with the text "Period: ", appended by the result of EnumToString function with the period. The white text, small font size, and "Calibri" font maintain consistency with the overall dashboard design. Additionally, we add the "DASH_POSITIONS" label at (20, 90+30+15+15+15+30). This label shows the total number of positions currently open on the account, with the text "Positions: ", followed by the total positions. This information is crucial for tracking active trades.
Lastly, the "DASH_PROFIT" label is placed at (20, 90+30+15+15+15+30+15). It displays the account's current profit with the text "Profit: ", followed by the result of the account's profit function, representing profit to two decimal places, along with the account currency retrieved via AccountInfoString function.
Finally, we need to delete the dashboard at the end once the program is removed. Thus, we need a function to delete the dashboard.
//+------------------------------------------------------------------+
//|     Delete dashboard function                                    |
//+------------------------------------------------------------------+
void deleteDashboard(){
//--- Delete all objects related to the dashboard
   ObjectDelete(0,DASH_MAIN);
   ObjectDelete(0,DASH_ICON1);
   ObjectDelete(0,DASH_ICON2);
   ObjectDelete(0,DASH_HEAD);
   ObjectDelete(0,DASH_NAME);
   ObjectDelete(0,DASH_COMPANY);
   ObjectDelete(0,DASH_OS);
   ObjectDelete(0,DASH_PERIOD);
   ObjectDelete(0,DASH_POSITIONS);
   ObjectDelete(0,DASH_PROFIT);

//--- Redraw the chart to reflect changes
   ChartRedraw();
}
Here, we create a void function "deleteDashboard", call the function ObjectDelete with all the object names and lastly redraw the chart using the ChartRedraw function for changes to take effect. We then call this function in the de-initialization function. Again, we need to update the dashboard whenever we have positions to display the correct positions and profit. Here is the logic we employ.
if (PositionsTotal() > 0){
   ObjectSetString(0,DASH_POSITIONS,OBJPROP_TEXT,"Positions: "+IntegerToString(PositionsTotal()));
   ObjectSetString(0,DASH_PROFIT,OBJPROP_TEXT,"Profit: "+DoubleToString(AccountInfoDouble(ACCOUNT_PROFIT),2)+" "+AccountInfoString(ACCOUNT_CURRENCY));
}
Here, we check that if positions are above 0, we have a position, and we can update its properties. Here is the outcome.
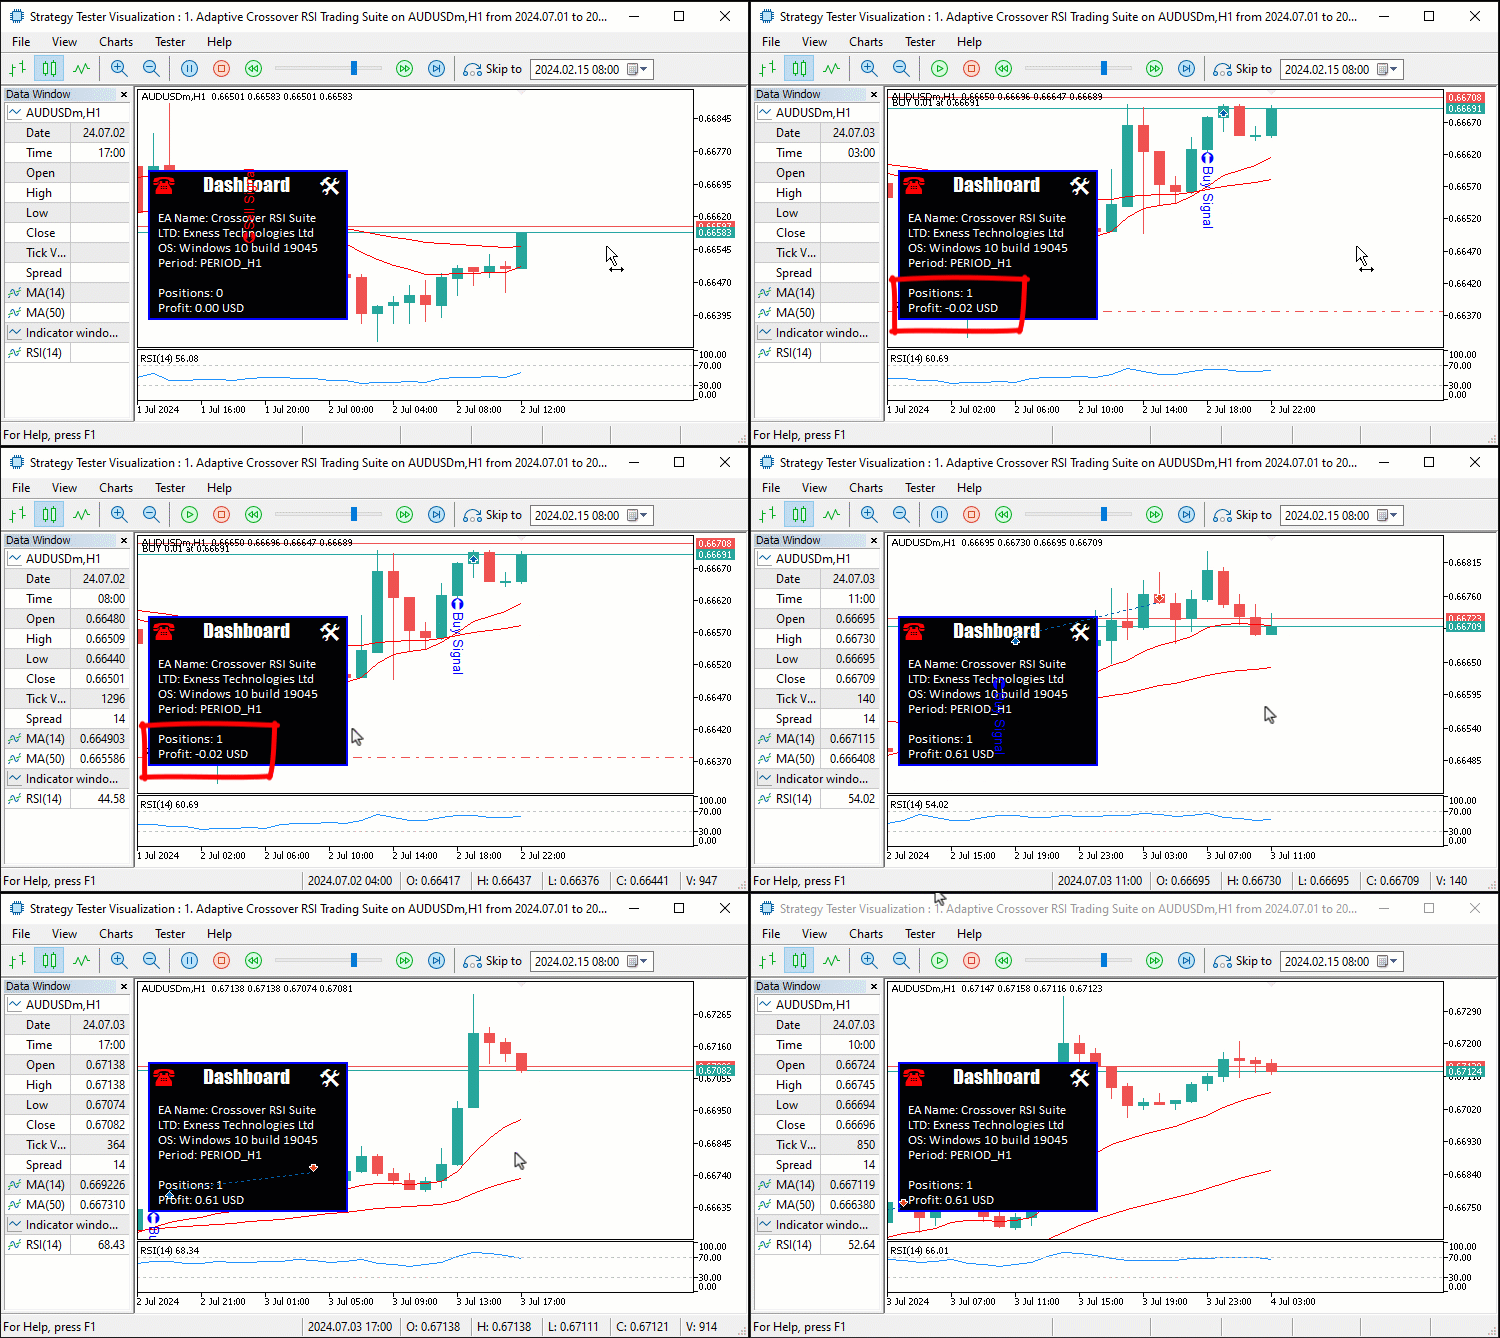
From the visualization, we can see that the dashboard does not update once the positions are closed. Thus, we will need to track when the positions are closed and when there are no positions, we default the values of the dashboard. To do this, we will require the OnTradeTransaction event handler.
//+------------------------------------------------------------------+
//|    OnTradeTransaction function                                   |
//+------------------------------------------------------------------+
void  OnTradeTransaction(
   const MqlTradeTransaction&    trans,     // trade transaction structure
   const MqlTradeRequest&        request,   // request structure
   const MqlTradeResult&         result     // response structure
){
   if (trans.type == TRADE_TRANSACTION_DEAL_ADD){
      Print("A deal was added. Make updates.");
      if (PositionsTotal() <= 0){
         ObjectSetString(0,DASH_POSITIONS,OBJPROP_TEXT,"Positions: "+IntegerToString(PositionsTotal()));
         ObjectSetString(0,DASH_PROFIT,OBJPROP_TEXT,"Profit: "+DoubleToString(AccountInfoDouble(ACCOUNT_PROFIT),2)+" "+AccountInfoString(ACCOUNT_CURRENCY));
      }
   }
}
Here, we set up the OnTradeTransaction function, which is triggered every time a trade-related transaction occurs. This function processes trade events and updates relevant information on the dashboard in response to specific actions. We begin by checking if the "type" of the trade transaction, provided by the "trans" parameter of type MqlTradeTransaction, is equal to TRADE_TRANSACTION_DEAL_ADD. This condition determines whether a new deal has been added to the account. When such a transaction is detected, we print a message "A deal was added. Make updates." to the log for debugging or informational purposes.
Next, we check if the total number of open positions, obtained via the PositionsTotal function, is less than or equal to 0. This ensures that updates to the dashboard are performed only when there are no active positions left in the account. If the condition is satisfied, we use the ObjectSetString function to update two labels on the dashboard. Here is the outcome.
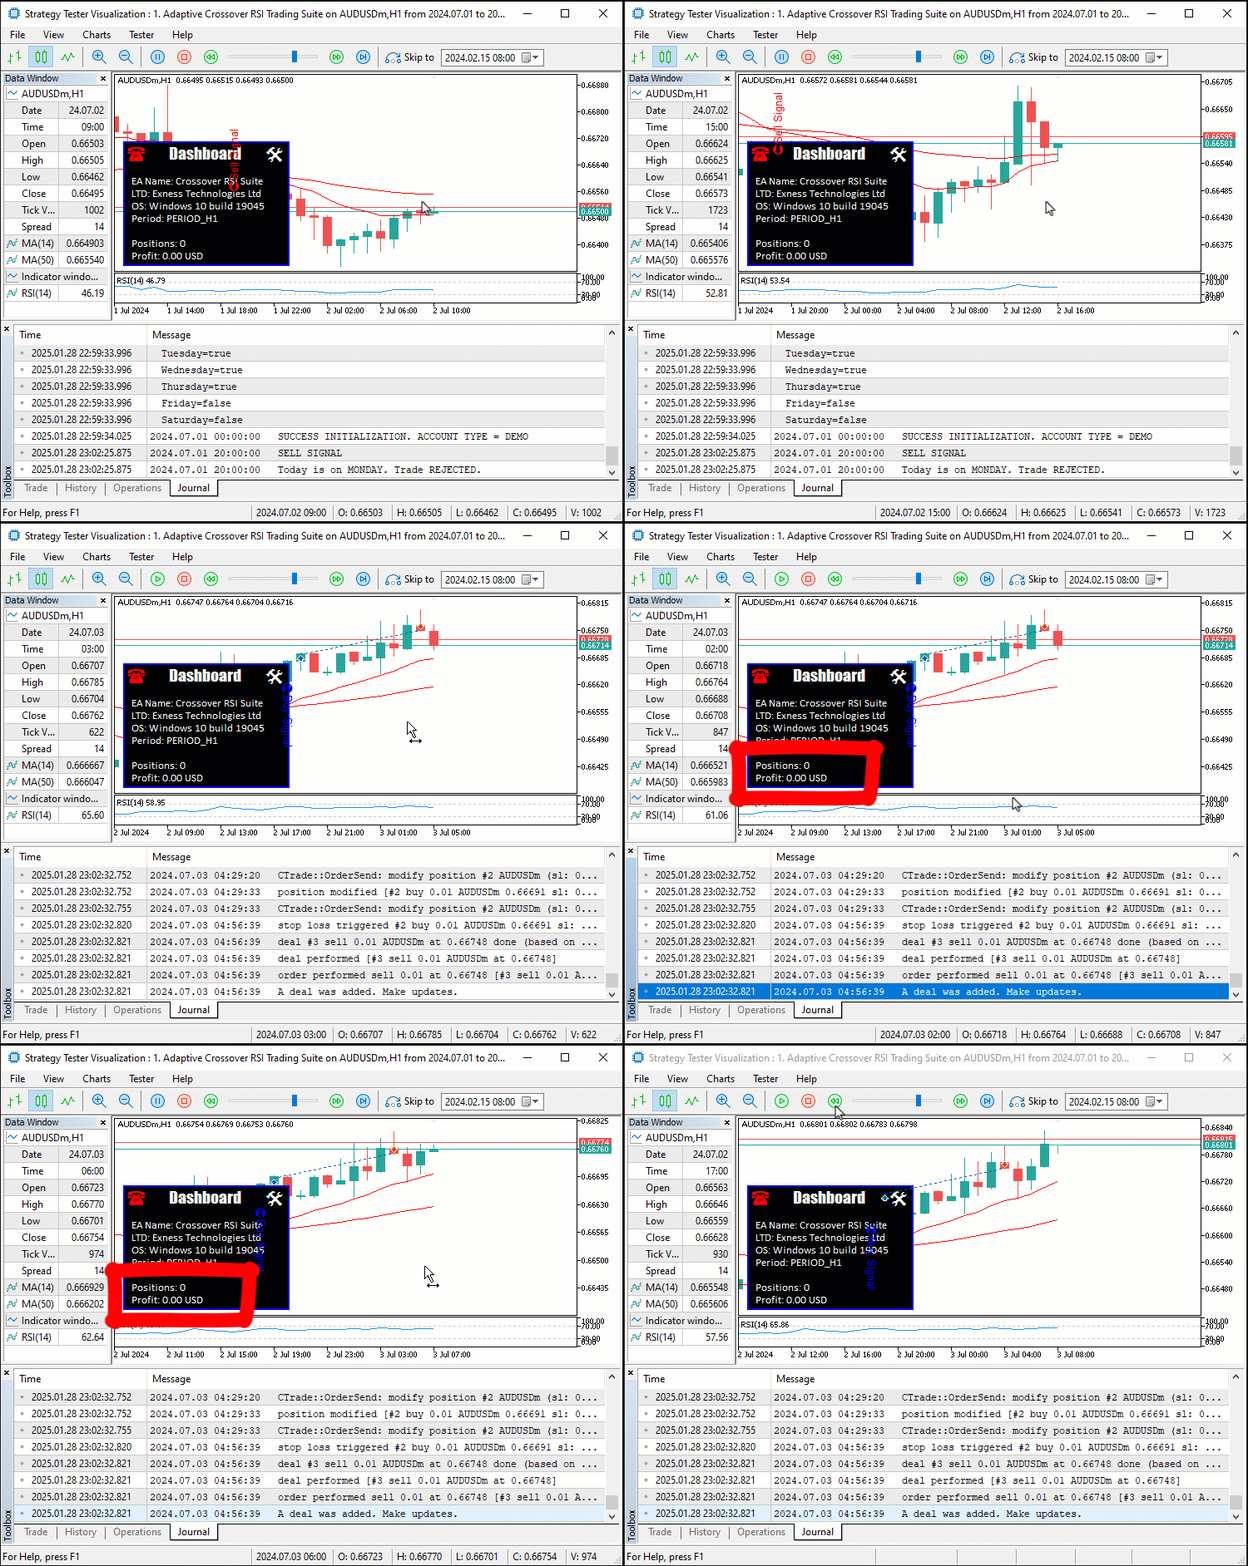
From the image, we can see that the updates do take effect on every deal that is transacted, achieving our objective, and what remains is to backtest the program and analyze its performance. This is handled in the next section.
Backtesting
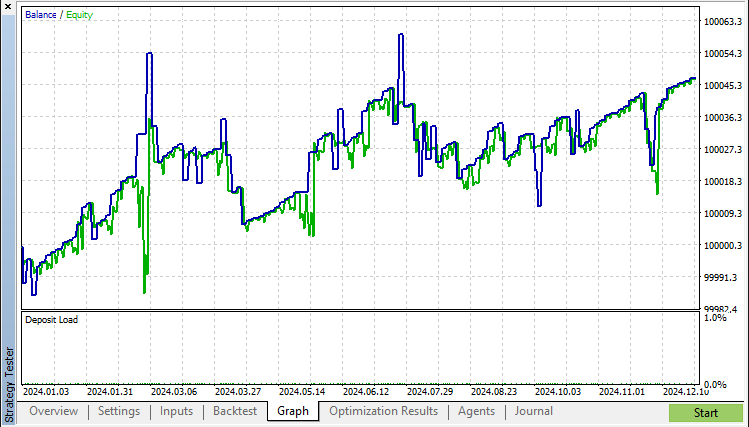
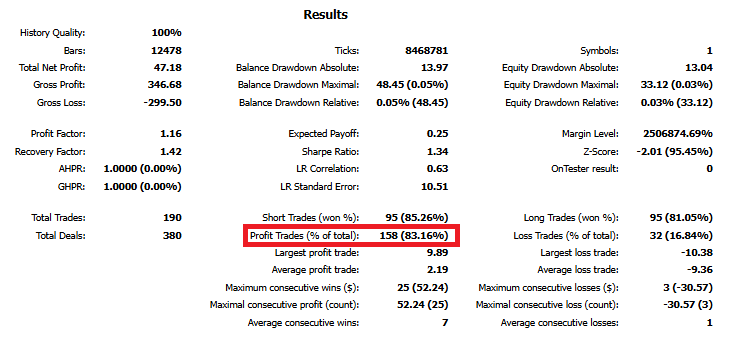
After thorough backtesting, we have the following results.
Backtest graph:
Backtest report:
Here is also a video format showcasing the whole strategy backtest within a period of 1 year, 2024.
Conclusion
In conclusion, we have showcased how to develop a robust MQL5 Expert Advisor (EA) that integrates technical indicators, automated trade management, and an interactive dashboard. By combining tools like the Moving Average crossovers, Relative Strength Index (RSI), and trailing stops with features such as dynamic trade updates, trailing stops, and a user-friendly interface, we created an EA capable of generating signals, managing trades, and providing real-time insights for effective decision-making.
Disclaimer: This article is for educational purposes only. Trading involves significant financial risks, and market conditions can be unpredictable. While the strategies discussed provide a structured framework, past performance does not guarantee future results. Thorough testing and proper risk management are essential before live deployment.
By applying these concepts, you can build more adaptive trading systems and enhance your algorithmic trading strategies. Happy coding and successful trading!
 Developing a Replay System (Part 57): Understanding a Test Service
 From Basic to Intermediate: Variables (II)
 Build Self Optimizing Expert Advisors in MQL5 (Part 5): Self Adapting Trading Rules
 Chaos theory in trading (Part 2): Diving deeper
- Free trading apps
- Over 8,000 signals for copying
- Economic news for exploring financial markets
You agree to website policy and terms of use
I can't seem to replicate the back tested results on AUDUSD over the 2024 period. The results I'm getting is much worse. I checked and my input parameters seems to be identical to what was used in the tutorial video. Any ideas why my results doesn't tie up to what you have in the article?
Hello. The video shows everything, from compilation, test period, and input parameters used.