
Automating Trading Strategies in MQL5 (Part 1): The Profitunity System (Trading Chaos by Bill Williams)
Introduction
In this article, we explore the Profitunity System, a trading strategy developed by Bill Williams that aims to profit from market "chaos" by utilizing a set of key indicators and show how to automate it in MetaQuotes Language 5 (MQL5). We start with an overview of the strategy and its key principles. Then, we walk through the implementation process in MQL5, focusing on coding the essential indicators and automating entry and exit signals. Next, we test and optimize the system to ensure performance across various market conditions. Finally, we conclude by discussing the potential and effectiveness of the Profitunity System in automated trading. The sections we cover in this article include:
- Overview of the Profitunity System
- Strategy Implementation in MQL5
- Strategy Testing and Optimization
- Conclusion
By the end of this article, you will have a clear understanding of how to automate the Profitunity System using MQL5, from implementing its key indicators to optimizing its performance. This will equip you with the tools to enhance your trading strategy and leverage market "chaos" for potential trading performances. Let’s dive in.
Overview of the Profitunity System
The Profitunity System, crafted by Bill Williams, utilizes a set of specialized indicators that allow us to understand and act on the chaotic movements in the market. The strategy combines the power of trend-following and momentum indicators to create a dynamic, highly responsive trading methodology. The system identifies trend reversals and market acceleration, helping us find high-probability trade setups. The key indicators used in the strategy are:
- Fractals
- Alligator
- Awesome Oscillator (AO)
- Accelerator Oscillator (AC)
Each of these indicators works together, providing critical insights into market conditions and offering entry and exit signals. Let us have a deeper look at the individual indicator settings that apply to the strategy.
Indicator Settings
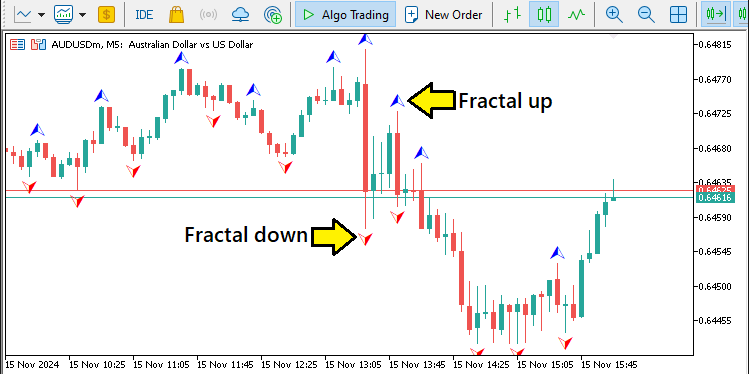
Fractal indicator. It identifies points of reversal in the market. The fractals are formed when there are five consecutive bars with the middle bar being the highest or lowest. They signal the potential start of a new trend or a price reversal, which helps in marking local highs or lows, giving an early indication of a possible trend change.As for the settings, the default period for the fractals is 2 or 5. This means it checks for patterns where a single bar is surrounded by two bars on either side that are lower (for fractal downs) or higher (for fractal ups). Here is how it looks like on the chart.
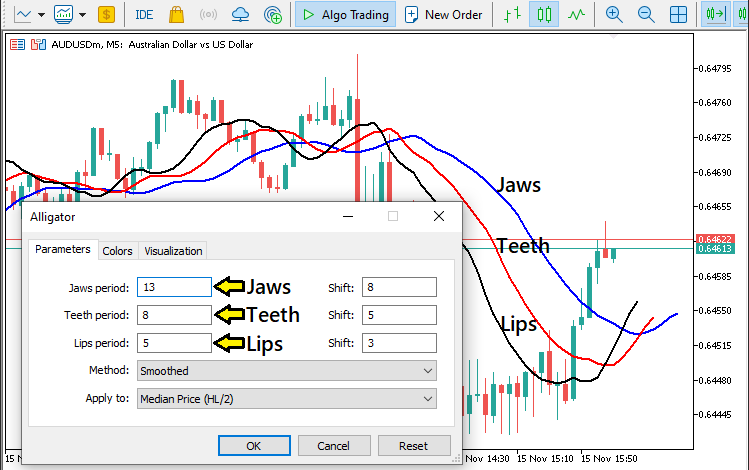
Alligator indicator. The indicator is a combination of three smoothed moving averages—known as the Jaw, Teeth, and Lips—that work together to determine the market's trend. The interaction between these lines helps us recognize whether the market is in a trend or consolidating. When the lines start to spread apart, it signals a trend; when they converge, it suggests the market is in a phase of consolidation.
Settings:
- Jaw (Blue Line): 13-period, smoothed by 8 bars
- Teeth (Red Line): 8-period, smoothed by 5 bars
- Lips (Green Line): 5-period, smoothed by 3 bars
The indicator will help us identify trend direction and timing, as well as market entries and exits. Here is its settings on the chart.
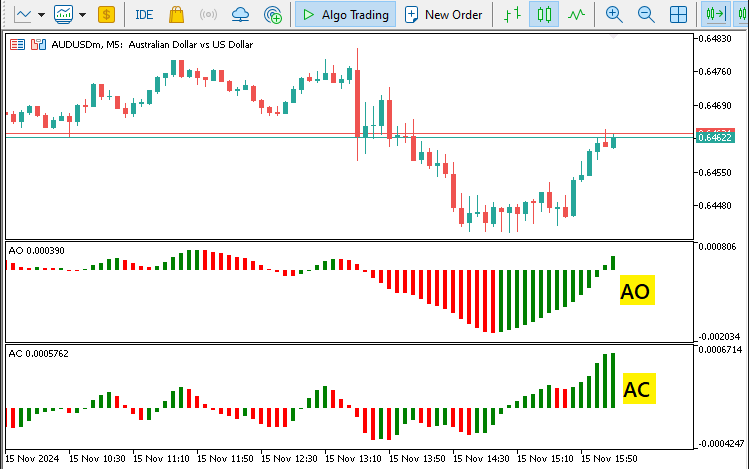
Awesome Oscillator (AO) indicator. This indicator is a momentum indicator that calculates the difference between a 34-period and a 5-period simple moving average of the median price. It helps us to gauge the strength and direction of a trend by plotting the difference between these two moving averages as a histogram. The settings for this indicator are default.
The AO is typically used to identify bullish or bearish momentum in the market and to spot trend shifts. A histogram above the zero line indicates upward momentum, while a histogram below the zero line signals downward momentum.
Accelerator Oscillator (AC) indicator. Derived from the AO indicator, it measures the acceleration of the market’s momentum. It provides insight into whether market momentum is accelerating or decelerating, which is vital for detecting trend changes before they fully develop. The AC oscillates around a zero line, moving in green (positive) or red (negative) zones. Its settings are also the default.
The AC indicator is used in conjunction with the AO indicator to provide confirmation of market strength and momentum shifts, ensuring that the market is moving strongly in one direction before entering a trade. Now let us have a look at the entry and exit conditions as utilized by the system. The AO and AC indicators would resemble the following illustration.
Entry and Exit Conditions
The system uses a set of specific conditions to enter and exit trades, which are based on the sequential signals from the Fractal, Alligator, Accelerator Oscillator (AC), and Awesome Oscillator (AO) indicators. The signals work together to ensure that trades are initiated only when the market provides strong confirmation of direction, reducing the risk of false signals.
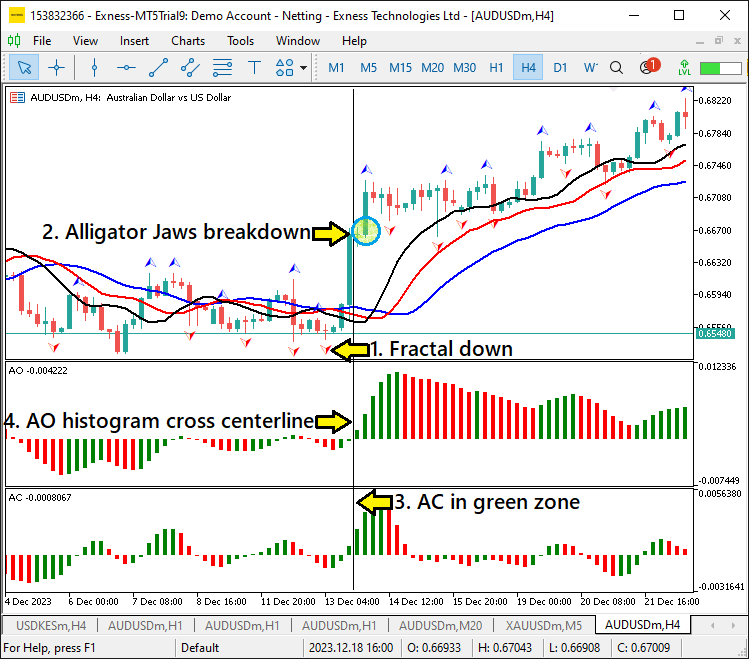
Buy Entry Conditions:
- Fractal Signal: A Fractal Down signal occurs when the price action forms a series of lower highs, suggesting a potential upward reversal in price.
- Alligator Line Breakdown: The Alligator’s Blue Line (Jaw) is broken from bottom to top, indicating the start of an uptrend.
- Accelerator Oscillator (AC) Confirmation: The AC is in the green zone, indicating bullish momentum and supporting the trend's strength.
- Awesome Oscillator (AO) Confirmation: The AO histogram crosses above the zero line from bottom to top, further confirming the upward momentum.
Buy Condition:
A Buy entry is triggered after the AO indicator histogram crosses above the zero line from below, confirming a rise in bullish momentum. This is an indication that a strong uptrend is developing and is the point we open a market buy position. Below is an example of a buy signal in the MetaTrader 5 chart.
Sell Entry Conditions:
- Fractal Signal: A Fractal Up signal occurs when the price action forms a series of higher lows, suggesting a potential downward reversal in price.
- Alligator Line Breakdown: The Alligator’s Blue Line (Jaw) is broken from top to bottom, signaling the start of a downtrend.
- Accelerator Oscillator (AC) Confirmation: The AC is in the red zone, confirming strong bearish momentum and indicating a high probability of continued downside movement.
- Awesome Oscillator (AO) Confirmation: The AO histogram crosses below the zero line from top to bottom, signaling a bearish trend.
Sell Condition:
A Sell entry is triggered after the AO histogram crosses below the zero line from above, confirming downward momentum. This indicates that the market is likely to continue moving downward, and is the point we open a market sell position.
Exit or Reversal Conditions:
- Alligator Line Reversal: A reversal of the Alligator’s Green Line (Lips) occurs, suggesting the end of the current trend. The Lips reversing direction indicates that the price may now be reversing or consolidating.
- Accelerator Oscillator (AC) Reversal: The AC crosses from the green zone to the red zone (or vice versa), signaling a potential change in momentum. This is an early indicator that market momentum is shifting and the current trend may be coming to an end.
- Awesome Oscillator (AO) Reversal: The AO histogram crossing the zero line in the opposite direction further confirms that a trend reversal is likely to occur.
Exit Condition:
Any or all of the above exit conditions can be used, but in our case we will choose to exit the positions when the AO indicator histograms are crossing into the opposite zone, indicating a shift in market momentum.
By utilizing the combination of the aforementioned indicators, the Profitunity System offers a powerful approach for identifying market reversals and strong trending opportunities. In the next section, we will discuss how to implement these entry and exit conditions in MQL5, enabling full automation of this strategy.
Strategy Implementation in MQL5
After learning all the theories about the Bill William's Profitunity trading strategy, let us then automate the theory and craft an Expert Advisor (EA) in MetaQuotes Language 5 (MQL5) for MetaTrader 5.
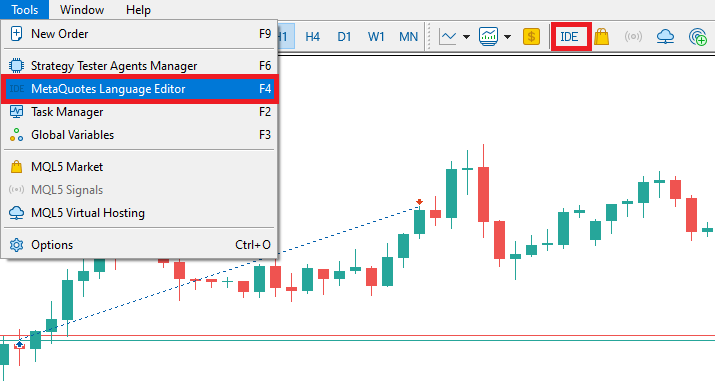
To create an expert advisor (EA), on your MetaTrader 5 terminal, click the Tools tab and check MetaQuotes Language Editor, or simply press F4 on your keyboard. Alternatively, you can click the IDE (Integrated Development Environment) icon on the tools bar. This will open the MetaQuotes Language Editor environment, which allows the writing of trading robots, technical indicators, scripts, and libraries of functions.
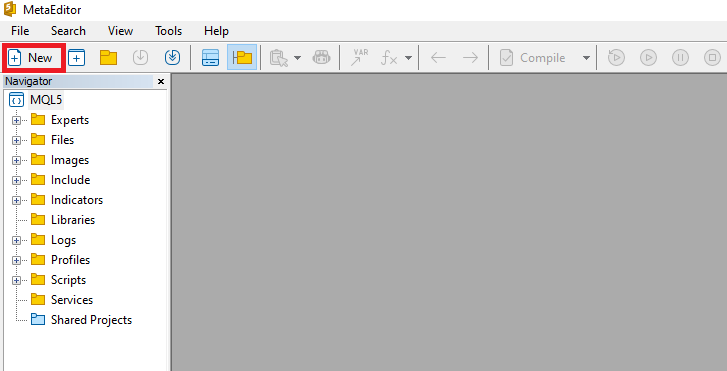
Once the MetaEditor is opened, on the tools bar, navigate to the File tab and check New File, or simply press CTRL + N, to create a new document. Alternatively, you can click on the New icon on the tools tab. This will result in a MQL Wizard pop-up.
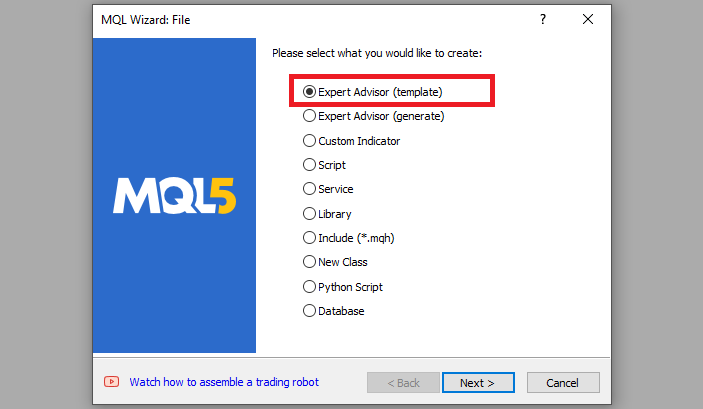
On the Wizard that pops, check Expert Advisor (template) and click Next.
On the general properties of the Expert Advisor, under the name section, provide your expert's file name. Note that to specify or create a folder if it doesn't exist, you use the backslash before the name of the EA. For example, here we have "Experts\" by default. That means that our EA will be created in the Experts folder and we can find it there. The other sections are pretty much straightforward, but you can follow the link at the bottom of the Wizard to know how to precisely undertake the process.
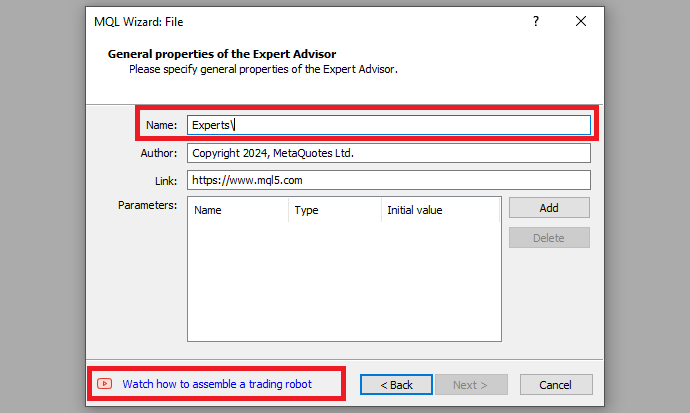
After providing your desired Expert Advisor file name, click on Next, click Next, and then click Finish. After doing all that, we are now ready to code and program our strategy.
First, we start by defining some metadata about the Expert Advisor (EA). This includes the name of the EA, the copyright information, and a link to the MetaQuotes website. We also specify the version of the EA, which is set to "1.00".
//+------------------------------------------------------------------+
//|              1. PROFITUNITY (TRADING CHAOS BY BILL WILLIAMS).mq5 |
//|      Copyright 2024, ALLAN MUNENE MUTIIRIA. #@Forex Algo-Trader. |
//|                                     https://forexalgo-trader.com |
//+------------------------------------------------------------------+
#property copyright "Copyright 2024, ALLAN MUNENE MUTIIRIA. #@Forex Algo-Trader"
#property link      "https://forexalgo-trader.com"
#property description "1. PROFITUNITY (TRADING CHAOS BY BILL WILLIAMS)"
#property version   "1.00"
This will display the system metadata when loading the program. We can then move on to adding some global variables that we will use within the program. First, we include a trade instance by using #include at the beginning of the source code. This gives us access to the "CTrade class", which we will use to create a trade object. This is crucial as we need it to open trades.
#include <Trade/Trade.mqh>
CTrade obj_Trade;
The preprocessor will replace the line #include <Trade/Trade.mqh> with the content of the file Trade.mqh. Angle brackets indicate that the Trade.mqh file will be taken from the standard directory (usually it is terminal_installation_directory\MQL5\Include). The current directory is not included in the search. The line can be placed anywhere in the program, but usually, all inclusions are placed at the beginning of the source code, for a better code structure and easier reference. Declaration of the obj_Trade object of the CTrade class will give us access to the methods contained in that class easily, thanks to the MQL5 developers.
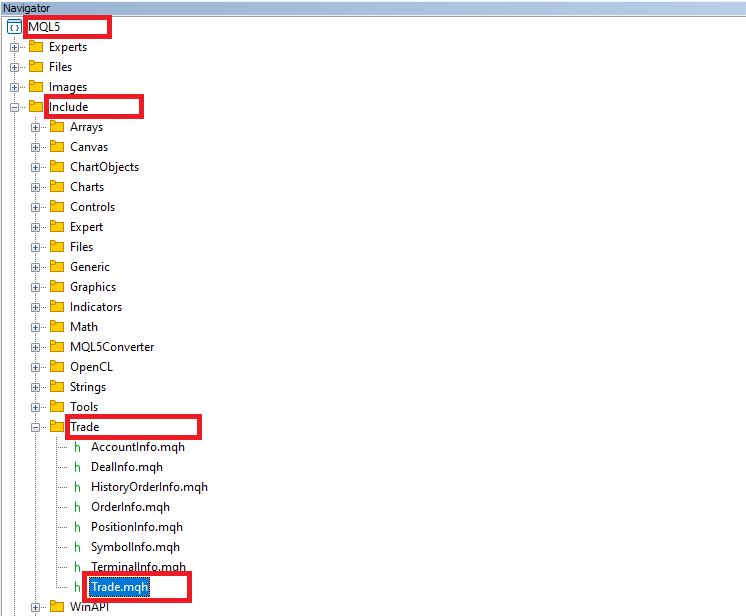
After that, we need to declare several important indicator handles that we will use in the trading system.
int handle_Fractals = INVALID_HANDLE; //--- Initialize fractals indicator handle with an invalid handle value
int handle_Alligator = INVALID_HANDLE; //--- Initialize alligator indicator handle with an invalid handle value
int handle_AO = INVALID_HANDLE; //--- Initialize Awesome Oscillator (AO) handle with an invalid handle value
int handle_AC = INVALID_HANDLE; //--- Initialize Accelerator Oscillator (AC) handle with an invalid handle value
Here, we set up initial variables to hold the handles for each technical indicator in the program. Specifically, we initialize four integer variables—"handle_Fractals", "handle_Alligator", "handle_AO", and "handle_AC"—with the INVALID_HANDLE value.
Each of these handles will act as a reference to access the respective indicators throughout the code. By assigning the initial "INVALID_HANDLE" value, we ensure that each handle variable clearly shows an invalid state until proper initialization takes place later in the code. This setup prevents errors from using an uninitialized handle and helps detect if any indicator fails to load during the initialization process.
In summary, this is what the indicators will do individually:
- "handle_Fractals" will store the handle for the Fractals indicator.
- "handle_Alligator" will store the handle for the Alligator indicator.
- "handle_AO" will store the handle for the Awesome Oscillator.
- "handle_AC" will store the handle for the Accelerator Oscillator.
Next, we need to define and initialize arrays and constants required to store and process data from the indicators used in this Expert Advisor, which we specifically retrieve from initialized indicator handles. We will do this sequentially to keep everything straight and simple for referencing.
double fractals_up[]; //--- Array to store values for upward fractals
double fractals_down[]; //--- Array to store values for downward fractals

double alligator_jaws[]; //--- Array to store values for Alligator's Jaw line
double alligator_teeth[]; //--- Array to store values for Alligator's Teeth line
double alligator_lips[]; //--- Array to store values for Alligator's Lips line

double ao_values[]; //--- Array to store values of the Awesome Oscillator (AO)

double ac_color[]; //--- Array to store color status of the Accelerator Oscillator (AC)
#define AC_COLOR_UP 0 //--- Define constant for upward AC color state
#define AC_COLOR_DOWN 1 //--- Define constant for downward AC color state
We begin by creating two arrays, "fractals_up" and "fractals_down", which will store values for upward and downward fractals, respectively. These arrays will allow us to keep track of specific fractal points, helping us identify significant price reversals or patterns.
Next, we set up three arrays—"alligator_jaws", "alligator_teeth", and "alligator_lips"—to store the values of the Alligator indicator's different lines. By keeping these values in separate arrays, we can efficiently track the state of each Alligator line and use them in cross-referencing for trading signals.
We then define the "ao_values" array to store the values of the Awesome Oscillator (AO). The AO will help us identify market momentum and trends, and storing these values will allow us to analyze changes over time and apply them to our trading conditions.
Lastly, we define the "ac_color" array to capture the color status of the Accelerator Oscillator (AC). This array will hold information about the AC's upward or downward movement, which we will store as a color state. To facilitate this, we define two constants: "AC_COLOR_UP" (set to 0) and "AC_COLOR_DOWN" (set to 1). These constants will represent the AC's color states, with green (upward) indicating momentum growth and red (downward) indicating a slowing trend. This setup will simplify our logic when we later check the AC status for trading signals.
You may have noticed that we can easily store the values of other indicators directly other than the fractals. This is because their values are readily available on every bar. However, as for the fractals, they form on specific swing points that are at least 3 bars away from the current bar. Thus, we can't just retrieve any of the fractal bars as they form conditionally. Thus, we need logic to keep track of the previous fractal value as well as its direction. Here is the logic we adopt.
double lastFractal_value = 0.0; //--- Variable to store the value of the last detected fractal
enum fractal_direction {FRACTAL_UP, FRACTAL_DOWN, FRACTAL_NEUTRAL}; //--- Enum for fractal direction states
fractal_direction lastFractal_direction = FRACTAL_NEUTRAL; //--- Variable to store the direction of the last fractal
Here, we define variables and an enumeration to store and manage the data of the most recent fractal detected in our trading analysis. We start by declaring the "lastFractal_value" variable and initialize it to "0.0". This variable will store the numerical value of the last fractal we detect on the chart. By keeping track of this value, we can use it to compare against the current price and analyze fractal formations for potential trade signals.
Next, we define an enumeration called "fractal_direction" with three possible states: "FRACTAL_UP", "FRACTAL_DOWN", and "FRACTAL_NEUTRAL". These states represent the direction of the last fractal:
- "FRACTAL_UP" will indicate an upward fractal, signaling potential bearish conditions.
- "FRACTAL_DOWN" will indicate a downward fractal, signaling potential bullish conditions.
- "FRACTAL_NEUTRAL" represents a state where no specific fractal direction has been confirmed.
Finally, we declare a variable, "lastFractal_direction", of type "fractal_direction" and initialize it to "FRACTAL_NEUTRAL". This variable will hold the direction of the last fractal detected, allowing us to make directional assessments within the trading logic based on the most recent fractal data.
From that, we can now graduate to the actual code-processing logic. We will need to initialize our indicators and thus we will dive directly into the OnInit event handler, which is called and executed on every instance the program is initialized.//+------------------------------------------------------------------+ //| Expert initialization function | //+------------------------------------------------------------------+ int OnInit(){ //--- //--- return(INIT_SUCCEEDED); //--- Return successful initialization status }
This is simply the default initialization event handler that we will use to initialize our program's control logic. Next, we need to initialize the indicators so that they are attached to the chart and we can use them for data retrieval and trading decisions. We will first initialize the fractals indicator as below.
   handle_Fractals = iFractals(_Symbol,_Period); //--- Initialize the fractals indicator handle
   if (handle_Fractals == INVALID_HANDLE){ //--- Check if the fractals indicator failed to initialize
      Print("ERROR: UNABLE TO INITIALIZE THE FRACTALS INDICATOR. REVERTING NOW!"); //--- Print error if fractals initialization failed
      return (INIT_FAILED); //--- Exit initialization with failed status
   }
Here, we initialize the "handle_Fractals" variable by calling the iFractals function. This function creates a handle for the Fractals indicator, applied to the specified symbol (represented by _Symbol) and the current chart period (_Period). By setting "handle_Fractals" to the return value of iFractals, we enable access to the indicator data, which we can later use to analyze fractal formations in our strategy.
After attempting to initialize the fractals indicator, we verify if it succeeded by checking if "handle_Fractals" equals INVALID_HANDLE. An "INVALID_HANDLE" value indicates that the indicator could not be initialized, which could happen for various reasons, such as lack of system resources or incorrect parameters.
If initialization fails, we use the Print function to output an error message, "ERROR: UNABLE TO INITIALIZE THE FRACTALS INDICATOR. REVERTING NOW!", to the journal. This message will serve as a clear notification of the issue, making troubleshooting easier. We then return INIT_FAILED to exit the OnInit function, signaling that the initialization process could not be completed successfully. This check helps ensure that the Expert Advisor does not proceed with an incomplete setup, which could lead to errors during execution. We do the same for the Alligator indicator initialization.
   handle_Alligator = iAlligator(_Symbol,_Period,13,8,8,5,5,3,MODE_SMMA,PRICE_MEDIAN); //--- Initialize the alligator indicator with specific settings
   if (handle_Alligator == INVALID_HANDLE){ //--- Check if the alligator indicator failed to initialize
      Print("ERROR: UNABLE TO INITIALIZE THE ALLIGATOR INDICATOR. REVERTING NOW!"); //--- Print error if alligator initialization failed
      return (INIT_FAILED); //--- Exit initialization with failed status
   }
We initialize the "handle_Alligator" variable by calling the iAlligator function. The Alligator indicator requires several parameters to define its three lines (Jaws, Teeth, and Lips), each of which responds to market trends. We specify these settings as follows: "13" for the Jaws period, "8" for the Teeth period, and "5" for the Lips period. Additionally, we define shift values of "8", "5", and "3" for each line, set the calculation method to MODE_SMMA (smoothed moving average), and use PRICE_MEDIAN as the price type.
After attempting to initialize the Alligator indicator, we check if "handle_Alligator" has a valid handle. If it equals INVALID_HANDLE, it indicates the initialization process failed. This could happen due to insufficient resources or incorrect parameters, preventing the Alligator indicator from functioning correctly.
If initialization fails, we call the Print function to display an error message: "ERROR: UNABLE TO INITIALIZE THE ALLIGATOR INDICATOR. REVERTING NOW!" This message helps alert us to the problem, making it easier to diagnose and resolve. After printing the message, we return INIT_FAILED, which exits the OnInit function and indicates that the initialization did not complete successfully.
We use a similar approach to initialize the AO and AC indicators as follows.
   handle_AO = iAO(_Symbol,_Period); //--- Initialize the Awesome Oscillator (AO) indicator handle
   if (handle_AO == INVALID_HANDLE){ //--- Check if AO indicator failed to initialize
      Print("ERROR: UNABLE TO INITIALIZE THE AO INDICATOR. REVERTING NOW!"); //--- Print error if AO initialization failed
      return (INIT_FAILED); //--- Exit initialization with failed status
   }
   handle_AC = iAC(_Symbol,_Period); //--- Initialize the Accelerator Oscillator (AC) indicator handle
   if (handle_AC == INVALID_HANDLE){ //--- Check if AC indicator failed to initialize
      Print("ERROR: UNABLE TO INITIALIZE THE AC INDICATOR. REVERTING NOW!"); //--- Print error if AC initialization failed
      return (INIT_FAILED); //--- Exit initialization with failed status
   }
After all the indicators are initialized successfully, we can then add them to the chart automatically when the program is loaded up. We use the following logic to achieve that.
   if (!ChartIndicatorAdd(0,0,handle_Fractals)){ //--- Add the fractals indicator to the main chart window and check for success
      Print("ERROR: UNABLE TO ADD THE FRACTALS INDICATOR TO CHART. REVERTING NOW!"); //--- Print error if fractals addition failed
      return (INIT_FAILED); //--- Exit initialization with failed status
   }
Here, we attempt to add the Fractals indicator to the main chart window using the ChartIndicatorAdd function. We pass "0" as the chart ID (indicating the current chart) and specify "0" as the window ID, targeting the main chart window. The "handle_Fractals" variable, which we previously initialized to store the Fractals indicator handle, is passed in to add this specific indicator.
After calling the ChartIndicatorAdd function, we check if the function call was successful. If it returns "false", represented by "!", this indicates that the Fractals indicator could not be added to the chart. Failure here could occur due to chart limitations or insufficient resources. In this case, we display an error message using Print to alert us: "ERROR: UNABLE TO ADD THE FRACTALS INDICATOR TO CHART. REVERTING NOW!" This message will allow us to quickly identify the source of the issue during debugging.
If the addition fails, we return INIT_FAILED to exit the OnInit function with a failure status, ensuring that the Expert Advisor will not run if the Fractals indicator is missing from the chart, helping prevent execution errors later on by confirming the indicator's visual availability. A similar logic is used to add the Alligator indicator since it is also in the main window, as below.
   if (!ChartIndicatorAdd(0,0,handle_Alligator)){ //--- Add the alligator indicator to the main chart window and check for success
      Print("ERROR: UNABLE TO ADD THE ALLIGATOR INDICATOR TO CHART. REVERTING NOW!"); //--- Print error if alligator addition failed
      return (INIT_FAILED); //--- Exit initialization with failed status
   }
To add the other indicators, a similar approach is used, only that the subwindows now change since we create a new subwindow for every indicator respectively as follows.
   if (!ChartIndicatorAdd(0,1,handle_AO)){ //--- Add the AO indicator to a separate subwindow and check for success
      Print("ERROR: UNABLE TO ADD THE AO INDICATOR TO CHART. REVERTING NOW!"); //--- Print error if AO addition failed
      return (INIT_FAILED); //--- Exit initialization with failed status
   }
   if (!ChartIndicatorAdd(0,2,handle_AC)){ //--- Add the AC indicator to a separate subwindow and check for success
      Print("ERROR: UNABLE TO ADD THE AC INDICATOR TO CHART. REVERTING NOW!"); //--- Print error if AC addition failed
      return (INIT_FAILED); //--- Exit initialization with failed status
   }
We add the Awesome Oscillator (AO) and Accelerator Oscillator (AC) indicators to separate subwindows on the chart, ensuring they each have their dedicated view. To achieve this, we use the ChartIndicatorAdd function for each indicator. We specify "0" for the chart ID (indicating the current chart) and use distinct window IDs: "1" for the AO indicator and "2" for the AC indicator, directing each to appear in a unique subwindow. The numbering here is crucial as every indicator has to be on its window, so you need to keep track of the subwindow indexing properly.
We then check the success of each addition individually. If ChartIndicatorAdd returns "false" for either the AO or AC indicators, it signals that the addition process failed. In case of failure, we output an error message with "Print" to clarify which specific indicator failed to load. For example, if the AO indicator cannot be added, we print "ERROR: UNABLE TO ADD THE AO INDICATOR TO CHART. REVERTING NOW!" Similarly, we output an error message if the AC indicator addition fails.
If either indicator addition fails, we immediately return INIT_FAILED, exiting the OnInit function and preventing further execution. To ensure everything is okay, we can print the indicator handles to the journal.
   Print("HANDLE ID FRACTALS = ",handle_Fractals); //--- Print the handle ID for fractals
   Print("HANDLE ID ALLIGATOR = ",handle_Alligator); //--- Print the handle ID for alligator
   Print("HANDLE ID AO = ",handle_AO); //--- Print the handle ID for AO
   Print("HANDLE ID AC = ",handle_AC); //--- Print the handle ID for AC
Upon running the program, we get the following initialization data.
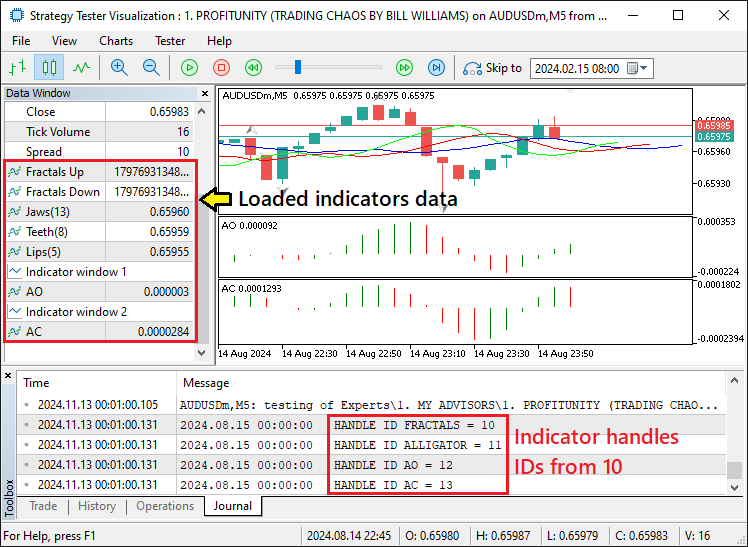
From the image, we can see that the handle IDs start from 10, sequentially to 13. Handle IDs are critical in MQL5 because they allow us to reference each indicator throughout the Expert Advisor’s lifecycle. When a function like CopyBuffer retrieves values from an indicator, it relies on these handles to access the correct data. Here, the integers represent specific identifiers for each initialized indicator. Each ID functions as a unique “pointer” within the MQL5 environment, linking each handle to its designated indicator. This helps the EA know which indicator data to pull from memory, supporting efficient execution and clear organization of indicator-based tasks.
From that, all that we now need to do is set the data holders as time series.
   ArraySetAsSeries(fractals_up,true); //--- Set the fractals_up array as a time series
   ArraySetAsSeries(fractals_down,true); //--- Set the fractals_down array as a time series

   ArraySetAsSeries(alligator_jaws,true); //--- Set the alligator_jaws array as a time series
   ArraySetAsSeries(alligator_teeth,true); //--- Set the alligator_teeth array as a time series
   ArraySetAsSeries(alligator_lips,true); //--- Set the alligator_lips array as a time series

   ArraySetAsSeries(ao_values,true); //--- Set the ao_values array as a time series

   ArraySetAsSeries(ac_color,true); //--- Set the ac_color array as a time series
Here, we set each array to operate as a time series, meaning the data within each array will be organized from the newest to the oldest values. We do this by applying the ArraySetAsSeries function to each array and passing "true" as the second argument. This setting ensures that the most recent data point always appears at index 0, which is particularly useful in trading applications, where accessing the latest value is essential for real-time decision-making.
We start by setting the "fractals_up" and "fractals_down" arrays as time series, enabling us to track the latest upward and downward fractal values efficiently. Similarly, we apply this organization to the "alligator_jaws", "alligator_teeth", and "alligator_lips" arrays, which represent the three lines of the Alligator indicator. This allows us to access the latest values of each line in real-time, making it easier to detect any changes in market trends.
We also configure the "ao_values" array, which stores the data for the Awesome Oscillator, in the same way. By setting it as a time series, we ensure that the most recent oscillator value is always readily available for our calculations. Finally, we apply this structure to the "ac_color" array, which tracks the color state of the Accelerator Oscillator, so that the most recent color status can be accessed immediately. The full initialization code snippet responsible for ensuring smooth and clean initialization is as below.
//+------------------------------------------------------------------+
//| Expert initialization function                                   |
//+------------------------------------------------------------------+
int OnInit(){
   //---

   handle_Fractals = iFractals(_Symbol,_Period); //--- Initialize the fractals indicator handle
   if (handle_Fractals == INVALID_HANDLE){ //--- Check if the fractals indicator failed to initialize
      Print("ERROR: UNABLE TO INITIALIZE THE FRACTALS INDICATOR. REVERTING NOW!"); //--- Print error if fractals initialization failed
      return (INIT_FAILED); //--- Exit initialization with failed status
   }
   handle_Alligator = iAlligator(_Symbol,_Period,13,8,8,5,5,3,MODE_SMMA,PRICE_MEDIAN); //--- Initialize the alligator indicator with specific settings
   if (handle_Alligator == INVALID_HANDLE){ //--- Check if the alligator indicator failed to initialize
      Print("ERROR: UNABLE TO INITIALIZE THE ALLIGATOR INDICATOR. REVERTING NOW!"); //--- Print error if alligator initialization failed
      return (INIT_FAILED); //--- Exit initialization with failed status
   }
   handle_AO = iAO(_Symbol,_Period); //--- Initialize the Awesome Oscillator (AO) indicator handle
   if (handle_AO == INVALID_HANDLE){ //--- Check if AO indicator failed to initialize
      Print("ERROR: UNABLE TO INITIALIZE THE AO INDICATOR. REVERTING NOW!"); //--- Print error if AO initialization failed
      return (INIT_FAILED); //--- Exit initialization with failed status
   }
   handle_AC = iAC(_Symbol,_Period); //--- Initialize the Accelerator Oscillator (AC) indicator handle
   if (handle_AC == INVALID_HANDLE){ //--- Check if AC indicator failed to initialize
      Print("ERROR: UNABLE TO INITIALIZE THE AC INDICATOR. REVERTING NOW!"); //--- Print error if AC initialization failed
      return (INIT_FAILED); //--- Exit initialization with failed status
   }

   if (!ChartIndicatorAdd(0,0,handle_Fractals)){ //--- Add the fractals indicator to the main chart window and check for success
      Print("ERROR: UNABLE TO ADD THE FRACTALS INDICATOR TO CHART. REVERTING NOW!"); //--- Print error if fractals addition failed
      return (INIT_FAILED); //--- Exit initialization with failed status
   }
   if (!ChartIndicatorAdd(0,0,handle_Alligator)){ //--- Add the alligator indicator to the main chart window and check for success
      Print("ERROR: UNABLE TO ADD THE ALLIGATOR INDICATOR TO CHART. REVERTING NOW!"); //--- Print error if alligator addition failed
      return (INIT_FAILED); //--- Exit initialization with failed status
   }
   if (!ChartIndicatorAdd(0,1,handle_AO)){ //--- Add the AO indicator to a separate subwindow and check for success
      Print("ERROR: UNABLE TO ADD THE AO INDICATOR TO CHART. REVERTING NOW!"); //--- Print error if AO addition failed
      return (INIT_FAILED); //--- Exit initialization with failed status
   }
   if (!ChartIndicatorAdd(0,2,handle_AC)){ //--- Add the AC indicator to a separate subwindow and check for success
      Print("ERROR: UNABLE TO ADD THE AC INDICATOR TO CHART. REVERTING NOW!"); //--- Print error if AC addition failed
      return (INIT_FAILED); //--- Exit initialization with failed status
   }

   Print("HANDLE ID FRACTALS = ",handle_Fractals); //--- Print the handle ID for fractals
   Print("HANDLE ID ALLIGATOR = ",handle_Alligator); //--- Print the handle ID for alligator
   Print("HANDLE ID AO = ",handle_AO); //--- Print the handle ID for AO
   Print("HANDLE ID AC = ",handle_AC); //--- Print the handle ID for AC

   ArraySetAsSeries(fractals_up,true); //--- Set the fractals_up array as a time series
   ArraySetAsSeries(fractals_down,true); //--- Set the fractals_down array as a time series

   ArraySetAsSeries(alligator_jaws,true); //--- Set the alligator_jaws array as a time series
   ArraySetAsSeries(alligator_teeth,true); //--- Set the alligator_teeth array as a time series
   ArraySetAsSeries(alligator_lips,true); //--- Set the alligator_lips array as a time series

   ArraySetAsSeries(ao_values,true); //--- Set the ao_values array as a time series

   ArraySetAsSeries(ac_color,true); //--- Set the ac_color array as a time series

   //---
   return(INIT_SUCCEEDED); //--- Return successful initialization status
}
Next, we can graduate to the OnTick event handler where we will house the control logic.
//+------------------------------------------------------------------+
//| Expert tick function                                             |
//+------------------------------------------------------------------+
void OnTick(){
//---
}
This is simply the default tick event handler that we will use to base our control logic. Next, we need to retrieve the data values from the indicator handles for further analysis.
   if (CopyBuffer(handle_Fractals,0,2,3,fractals_up) < 3){ //--- Copy upward fractals data; check if copying is successful
      Print("ERROR: UNABLE TO COPY THE FRACTALS UP DATA. REVERTING!"); //--- Print error message if failed
      return;
   }
   if (CopyBuffer(handle_Fractals,1,2,3,fractals_down) < 3){ //--- Copy downward fractals data; check if copying is successful
      Print("ERROR: UNABLE TO COPY THE FRACTALS DOWN DATA. REVERTING!"); //--- Print error message if failed
      return;
   }
Here, we are copying data from the "fractals_up" and "fractals_down" buffers of the "handle_Fractals" indicator into their respective arrays. We use the CopyBuffer function to retrieve data from the indicator handle. Specifically, we are attempting to copy 3 data points starting from the third most recent bar (index 2) for both the upward and downward fractals.
First, we check if the function returns a value that is less than 3, which would indicate that fewer than 3 values were successfully copied into the "fractals_up" array. If this happens, we print an error message ("ERROR: UNABLE TO COPY THE FRACTALS UP DATA. REVERTING!") and exit the function to prevent any further processing with incomplete data.
Similarly, we attempt to copy the downward fractal data into the "fractals_down" array using the same CopyBuffer function. Again, if the copying fails (less than 3 values are returned), we print a corresponding error message ("ERROR: UNABLE TO COPY THE FRACTALS DOWN DATA. REVERTING!") and exit the function to avoid further issues. This approach ensures that our program does not proceed with invalid or incomplete data, thus maintaining the integrity of our trading logic. By verifying that the correct number of values has been copied, we can prevent potential errors in the analysis of fractals, which are crucial for detecting market reversal points.
However, you could have noticed that the indicator buffer numbers vary, 0 and 1. These are crucial indices that you need to be keen on since they represent the actual mapping buffers of the indicator values. Here is an illustration for us to understand why we use the specific indices.
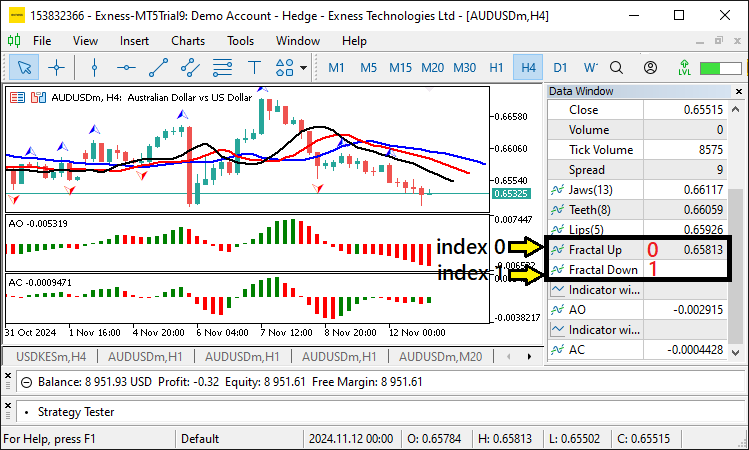
From the image, we can see that the fractal up is the first, hence being index 0, and the fractal down is the second at index 1. Via the same logic, we map the alligator lines.
   if (CopyBuffer(handle_Alligator,0,0,3,alligator_jaws) < 3){ //--- Copy Alligator's Jaw data
      Print("ERROR: UNABLE TO COPY THE ALLIGATOR JAWS DATA. REVERTING!");
      return;
   }
   if (CopyBuffer(handle_Alligator,1,0,3,alligator_teeth) < 3){ //--- Copy Alligator's Teeth data
      Print("ERROR: UNABLE TO COPY THE ALLIGATOR TEETH DATA. REVERTING!");
      return;
   }
   if (CopyBuffer(handle_Alligator,2,0,3,alligator_lips) < 3){ //--- Copy Alligator's Lips data
      Print("ERROR: UNABLE TO COPY THE ALLIGATOR LIPS DATA. REVERTING!");
      return;
   }
Here, since the buffers are in 3 lines, you can see the buffer indices start from 0 through 1 to 2. In the case where there is only one buffer, as for the case of the AO indicator, we would have only a buffer index 0 for the prices as below.
   if (CopyBuffer(handle_AO,0,0,3,ao_values) < 3){ //--- Copy AO data
      Print("ERROR: UNABLE TO COPY THE AO DATA. REVERTING!");
      return;
   }
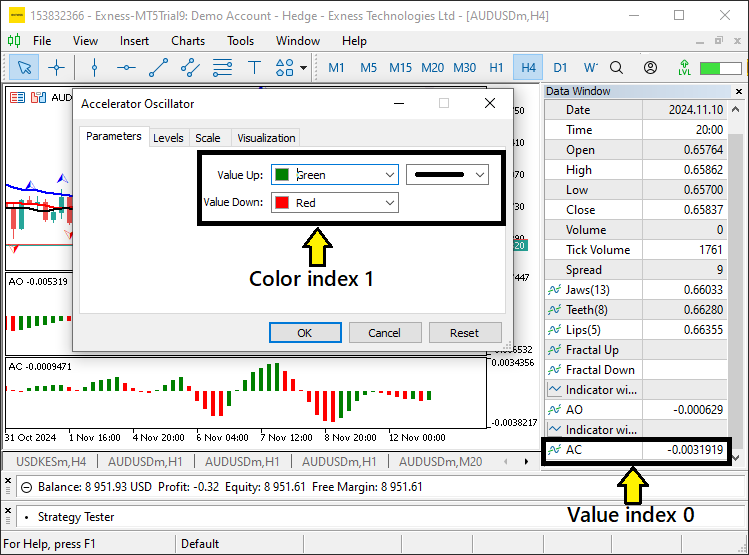
The same case would apply to the AC indicator if we would be interested in its values. However, we only need to know the color of the histogram formed. These can be acquired by using the same buffer number logic, but in this case, the color buffers are mostly mapped in the next unavailable buffer index in the data window. Thus, in our case, it is 0+1=1 as follows.
   if (CopyBuffer(handle_AC,1,0,3,ac_color) < 3){ //--- Copy AC color data
      Print("ERROR: UNABLE TO COPY THE AC COLOR DATA. REVERTING!");
      return;
   }
Actually to get the color buffers you can just open the indicator property window and the colors index will appear on the parameters tab.
After retrieving and storing the data, we can then use it to make trading decisions. To save resources, we will run checks on every bar and not on every tick that is generated. Thus, we need logic to detect new bar formations.
if (isNewBar()){ //--- Check if a new bar has formed

//---

}
Here, we utilize a custom function whose code snippet is as below.
//+------------------------------------------------------------------+
//|   IS NEW BAR FUNCTION                                            |
//+------------------------------------------------------------------+
bool isNewBar(){
   static int prevBars = 0; //--- Store previous bar count
   int currBars = iBars(_Symbol,_Period); //--- Get current bar count for the symbol and period
   if (prevBars == currBars) return (false); //--- If bars haven't changed, return false
   prevBars = currBars; //--- Update previous bar count
   return (true); //--- Return true if new bar is detected
}
Here, we define a boolean function called "isNewBar" that checks if a new bar has appeared on the chart, which will help us detect when a new candle or bar is formed, which is essential for updating or recalculating trading conditions. We start by declaring a static integer variable "prevBars" and initializing it to 0. The keyword "static" ensures that the value of "prevBars" is retained across multiple calls to the function, instead of being reset each time the function is called. This allows us to store the number of bars from the previous function call.
Next, we define a local integer variable "currBars" and use the built-in function iBars to retrieve the current number of bars for the selected symbol (_Symbol) and period (_Period). This function counts the total number of bars available for the given timeframe and stores it in "currBars".
We then compare "prevBars" with "currBars". If the two values are equal, this means no new bar has been formed since the last time the function was called, so we return "false" to indicate that no new bar is detected. If the number of bars has changed (i.e., a new bar has formed), the condition fails, and we update "prevBars" with the current bar count ("currBars") to keep track of the new value. Finally, we return "true" to signal that a new bar has been detected.
Now within this function, we can determine and store the fractal data by checking and updating the value and direction of the last detected fractal based on the data stored in the "fractals_up" and "fractals_down" arrays.
const int index_fractal = 0;
if (fractals_up[index_fractal] != EMPTY_VALUE){ //--- Detect upward fractal presence
   lastFractal_value = fractals_up[index_fractal]; //--- Store fractal value
   lastFractal_direction = FRACTAL_UP; //--- Set last fractal direction as up
}
if (fractals_down[index_fractal] != EMPTY_VALUE){ //--- Detect downward fractal presence
   lastFractal_value = fractals_down[index_fractal];
   lastFractal_direction = FRACTAL_DOWN;
}
We start by defining a constant integer "index_fractal" and setting it to 0. This constant will represent the index of the current fractal data that we want to check. In this case, we're checking the first fractal in the arrays.
Next, we check if the value at "fractals_up[index_fractal]" is not equal to EMPTY_VALUE, which indicates that there is a valid upward fractal present. If this condition is true, we proceed to store the value of the upward fractal in the "lastFractal_value" variable. We also updated the "lastFractal_direction" to "FRACTAL_UP" to indicate that the last detected fractal was an upward fractal.
Similarly, we check if the value at "fractals_down[index_fractal]" is not equal to EMPTY_VALUE, which indicates the presence of a downward fractal. If this condition is true, we store the downward fractal value in the "lastFractal_value" variable and set "lastFractal_direction" to "FRACTAL_DOWN" to reflect that the last fractal detected was downward. We can then log the data acquired and check its validity.
if (lastFractal_value != 0.0 && lastFractal_direction != FRACTAL_NEUTRAL){ //--- Ensure fractal is valid
   Print("FRACTAL VALUE = ",lastFractal_value);
   Print("FRACTAL DIRECTION = ",getLastFractalDirection());
}
This will log the Fractals data. We used a custom function to get the fractal direction and its code snippet is as below.
//+------------------------------------------------------------------+
//|     FUNCTION TO GET FRACTAL DIRECTION                            |
//+------------------------------------------------------------------+

string getLastFractalDirection(){
   string direction_fractal = "NEUTRAL"; //--- Default direction set to NEUTRAL

   if (lastFractal_direction == FRACTAL_UP) return ("UP"); //--- Return UP if last fractal was up
   else if (lastFractal_direction == FRACTAL_DOWN) return ("DOWN"); //--- Return DOWN if last fractal was down

   return (direction_fractal); //--- Return NEUTRAL if no specific direction
}
Here, we define the function "getLastFractalDirection" to determine and return the direction of the last detected fractal. The function works by checking the value of the "lastFractal_direction" variable, which keeps track of the most recent fractal direction (either upward or downward). We begin by initializing a string variable "direction_fractal" and setting it to "NEUTRAL" by default. This means that, if no valid direction is found or the fractal direction has not been updated, the function will return "NEUTRAL" as the result.
Next, we check the value of the "lastFractal_direction" variable. If it equals "FRACTAL_UP" (indicating the last detected fractal was an upward fractal), the function returns the string "UP". If "lastFractal_direction" equals "FRACTAL_DOWN" (indicating the last detected fractal was a downward fractal), the function returns the string "DOWN". If neither of these conditions are met (meaning that no upward or downward fractal was detected or the direction is still neutral), the function returns the default "NEUTRAL" value, indicating there is no specific direction at the moment.
We can also log the other indicators' data as follows.
Print("ALLIGATOR JAWS = ",NormalizeDouble(alligator_jaws[1],_Digits));
Print("ALLIGATOR TEETH = ",NormalizeDouble(alligator_teeth[1],_Digits));
Print("ALLIGATOR LIPS = ",NormalizeDouble(alligator_lips[1],_Digits));

Print("AO VALUE = ",NormalizeDouble(ao_values[1],_Digits+1));

if (ac_color[1] == AC_COLOR_UP){
   Print("AC COLOR UP GREEN = ",AC_COLOR_UP);
}
else if (ac_color[1] == AC_COLOR_DOWN){
   Print("AC COLOR DOWN RED = ",AC_COLOR_DOWN);
}
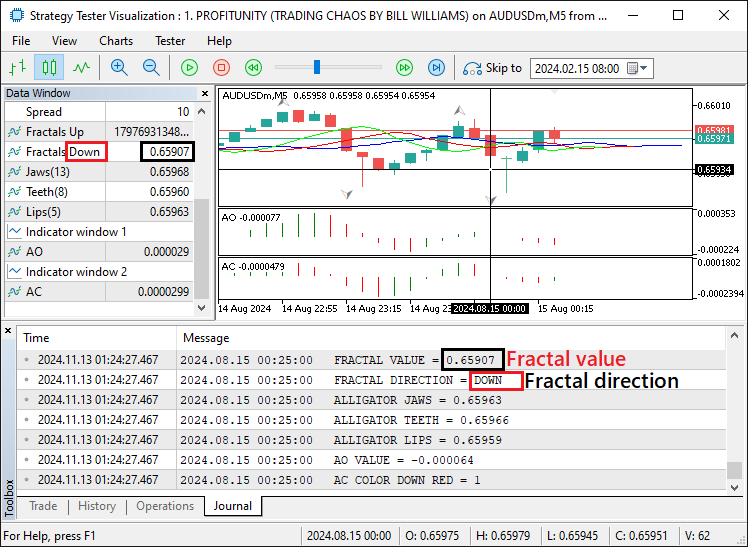
Upon run, we get the following output:
Fractals Confirmation:
Other Indicators Confirmation:
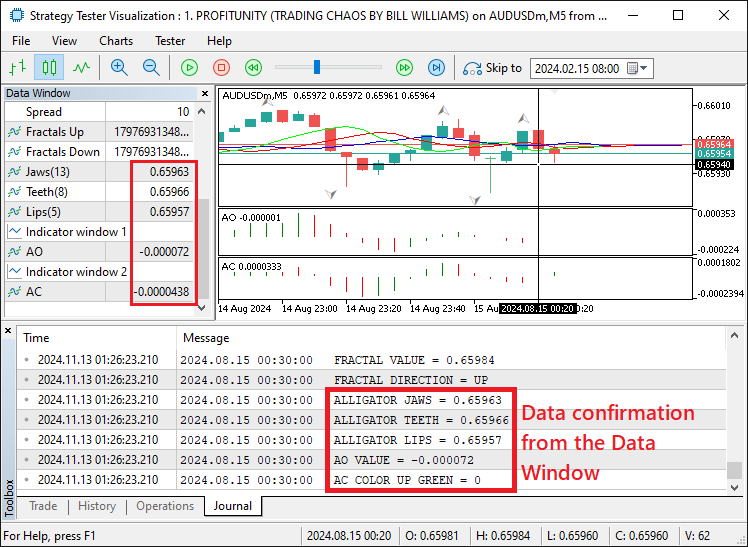
From the visualization, we can see that the retrieved data rhymes with the actual data as seen on the data window, which is a success. We can then continue to use this data for trading purposes. First, we define some necessary functions that we will use to make the analysis as follows.
//+------------------------------------------------------------------+
//|        FUNCTION TO GET CLOSE PRICES                              |
//+------------------------------------------------------------------+

double getClosePrice(int bar_index){
   return (iClose(_Symbol, _Period, bar_index)); //--- Retrieve the close price of the specified bar
}

//+------------------------------------------------------------------+
//|        FUNCTION TO GET ASK PRICES                                |
//+------------------------------------------------------------------+

double getAsk(){
   return (NormalizeDouble(SymbolInfoDouble(_Symbol, SYMBOL_ASK), _Digits)); //--- Get and normalize the Ask price
}

//+------------------------------------------------------------------+
//|        FUNCTION TO GET BID PRICES                                |
//+------------------------------------------------------------------+

double getBid(){
   return (NormalizeDouble(SymbolInfoDouble(_Symbol, SYMBOL_BID), _Digits)); //--- Get and normalize the Bid price
}
Here, we define 3 functions to get the closing, ask, and bid prices respectively. Next, we need to define boolean variables to check for potential trading signals based on the "Alligator's Jaw" line as below.
bool isBreakdown_jaws_buy = alligator_jaws[1] < getClosePrice(1) //--- Check if breakdown for buy
                            && alligator_jaws[2] > getClosePrice(2);
bool isBreakdown_jaws_sell = alligator_jaws[1] > getClosePrice(1) //--- Check if breakdown for sell
                            && alligator_jaws[2] < getClosePrice(2);
First, we define "isBreakdown_jaws_buy" to detect a breakdown condition for a potential buy signal. The condition is that the value of the "alligator_jaws" array at index 1 (representing the previous bar) should be less than the close price of the previous bar, which is retrieved by calling the "getClosePrice(1)" function. Additionally, the value of the "alligator_jaws" array at index 2 (representing the bar before that) should be greater than the close price of the bar before that, which is retrieved by calling the "getClosePrice(2)" function. This combination suggests that the Alligator's Jaw line has crossed below the close price of the previous bar but was above the close price of the bar before that, which could be interpreted as a potential setup for a buy trade.
Next, we define "isBreakdown_jaws_sell" to detect a breakdown condition for a potential sell signal. In this case, the "alligator_jaws" value at index 1 should be greater than the close price of the previous bar, and the "alligator_jaws" value at index 2 should be less than the close price of the bar before that. This scenario indicates that the Alligator's Jaw line has crossed above the close price of the previous bar but was below the close price of the bar before that, suggesting a potential setup for a sell trade. From here we can define the rest of the conditions for open positions.
if (lastFractal_direction == FRACTAL_DOWN //--- Conditions for Buy signal
   && isBreakdown_jaws_buy
   && ac_color[1] == AC_COLOR_UP
   && (ao_values[1] > 0 && ao_values[2] < 0)){
   Print("BUY SIGNAL GENERATED");
   obj_Trade.Buy(0.01,_Symbol,getAsk()); //--- Execute Buy order
}
else if (lastFractal_direction == FRACTAL_UP //--- Conditions for Sell signal
   && isBreakdown_jaws_sell
   && ac_color[1] == AC_COLOR_DOWN
   && (ao_values[1] < 0 && ao_values[2] > 0)){
   Print("SELL SIGNAL GENERATED");
   obj_Trade.Sell(0.01,_Symbol,getBid()); //--- Execute Sell order
}
Here, we implement the logic for executing buy and sell signals based on the combination of indicators, specifically the fractal direction, Alligator jaw breakdown, Accelerator Oscillator (AC) color state, and Awesome Oscillator (AO) values.
First, we check if the conditions for a buy signal are met. We verify that the "lastFractal_direction" is set to "FRACTAL_DOWN", meaning the last detected fractal was a downward fractal. Then, we check if the "isBreakdown_jaws_buy" condition is true, which signals that the Alligator's Jaw line has crossed below the price and is now set up for a potential buy.
Additionally, we ensure that the "ac_color[1]" is equal to "AC_COLOR_UP", meaning the Accelerator Oscillator is in an upward color state, indicating a bullish market sentiment. Finally, we check the values of the Awesome Oscillator: "ao_values[1]" should be greater than zero (indicating a positive momentum), and "ao_values[2]" should be less than zero (indicating a previous negative momentum). This combination suggests that there is a reversal in momentum, with the market shifting from negative to positive. If all these conditions are satisfied, a buy signal is generated, and we execute a buy order with the specified lot size (0.01) at the asking price.
On the other hand, we check if the conditions for a sell signal are met. We verify that the "lastFractal_direction" is set to "FRACTAL_UP", meaning the last detected fractal was an upward fractal. Then, we check if the "isBreakdown_jaws_sell" condition is true, which signals that the Alligator's Jaw line has crossed above the price and is now set up for a potential sell order.
Additionally, we ensure that the "ac_color[1]" is equal to "AC_COLOR_DOWN", meaning the Accelerator Oscillator is in a downward color state, indicating a bearish market sentiment. Finally, we check the values of the Awesome Oscillator: "ao_values[1]" should be less than zero (indicating a negative momentum), and "ao_values[2]" should be greater than zero (indicating a previous positive momentum). This combination suggests that the market is reversing from positive to negative momentum. If all these conditions are satisfied, a sell signal is generated, and we execute a sell order with the specified lot size (0.01) at the bid price.
This will open the positions. However, you can see that there are no exit orders placed and thus the positions will hang. We thus need logic to close the positions based on AO indicator reversals.
if (ao_values[1] < 0 && ao_values[2] > 0){ //--- Condition to close all Buy positions
   if (PositionsTotal() > 0){
      Print("CLOSE ALL BUY POSITIONS");
      for (int i=0; i<PositionsTotal(); i++){
         ulong pos_ticket = PositionGetTicket(i); //--- Get position ticket
         if (pos_ticket > 0 && PositionSelectByTicket(pos_ticket)){ //--- Check if ticket is valid
            ENUM_POSITION_TYPE pos_type = (ENUM_POSITION_TYPE)PositionGetInteger(POSITION_TYPE);
            if (pos_type == POSITION_TYPE_BUY){ //--- Close Buy positions
               obj_Trade.PositionClose(pos_ticket);
            }
         }
      }
   }
}
else if (ao_values[1] > 0 && ao_values[2] < 0){ //--- Condition to close all Sell positions
   if (PositionsTotal() > 0){
      Print("CLOSE ALL SELL POSITIONS");
      for (int i=0; i<PositionsTotal(); i++){
         ulong pos_ticket = PositionGetTicket(i); //--- Get position ticket
         if (pos_ticket > 0 && PositionSelectByTicket(pos_ticket)){ //--- Check if ticket is valid
            ENUM_POSITION_TYPE pos_type = (ENUM_POSITION_TYPE)PositionGetInteger(POSITION_TYPE);
            if (pos_type == POSITION_TYPE_SELL){ //--- Close Sell positions
               obj_Trade.PositionClose(pos_ticket);
            }
         }
      }
   }
}
Here, we implement a logic to close all active positions (buy or sell) based on the values of the Awesome Oscillator (AO). First, we check for a condition to close all buy positions. If "ao_values[1]" is less than 0 and "ao_values[2]" is greater than 0, it indicates a potential shift from negative momentum to positive momentum. This is the condition for closing all buy positions. To do this, we first check if any open positions are in existence using the PositionsTotal function.
If there are positions, we loop through each position, retrieving the ticket number of each one using the PositionGetTicket function. For each position, we validate the ticket with the PositionSelectByTicket function, ensuring it is a valid position. Then, we retrieve the position type using PositionGetInteger and cast it to the ENUM_POSITION_TYPE enum. If the position type is POSITION_TYPE_BUY, meaning it is a buy position, we close it using "obj_Trade.PositionClose(pos_ticket)" and print "CLOSE ALL BUY POSITIONS" for confirmation.
Next, we check for a condition to close all Sell positions. If "ao_values[1]" is greater than 0 and "ao_values[2]" is less than 0, it indicates a potential shift from positive momentum to negative momentum, signaling the need to close all sell positions. Similarly, we first check if there are any open positions. If there are, we loop through them, retrieve the position tickets, validate the tickets, and check the position type. If the position type is POSITION_TYPE_SELL, meaning it is a sell position, we close it using "obj_Trade.PositionClose(pos_ticket)" and print "CLOSE ALL SELL POSITIONS" for confirmation.
Once we run the program, we get the following output.
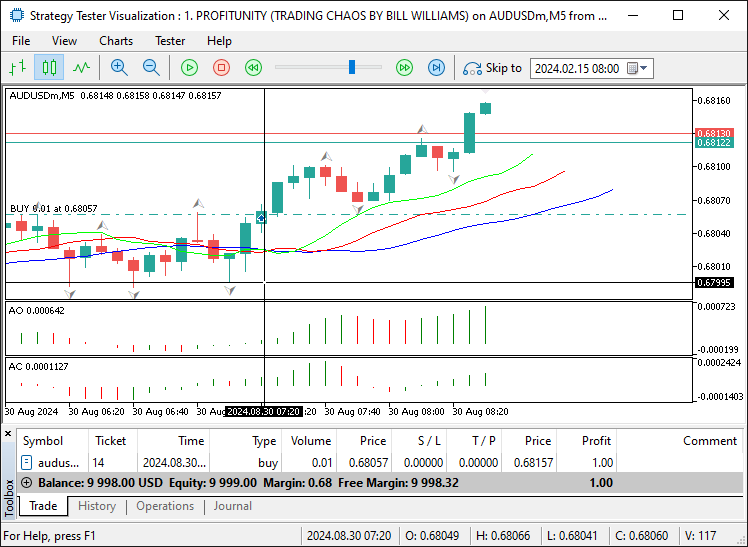
That was a success. We can see that we confirmed and opened the buy position when all the entry conditions were met. That is all for the strategy implementation. We now need to test the program in the Strategy Tester and optimize it if necessary for it to adapt to the current market conditions. That is done in the next section below.
Strategy Testing and Optimization
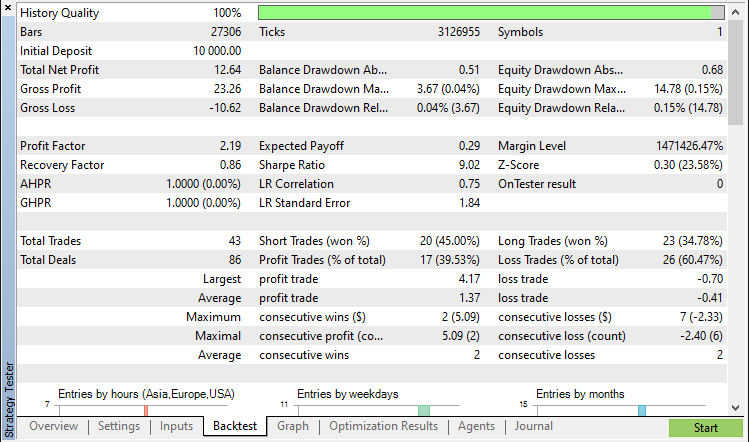
After completing the core implementation, the next phase now involves testing our Expert Advisor (EA) using the MetaTrader 5 Strategy Tester to evaluate its performance accurately within various market scenarios. This testing stage is to verify the strategy's behavior in line with our expectations and identify any adjustments needed to optimize outcomes. Here, we have already completed an initial optimization, focusing specifically on parameters integral to our strategy.
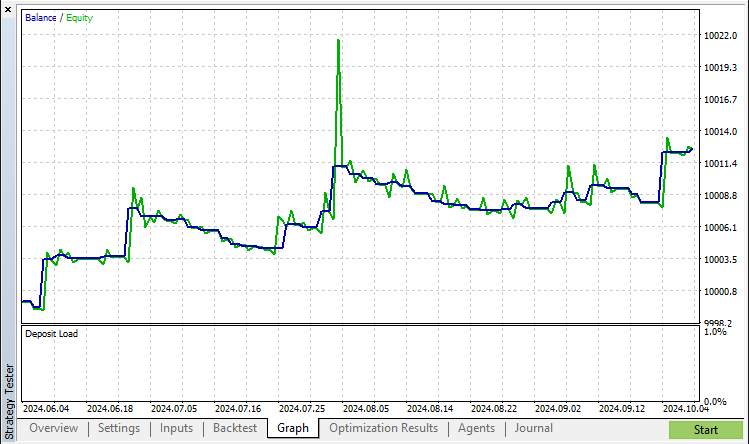
We have paid particular attention to the fractal and alligator line thresholds to evaluate the EA’s responsiveness in different trading sessions and conditions. This thorough testing has allowed us to validate that the program adheres to the expected buy and sell signals with efficient trade handling, enhancing reliability and performance while minimizing potential errors. Here are the results that we acquired from the testing process.
Backtest Results:
Backtest Graph:
Conclusion
In this article, we explore the process of creating an MQL5 Expert Advisor (EA) using the Profitunity trading strategy, integrating fractals, the Alligator indicator, and oscillators like the Awesome and Accelerator Oscillators to identify strategic buy and sell signals. Starting with the core indicators and threshold-based conditions, we automate trade signals that leverage market momentum and price breakouts. Each step involves careful code construction, configuring indicator handles, and implementing logic to trigger buy and sell trades according to the strategy’s criteria. After completing the implementation, we rigorously tested the EA using MetaTrader 5’s Strategy Tester to validate its responsiveness and reliability in various market conditions, emphasizing accuracy in trade execution through optimized parameters.
This article provides a structured approach to automating trading signals in MQL5 using the Profitunity strategy. We hope it encourages you to further explore MQL5 development, inspiring the creation of more sophisticated and profitable trading systems. Happy coding and successful trading!
 Neural Networks Made Easy (Part 93): Adaptive Forecasting in Frequency and Time Domains (Final Part)
 Connexus Observer (Part 8): Adding a Request Observer
 Data Science and ML (Part 32): Keeping your AI models updated, Online Learning
 Chemical reaction optimization (CRO) algorithm (Part I): Process chemistry in optimization
- Free trading apps
- Over 8,000 signals for copying
- Economic news for exploring financial markets
You agree to website policy and terms of use