
Introduction to MQL5 (Part 9): Understanding and Using Objects in MQL5
Introduction
Welcome back to our MQL5 series! We'll discuss a fascinating subject in this chapter that I believe you'll find very useful and fascinating. We will begin a project where we will work with different chart objects in MQL5, which will be an essential foundation for our future projects. This starting point will be especially handy when we go into more complex projects, like using various harmonic patterns. Chart objects in MQL5 are graphical elements that can be placed on trading charts to visually represent various types of data, including price levels, trade zones, and text annotations. These objects offer traders and developers the flexibility to create customized visuals that enhance chart analysis, making it easier to identify market trends, key price levels, and trading opportunities.
Different chart objects are available in MQL5, ranging from basic lines and shapes to intricate components like text, arrows, and custom indicators. A highly customized trading environment can be created by altering the color, size, position, and other attributes of each object. Chart objects are more than just decorative accents; they are effective instruments for producing clear, understandable visual representations of market data. For instance, it may be simpler to identify possible reversal points if support and resistance levels are highlighted with rectangles. Through a practical project, this article will introduce you to the idea of chart objects in MQL5 and show you how to use them.
We'll develop an Expert Advisor (EA) in this project that improves trading by displaying clear visualizations right on the chart. The route from the entry point to the stop loss and take profit zones will be automatically displayed by the EA, providing you with a quick visual evaluation of the risk and reward of your trade. Without requiring you to consult other data sources, the EA will update in real-time to reflect your current profit or loss as the market moves. In addition, it will provide precise information at a glance by displaying the entry, stop loss, and take profit prices for the current position under observation.
The adaptability of this EA to modifications in your trade setup is one of its primary characteristics. Your visual cues will always be up-to-date because the EA will instantly update the chart when you modify your take profit or stop loss levels. The EA also adjusts to the length of your trade. When you hold the trade longer, the EA will gradually adjust itself so that the visual elements become more visible. This will enable you to monitor the trade effectively with various timeframes, even though at first they might not be very noticeable on higher time frames. It is now simpler to manage trades from lower timeframes and keep track of them as they change thanks to this dynamic adaptation
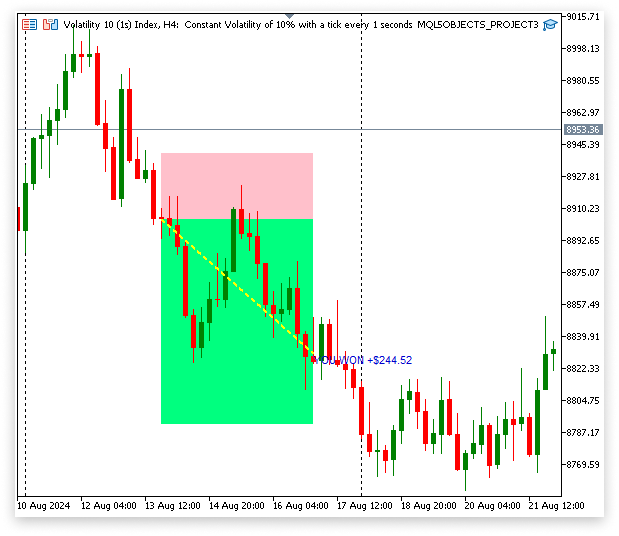
The EA lets you examine previous trades, which provides insightful historical analysis. It helps you assess your trading performance and make wise decisions by showing you how much you won or lost in prior positions. You can see historical data directly on the chart by defining the date range. This gives you a thorough overview of your trading history and the option to zoom in on specific trades for more in-depth analysis.
Current Trade Visualization: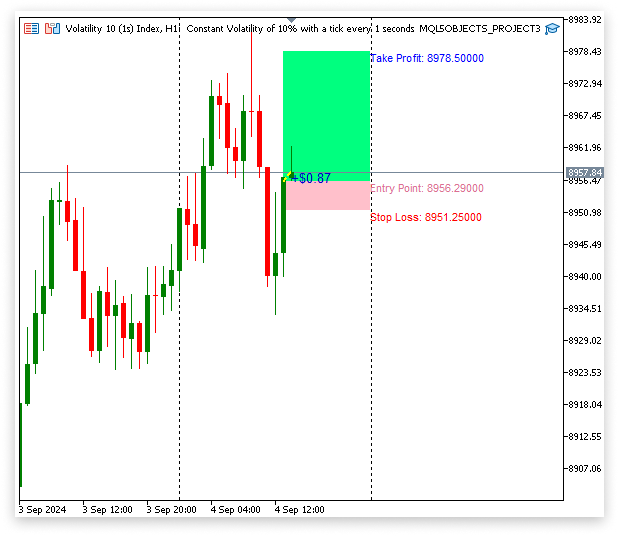
Historical Trade Insights:
In this article, you'll learn:
- Creating and Modifying Chart Objects for Enhanced Visual Analysis
- Looping Through Positions to Efficiently Manage and Display Trades on the Chart
- Utilizing Historical Deal Data to Inform Chart Object Placement
- Visualizing Historical Deal Profit/Loss on the Chart for Performance Tracking
- Using datetime Conversions to Accurately Time Chart Object Creations
- Annotating Entry, Take Profit (TP), and Stop Loss (SL) Details on the Chart
- Using Input Parameters to Customize Your Expert Advisor
This project aims to familiarize you with the useful applications of chart objects in MQL5. This practical approach will teach you how to manage trades, improve visual analysis, and display important trading data right on your charts by efficiently integrating and modifying chart objects within your Expert Advisor (EA). To help you better understand how to use these tools for trading decisions and performance tracking, this project will walk you through the process of creating, modifying, and managing various chart objects.
1. Chart Objects in MQL5
1.1. What Are Chart Objects?
Chart objects in MQL5 are visual components that traders can include in their charts to improve analysis and decision-making. These objects can be more complicated elements like channels or arrows, or they can be simpler shapes, lines, and text. Chart objects are primarily used to visually represent significant data, which helps traders plan trades, assess market conditions, and keep track of open positions. Chart objects allow you to highlight significant price levels and draw trend lines on the chart that indicate the direction of the market. By visualizing this data on the chart, traders can make well-informed trading decisions and quickly assess market conditions instead of depending solely on numerical data.
1.2. Why is Customizing Chart Objects Important?
You can improve the visual clarity of your trading charts and help yourself make better decisions by customizing the chart objects. By altering these objects' color, size, or position, you can make the chart more suited to your trading preferences and style. You can use this customization to make the most important information stand out at a glance by emphasizing it.
If your attention is on support and resistance levels, you may want to use bold, thick lines that stand out in vivid colors and are simple to see even when quickly scanning the chart. You lower your chance of overlooking crucial signals during a hectic trading session by doing this. Similar to this, making text annotations stand out more can serve as a visual cue to help you remember important trade decisions or planned strategies.
1.3. Chart Objects We Will Be Using for the Project
Several important MQL5 chart objects will be used in this project to improve our trading analysis. The chart objects that we will be utilizing are the following:
1.3.1. Trend Lines
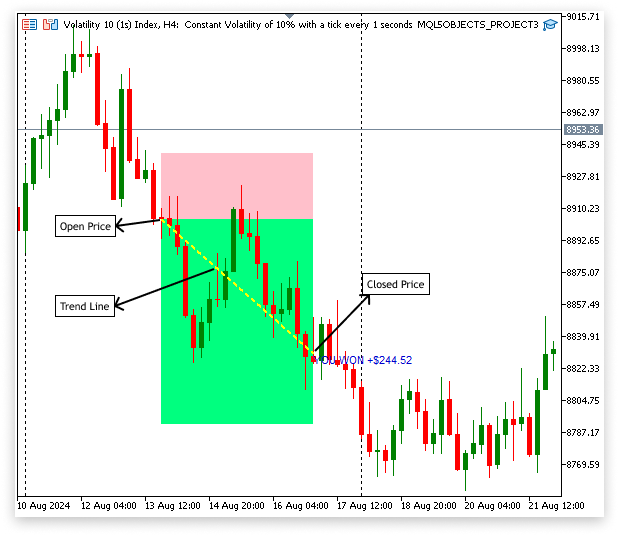
An essential tool in our project is the trend line, which is mainly used to track the current market price concerning important trend levels and identify the point of entry. To determine the overall direction of the market, we will draw a trend line between important price points. As the market price changes (or "ticks"), the trend line updates in real-time, so it will continuously extend from the initial entry price to the most recent market price.
This ensures that the trend line always reflects the most recent price data, assisting in accurately tracking the performance of the trade and making decisions about managing the position. The trend line often begins at the price at which the position was entered, reflecting the starting point of the trade. The line extends to the current market price or ask price. This shows how the price has moved since the trade was opened.
1.3.2. Text Labels
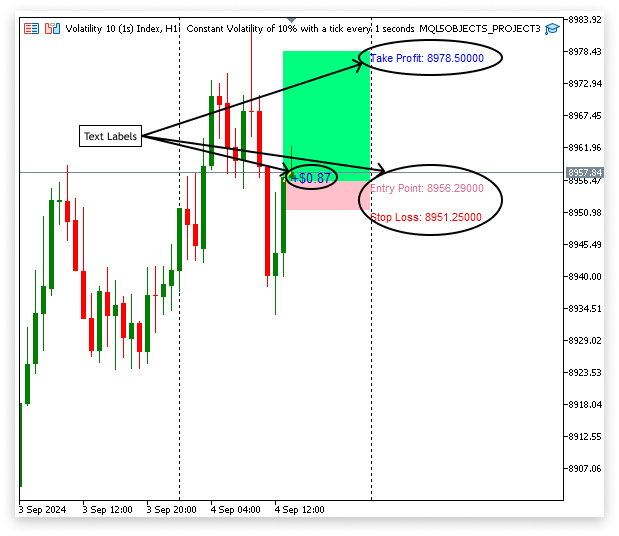
As comments on the chart show, text labels offer clear, understandable details about different facets of a trade. Important information like entry points, stop-loss levels, take-profit targets, and any other pertinent notes for the trading strategy can be shown on them. By adding text labels to significant areas of the chart, you can easily retrieve vital information without using external notes or your memory. This visual aid makes it easier to have all the information you need on hand when making decisions.
A text label indicating the open position's current profit or loss will appear with each tick. With this real-time update, you can keep an eye on their trade's performance as the market moves, and you can get an instant sense of whether the trade is heading in the right direction. With a label such as +$100 or -$50 next to the trade, the current profit or loss will be shown in real-time as the market ticks. This enables you to monitor the performance of your trade and make necessary adjustments.
1.3.3. Rectangle Objects
Rectangular objects can be used to indicate support and resistance levels on a chart, among other things. But in this project, their use will be limited to identifying winning and losing zones in a trade. When a position is presently losing money, we will draw a rectangle from the entry point to the stop-loss level. This helps us quickly recognize when the position is getting close to the stop-loss by visually representing the area where the trade is going in a negative direction. A rectangle will be drawn from the entry point to the take-profit level once the position is in profit. This helps us track the trade's progress toward the take-profit target by highlighting the areas where it is performing well.
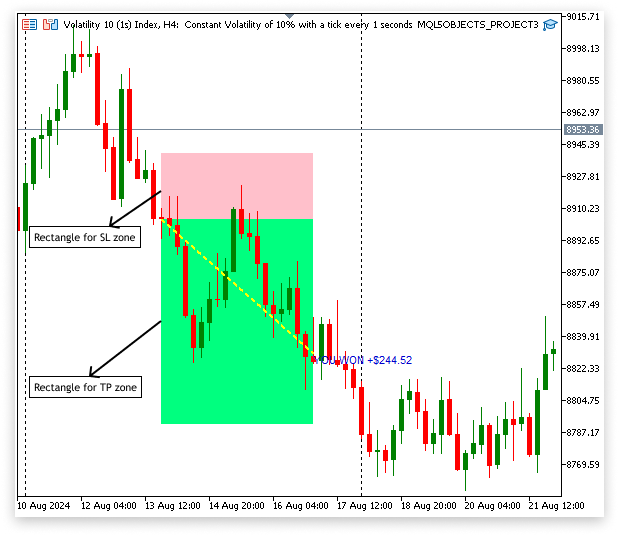
There are many different chart objects available in MQL5, and each one is intended to improve trading analysis in a particular way. It would be too much to cover all of these items in one article, though. I've narrowed the focus to just the items that will be utilized in our project because of this. These chosen objects, which include rectangles, trend lines, and text labels, are not only essential for this specific strategy but also have creation and modification processes that are comparable to those of other MQL5 objects. You will acquire the fundamental knowledge required to work with various chart objects in MQL5, using comparable methods to create and modify them in accordance with your trading needs, by grasping the concepts and strategies for these particular objects.
2. Creating and Customizing Objects
We'll concentrate on creating and modifying different chart objects in MQL5 in this section. Creating objects such as rectangles, trend lines, and text labels will be demonstrated, along with how to adjust their color, style, and width to fit your trading plan.
2.1. Pseudocode
In this project, pseudocode is essential because, before writing any code, it offers a well-organized and concise summary of the reasoning and procedures required to accomplish our objectives. It assists in decomposing difficult tasks into smaller, more manageable components, which facilitates planning, helps spot possible problems, and guarantees that the code we write is efficient and well-organized. Pseudocode allows us to visualize the Expert Advisor's whole flow, which makes it easier to implement chart objects and other features.
This is our EA's basic pseudocode:
1. Initialization:
- Define colors for the SL zone, TP zone, and trend line.
- Set the position index.
- Specify whether to show historical data.
- Define the start and end dates for historical data.
- Set the time for closing the zone.
- Get the current chart ID.
- Initialize variables for storing position details (open price, stop loss, take profit, profit, open time).
2. On Every Tick:
- Convert the string time to a datetime object for the close zone.
- Obtain the current ask price.
- Loop through all positions.
- Get the ticket number for the position.
- Check if the position matches the chart symbol.
- Retrieve details: open price, stop loss, take profit, open time, and profit.
- If the position matches the specified index.
- Create and configure SL zone rectangle.
- Set the properties (color, style, width, fill).
- Create and configure TP zone rectangle.
- Set the properties (color, style, width, fill).
- Create and configure trend line.
- Set the properties (color, style, width).
- Calculate and display position profit.
- Format and display profit as text.
- Create and configure text objects for Entry, TP, and SL:
- Set the properties (color, font size).
3. If Historical Data Display is enabled:
- Clear previous comments.
- Select and loop through historical deals within the specified date range:
- Get details for each deal (open price, close price, SL, TP, profit, times).
- Display profit/loss information.
- Create and configure SL zone, TP zone, and the trend line for historical deals:
- Set the properties (color, style, width).
2.2. Practical Application: Creating and Customizing Objects
2.2.1 Creation of Chart Objects
One essential tool in MQL5 that lets you create different types of objects on your trading chart is the ObjectCreate() function. These objects, which aid traders in better visualizing market data, analyzing trends, and marking important points on the chart, can include trend lines, rectangles, text labels, arrows, and more.
Beyond Just Creation: Specifying Object Placement
Not only can you create objects on the chart using ObjectCreate(), but its parameters also give you exact control over where these objects appear. You can target and improve the effectiveness of your analysis by placing these objects at specific locations on your chart and specifying specific parameters. Time and price are the two main factors that determine where items are placed on the chart. These elements serve as the anchor for the object on the chart at that specific location.
Syntax:
ObjectCreate(chart_id, object_name, object_type, sub_window, time1, price1, time2, price2, time3, price3);The Relationship between Time and Price in Object Placement
Every point on a trading chart in MQL5 is determined by the interaction of price (the vertical axis) and time (the horizontal axis). These two dimensions are used to specify the exact location of the object on the chart when you create it using ObjectCreate
Understanding Anchor Points: time1, price1, time2, price2, time3, price3
It's common to need to define one or more anchor points when using ObjectCreate() to create objects. The precise location of the object on the chart is established by these anchor points. These anchor points are the parameters time1, price1, time2, price2, time3, and price3.
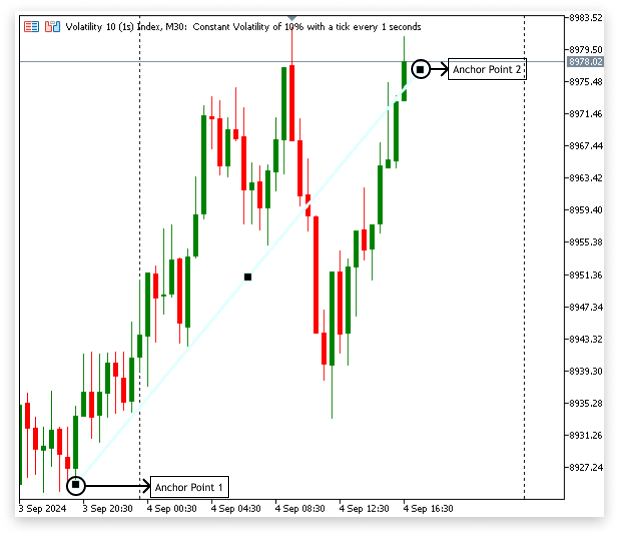
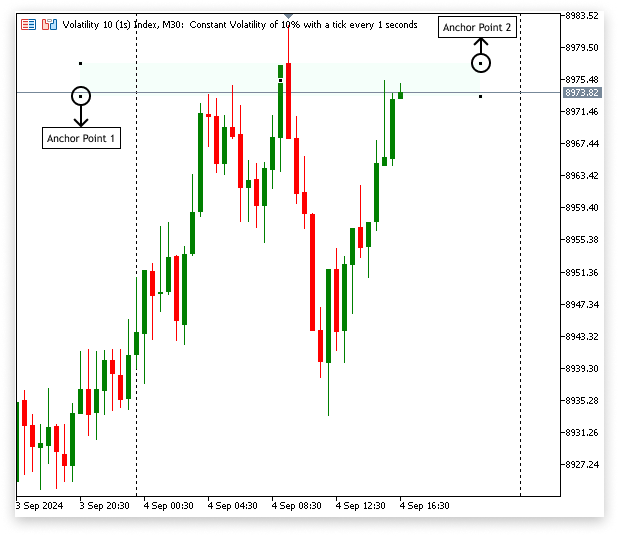
- time1 and price1: These parameters establish the object's initial anchor point. If you were drawing a trend line, for instance, time1 would indicate the start point's time (a particular candlestick, for example), and price1 would indicate the price level at that point.
- time2 and price2: Specify the object's second anchor point. This would be the line's endpoint in the trend line example. Price2 indicates the price level at that moment, and time2 indicates the time of the second point.
time3, price3: A third anchor point is necessary for certain more intricate objects, such as channels or triangles. You can specify this third point using time3 and price3, which may be required when drawing some shapes that require three coordinates.
// Get the ID of the current chart
long chart_id = ChartID();

//+------------------------------------------------------------------+
//| Script program start function                                    |
//+------------------------------------------------------------------+
void OnStart()
  {
// Define the first anchor point for the trendline
// 'time1' is the datetime for the first point, and 'price1' is the price at that time
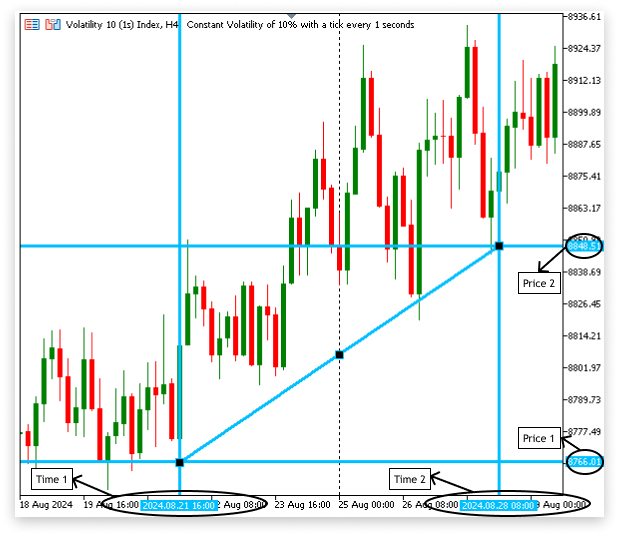
   datetime time1  = D'2024.08.21 16:00';
   double   price1 = 8766.01;

// Define the second anchor point for the trendline
// 'time2' is the datetime for the second point, and 'price2' is the price at that time
   datetime time2  = D'2024.08.28 08:00';
   double   price2 = 8854.51;

// Create a trendline object on the chart
// 'chart_id' is the ID of the chart where the object will be placed
// "Trend Line" is the name of the trendline object
// 'OBJ_TREND' specifies that the object is a trendline
// The last four parameters (0, time1, price1, time2, price2) specify the anchor points of the trendline
   ObjectCreate(chart_id, "Trend Line", OBJ_TREND, 0, time1, price1, time2, price2);
  }
Output:
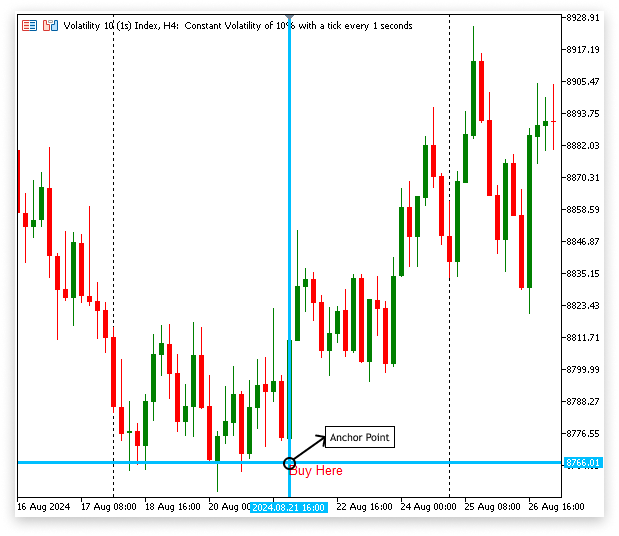
Text labels (OBJ_TEXT) can be positioned on the chart with just one anchor point. The anchor point indicates the location of the text based on the price and time coordinates that are provided. A text label on the chart that reads "Buy Here" at a particular moment and price.
Example:
// Get the ID of the current chart
long chart_id = ChartID();

//+------------------------------------------------------------------+
//| Script program start function                                    |
//+------------------------------------------------------------------+
void OnStart()
  {
// Define the time for the text label's position (August 21, 2024, at 16:00)
   datetime time1  = D'2024.08.21 16:00';

// Define the price level for the text label's position (8766.01)
   double   price1 = 8766.01;

// Create a text object named "Text" on the chart at the specified time and price
   ObjectCreate(chart_id, "Text", OBJ_TEXT, 0, time1, price1);

// Set the text content of the object to display "Buy Here"
   ObjectSetString(chart_id, "Text", OBJPROP_TEXT, "Buy Here");
  }
Output:
2.3. Customizing Objects
You can customize the visual components of chart objects to fit your trading style. To your delight, you can also modify their size, color, and style. To make a trend line stand out from other elements on the chart, for instance, you can change its color, thickness, and location to make sure they match important market levels. Similarly, text labels can be altered by changing the font and color scheme to draw attention to crucial details like profit targets or entry points.
Example:
// Define the time for the text label's position (August 21, 2024, at 16:00)
datetime time1  = D'2024.08.21 16:00';

// Define the price level for the text label's position (8766.01)
double   price1 = 8766.01;

// Create a text object named "Text" on the chart at the specified time and price
ObjectCreate(chart_id, "Text", OBJ_TEXT, 0, time1, price1);

// Set the text content of the object to display "Buy Here"
ObjectSetString(chart_id, "Text", OBJPROP_TEXT, "Buy Here");

// Set the color of the text object to Medium Blue
ObjectSetInteger(chart_id, "Text", OBJPROP_COLOR, clrMediumBlue);
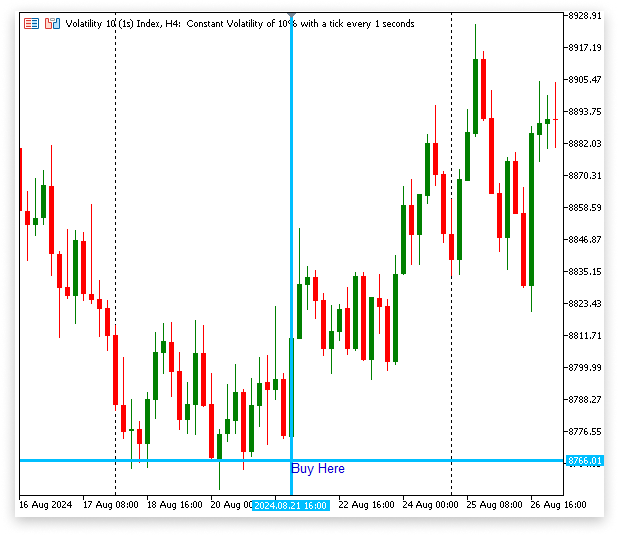
This code displays the text "Buy Here," adds a text label to the chart at a given time and price, and changes the text's color to Medium Blue.
Output:
2.3.1. Object Functions for Customizing Chart Objects in MQL5
Chart objects in MQL5 can be customized by utilizing various object functions. With the help of these functions, you can alter the look, feel, and location of chart objects to better meet your unique trading requirements.
Used to set integer-type properties of a chart object, such as color, width, and style.
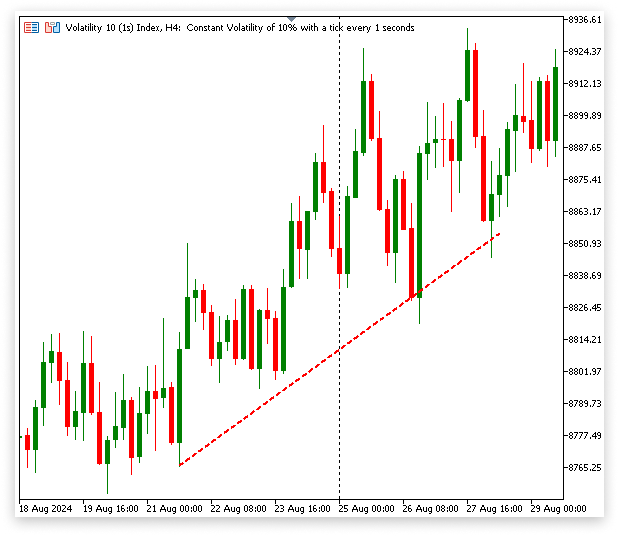
Example:// Get the ID of the current chart long chart_id = ChartID(); //+------------------------------------------------------------------+ //| Script program start function | //+------------------------------------------------------------------+ void OnStart() { datetime time1 = D'2024.08.21 16:00'; double price1 = 8766.01; // Define the second anchor point for the trendline // 'time2' is the datetime for the second point, and 'price2' is the price at that time datetime time2 = D'2024.08.28 08:00'; double price2 = 8854.51; // Create a trend line object on the chart with the name "Trend Line" // The trend line will be drawn from time1/price1 to time2/price2 ObjectCreate(chart_id, "Trend Line", OBJ_TREND, 0, time1, price1, time2, price2); // Set the style of the trend line to a dashed line ObjectSetInteger(chart_id, "Trend Line", OBJPROP_STYLE, STYLE_DASH); // Set the width of the trend line to 2 ObjectSetInteger(chart_id, "Trend Line", OBJPROP_WIDTH, 2); }
Output:
Sets double-type attributes, frequently about price or time. Example: Adjusting the coordinates of anchor points on a trend line.
Used to set string-type properties, such as the text displayed by a text label.
Example: Adding annotations or notes directly on the chart.
// Create a text object named "Text" on the chart at the specified time and price
ObjectCreate(chart_id, "Text", OBJ_TEXT, 0, time1, price1);

// Set the text content of the object to display "Buy Here"
ObjectSetString(chart_id, "Text", OBJPROP_TEXT, "Buy Here");
Different types of chart objects can be used to build, customize, and manage using various of object functions available in MQL5. These features are crucial for improving the way trading data is displayed visually on your charts. ObjectCreate and ObjectSetInteger are two important functions that we have discussed in our project, but there are many more. You can check the MQL5 documentation, which offers thorough details on all the available chart functions, for a more in-depth understanding of additional functions.
3. Implementing Chart Objects in Our Project
3.1. Creating Chart Objects for Current Positions
This section will concentrate on configuring chart objects to handle and present data regarding the current positions on the chart. To visually represent real-time trade data, this entails creating and modifying rectangles, trend lines, and text labels.
3.1.1. Using Rectangles to Highlight Areas
We are going to use two different rectangles to visually emphasize the critical zones on your chart where the Stop Loss (SL) and Take Profit (TP) levels are set. These rectangles will dynamically represent the SL and TP zones, so you can easily keep an eye on risk and reward levels at a glance.
a. Highlighting the SL Zone:
- Anchor 1: The first anchor of the SL zone rectangle will be placed at the entry price of the trade and the exact time the position was opened.
- Anchor 2: The second anchor will be positioned at the SL price and will extend horizontally to 23:59 of the current day. This extension ensures that the rectangle dynamically updates each day, expanding to cover the SL zone visually until the trade is either closed or the day ends.
- Purpose: This rectangle marks the risk area on the chart, allowing you to quickly identify how close the current price is to the SL level.
b. Highlighting the TP Zone:
- Anchor 1: The first anchor of the TP zone rectangle will also start from the entry price of the trade.
- Anchor 2: The second anchor, which extends horizontally to 23:59 on the current day, will be positioned at the TP price for the current position. Like the SL zone, the potential reward area will be continuously highlighted by this expanding rectangle every day.
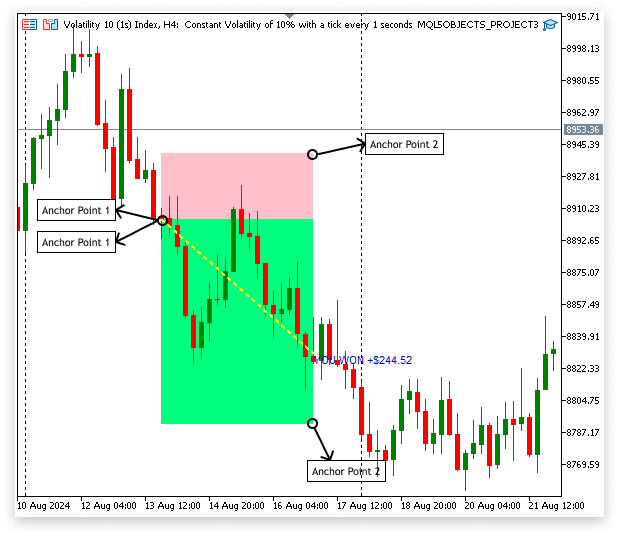
Rectangles highlighting the SL and TP zones can only be made after we programmatically retrieve the necessary information for every position. This covers the opening price, stop-loss (SL) level, take profit (TP) level, and the time the trade was opened. We make sure that the rectangles are appropriately positioned on the chart, matching the appropriate levels and times for every position, by retrieving these values programmatically. The rectangles can also dynamically update with new positions thanks to this automated method, which keeps the visual representation up-to-date and relevant at all times.
Example:
// Variables to store position details
double open_price;          // Variable to store the entry price of the position
double stop_loss;           // Variable to store the Stop Loss level of the position
double take_profit;         // Variable to store the Take Profit level of the position
datetime position_open_time; // Variable to store the open time of the position

//+------------------------------------------------------------------+
//| Expert tick function                                             |
//+------------------------------------------------------------------+
void OnTick()
  {
// Loop through all open positions
   for(int i = 0; i < PositionsTotal(); i++)
     {
      // Get the ticket number of the position at index 'i'
      ulong ticket = PositionGetTicket(i);

      // Retrieve and store the entry price of the position
      open_price = PositionGetDouble(POSITION_PRICE_OPEN);

      // Retrieve and store the Stop Loss level of the position
      stop_loss = PositionGetDouble(POSITION_SL);

      // Retrieve and store the Take Profit level of the position
      take_profit = PositionGetDouble(POSITION_TP);

      // Retrieve and store the open time of the position
      position_open_time = (int)PositionGetInteger(POSITION_TIME);

      // Print the retrieved values for debugging or verification
      Print("Open Price index ",i,": ",open_price);
      Print("SL index ",i,": ",stop_loss);
      Print("TP index ",i,": ",take_profit);
      Print("Open time index ",i,": ",position_open_time);
     }
  }
Explanation:
Every time the trading instrument's price ticks, or changes, the OnTick function runs the code. Important information is retrieved about each open position in the trading account. All open positions in the trading account are looped through. The function PositionsTotal() returns specific information about each position based on its index in the total list of positions. Use the PositionGetDouble and PositionGetInteger functions to retrieve these details. For debugging or verification, the retrieved data is printed to the terminal before any visual elements are added to the chart, such as rectangles highlighting the SL and TP zones. This guarantees that accurate data is collected.
Two issues will arise from the current implementation:
- Identifying the Exact Position: As it stands, the EA does not know which precise position it is looping through to obtain the time and price data. This means that when we only want information from a particular position, the code will extract data from all open positions, which could cause confusion or incorrect data to be used.
- Data Specific to the Chart Instrument: The information that is being retrieved needs to be related to the open positions and trades involving the instrument that is presently shown on the chart. The EA could extract data from the positions of other instruments that wouldn't be relevant to the current chart if the symbol on the chart wasn't filtered out, which could result in inaccurate or deceptive visual representations.
Providing an input where the user can choose which position index they wish to retrieve data from is the solution to this problem. With this information, the EA will be able to concentrate on the particular role that the user is looking for. The code should also make sure that the position that is chosen matches the instrument that is currently visible on the chart, guaranteeing that only pertinent data is utilized for visual representation.
Example:
// Variables to store position details
double open_price;          // Variable to store the entry price of the position
double stop_loss;           // Variable to store the Stop Loss level of the position
double take_profit;         // Variable to store the Take Profit level of the position
datetime position_open_time; // Variable to store the open time of the position

// Define the position index for the first position
input int position_index  = 0; // POSITION INDEX (Index starts from 0)

// Get the ID of the current chart
long chart_id = ChartID();


//+------------------------------------------------------------------+
//| Expert tick function                                             |
//+------------------------------------------------------------------+
void OnTick()
  {


// Loop through all open positions
   for(int i = 0; i < PositionsTotal(); i++)
     {
      // Get the ticket number of the position at index 'i'
      ulong ticket = PositionGetTicket(i);

      if(PositionGetInteger(POSITION_TICKET) == PositionGetTicket(position_index) && PositionGetString(POSITION_SYMBOL) == ChartSymbol(chart_id))
        {

         // Retrieve and store the entry price of the position
         open_price = PositionGetDouble(POSITION_PRICE_OPEN);

         // Retrieve and store the Stop Loss level of the position
         stop_loss = PositionGetDouble(POSITION_SL);

         // Retrieve and store the Take Profit level of the position
         take_profit = PositionGetDouble(POSITION_TP);

         // Retrieve and store the open time of the position
         position_open_time = (int)PositionGetInteger(POSITION_TIME);

         // Print the retrieved values for debugging or verification
         Print("Open Price index ",i,": ",open_price);
         Print("SL index ",i,": ",stop_loss);
         Print("TP index ",i,": ",take_profit);
         Print("Open time index ",i,": ",position_open_time);

        }
     }

  }
The algorithm iterates over each open position, determines whether it corresponds to the chosen index and chart symbol, and then obtains the pertinent information. We can now make the two rectangles that will indicate the SL (Stop Loss) and TP (Take Profit) zones after successfully retrieving the price and time data for the given position. To guarantee that these rectangles appropriately depict the SL and TP regions on the chart, the acquired data will be used as inputs for the ObjectCreate() function.
Example:// Variables to store position details double open_price; // Variable to store the entry price of the position double stop_loss; // Variable to store the Stop Loss level of the position double take_profit; // Variable to store the Take Profit level of the position datetime position_open_time; // Variable to store the open time of the position // Define the position index for the first position input int position_index = 1; // POSITION INDEX (Index starts from 0) // Get the ID of the current chart long chart_id = ChartID(); // Store the ID of the current chart string time = "23:59"; // Define a specific time as a string // Define the color for the losing zone input color sl_zonez_color = clrPink; // Choose a color for Losing Zone // Define the color for the winning zone input color tp_zonez_color = clrSpringGreen; // Choose a color for Winning Zone //+------------------------------------------------------------------+ //| Expert tick function | //+------------------------------------------------------------------+ void OnTick() { // Convert the string time to datetime datetime close_zone = StringToTime(time); // Loop through all open positions for(int i = 0; i < PositionsTotal(); i++) { // Get the ticket number of the position at index 'i' ulong ticket = PositionGetTicket(i); // Check if the position matches the specified index and symbol of the current chart if(PositionGetInteger(POSITION_TICKET) == PositionGetTicket(position_index) && PositionGetString(POSITION_SYMBOL) == ChartSymbol(chart_id)) { // Retrieve and store the entry price of the position open_price = PositionGetDouble(POSITION_PRICE_OPEN); // Retrieve and store the Stop Loss level of the position stop_loss = PositionGetDouble(POSITION_SL); // Retrieve and store the Take Profit level of the position take_profit = PositionGetDouble(POSITION_TP); // Retrieve and store the open time of the position position_open_time = (int)PositionGetInteger(POSITION_TIME); // Print the retrieved values for debugging or verification Print("Open Price index ",i,": ",open_price); Print("SL index ",i,": ",stop_loss); Print("TP index ",i,": ",take_profit); Print("Open time index ",i,": ",position_open_time); // Create a rectangle to represent the Stop Loss (SL) zone on the chart ObjectCreate(chart_id, "SL Zone", OBJ_RECTANGLE, 0, position_open_time, open_price, close_zone, stop_loss); // Create a rectangle to represent the Take Profit (TP) zone on the chart ObjectCreate(chart_id, "TP zone", OBJ_RECTANGLE, 0, position_open_time, open_price, close_zone, take_profit); // Set properties for the SL zone rectangle ObjectSetInteger(chart_id, "SL Zone", OBJPROP_COLOR, sl_zonez_color); // Set color to the selected SL zone color ObjectSetInteger(chart_id, "SL Zone", OBJPROP_STYLE, STYLE_SOLID); // Set style to solid ObjectSetInteger(chart_id, "SL Zone", OBJPROP_WIDTH, 1); // Set the width of the rectangle border ObjectSetInteger(chart_id, "SL Zone", OBJPROP_FILL, sl_zonez_color); // Fill the rectangle with the selected SL zone color ObjectSetInteger(chart_id, "SL Zone", OBJPROP_BACK, true); // Set the rectangle to appear behind the chart objects // Set properties for the TP zone rectangle ObjectSetInteger(chart_id, "TP zone", OBJPROP_COLOR, tp_zonez_color); // Set color to the selected TP zone color ObjectSetInteger(chart_id, "TP zone", OBJPROP_STYLE, STYLE_SOLID); // Set style to solid ObjectSetInteger(chart_id, "TP zone", OBJPROP_WIDTH, 1); // Set the width of the rectangle border ObjectSetInteger(chart_id, "TP zone", OBJPROP_FILL, tp_zonez_color); // Fill the rectangle with the selected TP zone color ObjectSetInteger(chart_id, "TP zone", OBJPROP_BACK, true); // Set the rectangle to appear behind the chart objects } } }
Explanation:
This code obtains the position's open time, SL, TP, and open price for every position. It uses this information to draw two visible rectangles on the chart: one for the possible loss area and another for the potential profit area. On the other hand, failure to specify the TP or SL levels could result in problems with these rectangles' anchor points, which could affect how they are positioned or shown on the chart. To guarantee accurate visualization, I'll implement code to rectify this behavior.
if(stop_loss > 0)
  {
// Create a rectangle to represent the Stop Loss (SL) zone on the chart
   ObjectCreate(chart_id, "SL Zone", OBJ_RECTANGLE, 0, position_open_time, open_price, close_zone, stop_loss);
  }


if(take_profit > 0)
  {
// Create a rectangle to represent the Take Profit (TP) zone on the chart
   ObjectCreate(chart_id, "TP zone", OBJ_RECTANGLE, 0, position_open_time, open_price, close_zone, take_profit);
  }
Explanation:
Before creating corresponding rectangles on the chart, the code snippet verifies that the Stop Loss and Take Profit levels are greater than zero. If the SL is set (i.e., greater than 0), a rectangle is drawn to represent the SL zone, marking the potential loss area;if the TP is set, another rectangle is created to represent the TP zone, indicating the potential profit area. By preventing the creation of rectangles with invalid anchor points, these checks ensure accurate chart visualization.
Output: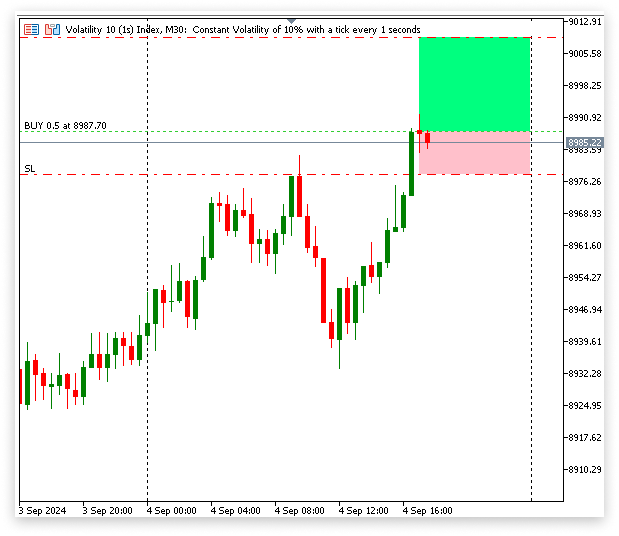
3.1.2. Creating Trend Lines
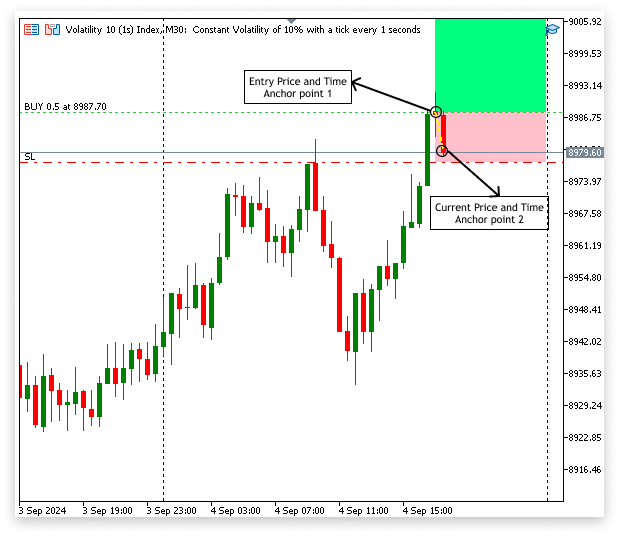
To illustrate the price movement since the trade was opened, we will concentrate on drawing a trend line in this part from the open price of the position to the present price. It is easy to see how the market has changed around these two places of entrance, which facilitates a more thorough examination of the trade's development.
Example:// Get the current ask price double ask = SymbolInfoDouble(_Symbol, SYMBOL_ASK); // Create a trend line object on the chart from the position's open time and price to the current time and ask price ObjectCreate(chart_id, "Trend Line", OBJ_TREND, 0, position_open_time, open_price, TimeCurrent(), ask); // Set the color of the trend line ObjectSetInteger(chart_id, "Trend Line", OBJPROP_COLOR, clrYellow); // Set the style of the trend line to dashed ObjectSetInteger(chart_id, "Trend Line", OBJPROP_STYLE, STYLE_DASH); // Set the width of the trend line ObjectSetInteger(chart_id, "Trend Line", OBJPROP_WIDTH, 2);
Output:
3.1.3. Adding Text Labels
We'll be giving the chart four distinct text labels in this phase. The entry price, take-profit (TP), stop-loss (SL), and current profit will all be shown on these labels. These crucial trading parameters will have distinct visual references for each label on the chart, making it simpler to keep an eye on the status of the transaction right from the chart.
Example:// Variables to store position details double open_price; // Variable to store the entry price of the position double stop_loss; // Variable to store the Stop Loss level of the position double take_profit; // Variable to store the Take Profit level of the position datetime position_open_time; // Variable to store the open time of the position // Define the position index for the first position input int position_index = 1; // POSITION INDEX (Index starts from 0) // Get the ID of the current chart long chart_id = ChartID(); // Store the ID of the current chart string time = "23:59"; // Define a specific time as a string // Define the color for the losing zone input color sl_zonez_color = clrPink; // Choose a color for Losing Zone // Define the color for the winning zone input color tp_zonez_color = clrSpringGreen; // Choose a color for Winning Zone // Define the color for the trend line input color line_zonez_color = clrYellow; // Choose a color for the line //+------------------------------------------------------------------+ //| Expert tick function | //+------------------------------------------------------------------+ void OnTick() { // Get the current ask price double ask = SymbolInfoDouble(_Symbol, SYMBOL_ASK); // Convert the string time to datetime datetime close_zone = StringToTime(time); // Loop through all open positions for(int i = 0; i < PositionsTotal(); i++) { // Get the ticket number of the position at index 'i' ulong ticket = PositionGetTicket(i); // Check if the position matches the specified index and symbol of the current chart if(PositionGetInteger(POSITION_TICKET) == PositionGetTicket(position_index) && PositionGetString(POSITION_SYMBOL) == ChartSymbol(chart_id)) { // Retrieve and store the entry price of the position open_price = PositionGetDouble(POSITION_PRICE_OPEN); // Retrieve and store the Stop Loss level of the position stop_loss = PositionGetDouble(POSITION_SL); // Retrieve and store the Take Profit level of the position take_profit = PositionGetDouble(POSITION_TP); // Retrieve and store the open time of the position position_open_time = (int)PositionGetInteger(POSITION_TIME); if(stop_loss > 0) { // Create a rectangle to represent the Stop Loss (SL) zone on the chart ObjectCreate(chart_id, "SL Zone", OBJ_RECTANGLE, 0, position_open_time, open_price, close_zone, stop_loss); } if(take_profit > 0) { // Create a rectangle to represent the Take Profit (TP) zone on the chart ObjectCreate(chart_id, "TP zone", OBJ_RECTANGLE, 0, position_open_time, open_price, close_zone, take_profit); } // Set properties for the SL zone rectangle ObjectSetInteger(chart_id, "SL Zone", OBJPROP_COLOR, sl_zonez_color); // Set color to the selected SL zone color ObjectSetInteger(chart_id, "SL Zone", OBJPROP_STYLE, STYLE_SOLID); // Set style to solid ObjectSetInteger(chart_id, "SL Zone", OBJPROP_WIDTH, 1); // Set the width of the rectangle border ObjectSetInteger(chart_id, "SL Zone", OBJPROP_FILL, sl_zonez_color); // Fill the rectangle with the selected SL zone color ObjectSetInteger(chart_id, "SL Zone", OBJPROP_BACK, true); // Set the rectangle to appear behind the chart objects // Set properties for the TP zone rectangle ObjectSetInteger(chart_id, "TP zone", OBJPROP_COLOR, tp_zonez_color); // Set color to the selected TP zone color ObjectSetInteger(chart_id, "TP zone", OBJPROP_STYLE, STYLE_SOLID); // Set style to solid ObjectSetInteger(chart_id, "TP zone", OBJPROP_WIDTH, 1); // Set the width of the rectangle border ObjectSetInteger(chart_id, "TP zone", OBJPROP_FILL, tp_zonez_color); // Fill the rectangle with the selected TP zone color ObjectSetInteger(chart_id, "TP zone", OBJPROP_BACK, true); // Set the rectangle to appear behind the chart objects // Create a trend line object on the chart from the position's open time and price to the current time and ask price ObjectCreate(chart_id, "Trend Line", OBJ_TREND, 0, position_open_time, open_price, TimeCurrent(), ask); // Set Trend Line properties ObjectSetInteger(chart_id, "Trend Line", OBJPROP_COLOR, line_zonez_color); ObjectSetInteger(chart_id, "Trend Line", OBJPROP_STYLE, STYLE_DASH); ObjectSetInteger(chart_id, "Trend Line", OBJPROP_WIDTH, 2); // Calculate the profit of the current position double profit = PositionGetDouble(POSITION_PROFIT); // Variables to store the formatted profit text string curent_profits; string profit_to_string; // Check if the profit is positive or zero if(profit >= 0) { // Convert the profit to a string with 2 decimal places profit_to_string = DoubleToString(profit, 2); // Format the profit as a positive amount with a '+' sign curent_profits = StringFormat("+$%s", profit_to_string); } // Check if the profit is negative else if(profit < 0) { // Convert the negative profit to a positive number double profit_to_positive = MathAbs(profit); // Convert the positive profit to a string with 2 decimal places profit_to_string = DoubleToString(profit_to_positive, 2); // Format the profit as a negative amount with a '-' sign curent_profits = StringFormat("-$%s", profit_to_string); } // Create a text label on the chart to display the current profit string text_object_name = "Profit"; ObjectCreate(chart_id, text_object_name, OBJ_TEXT, 0, TimeCurrent(), ask); ObjectSetString(chart_id, text_object_name, OBJPROP_TEXT, curent_profits); // Set the color of the profit text based on whether the profit is positive or negative if(profit > 0) { ObjectSetInteger(chart_id, text_object_name, OBJPROP_COLOR, clrMediumBlue); // Positive profit in blue } else if(profit < 0) { ObjectSetInteger(chart_id, text_object_name, OBJPROP_COLOR, clrRed); // Negative profit in red } // Display the Take Profit (TP) level on the chart string tp_display = "TP"; string t_display = StringFormat("Take Profit: %.5f", take_profit); ObjectCreate(chart_id, tp_display, OBJ_TEXT, 0, close_zone, take_profit); ObjectSetString(chart_id, tp_display, OBJPROP_TEXT, t_display); ObjectSetInteger(chart_id, tp_display, OBJPROP_COLOR, clrBlue); // TP text in blue ObjectSetInteger(chart_id, tp_display, OBJPROP_FONTSIZE, 8); // Set font size for TP // Display the Stop Loss (SL) level on the chart string sl_display = "SL"; string s_display = StringFormat("Stop Loss: %.5f", stop_loss); ObjectCreate(chart_id, sl_display, OBJ_TEXT, 0, close_zone, stop_loss); ObjectSetString(chart_id, sl_display, OBJPROP_TEXT, s_display); ObjectSetInteger(chart_id, sl_display, OBJPROP_COLOR, clrRed); // SL text in red ObjectSetInteger(chart_id, sl_display, OBJPROP_FONTSIZE, 8); // Set font size for SL // Display the Entry Price on the chart string en_display = "Entry Price"; string e_display = StringFormat("Entry Point: %.5f", open_price); ObjectCreate(chart_id, en_display, OBJ_TEXT, 0, close_zone, open_price); ObjectSetString(chart_id, en_display, OBJPROP_TEXT, e_display); ObjectSetInteger(chart_id, en_display, OBJPROP_COLOR, clrPaleVioletRed); // Entry Price text in pale violet red ObjectSetInteger(chart_id, en_display, OBJPROP_FONTSIZE, 8); // Set font size for Entry Price } } }
Explanation:
Important trading data is intended to be shown directly on the chart by this piece of the code. It computes the current positional profit and presents it as a text label, showing the profit in red for a negative profit and blue for a positive profit. To visually distinguish the TP level, SL level, and entry price, it also inserts text labels for each. These labels are colored differently. The labels have been positioned on the chart to facilitate traders in quickly identifying pivotal levels and the present profit status of their position.
Output: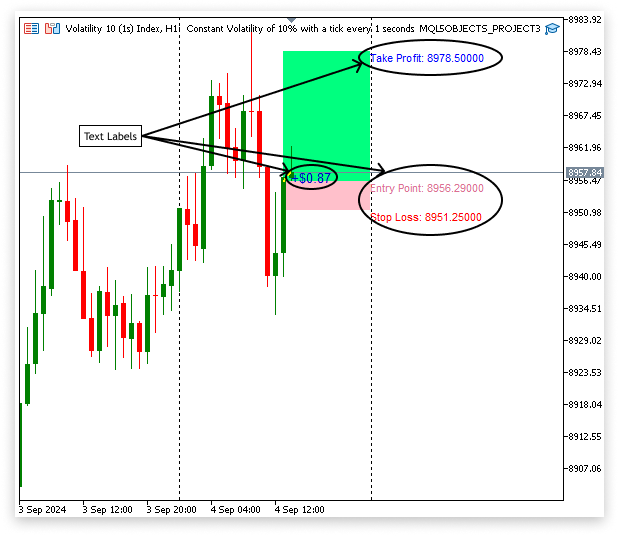
3.2. Creating Chart Objects for Historical Data
Chapter 3 has so far covered the creation of chart objects that symbolize the current position. We will now turn our focus to dealing with historical records, which will allow us to see historical trade trends and data on the chart. This will enable us to examine prior transactions and apply historical knowledge to current trading plans.
Example:// Define the position index for the first position input int position_index = 1; // POSITION INDEX (Index starts from 0) // Get the ID of the current chart long chart_id = ChartID(); // Store the ID of the current chart string time = "23:59"; // Define a specific time as a string // Define the color for the losing zone input color sl_zonez_color = clrPink; // Choose a color for Losing Zone // Define the color for the winning zone input color tp_zonez_color = clrSpringGreen; // Choose a color for Winning Zone // Define the color for the trend line input color line_zonez_color = clrYellow; // Choose a color for the line // Define whether to show past history or not input string show_history = "no"; // Type yes to show past history // Define the start date to show history input datetime date1 = D'1970.08.10 00:00:00'; // Show history from this date // Define the end date to show history input datetime date2 = D'2024.08.15 00:00:00'; // To this date //+------------------------------------------------------------------+ //| Expert tick function | //+------------------------------------------------------------------+ void OnTick() { // Check if history display is enabled if(show_history == "yes") { Comment(""); // Clear previous comments // Select deal history within the specified date range bool deal_history = HistorySelect(date1, date2); // Variables to store deal details double deal_close_price = 0.0; double deal_open_price = 0.0; double deal_sl = 0.0; double deal_tp = 0.0; double deal_profit = 0.0; datetime deal_close_time = 0; datetime deal_open_time = 0; // Check if deal history is available if(deal_history) { // Loop through all history deals for(int i = 0; i < HistoryDealsTotal(); i++) { ulong ticket = HistoryDealGetTicket(i); // Check for deal entry in if(HistoryDealGetInteger(ticket, DEAL_ENTRY) == DEAL_ENTRY_IN) { if(HistoryDealGetString(ticket, DEAL_SYMBOL) == ChartSymbol(chart_id)) { deal_open_price = HistoryDealGetDouble(ticket, DEAL_PRICE); deal_open_time = (datetime)HistoryDealGetInteger(ticket, DEAL_TIME); } } // Check for deal entry out if(HistoryDealGetInteger(ticket, DEAL_ENTRY) == DEAL_ENTRY_OUT) { deal_profit = HistoryDealGetDouble(ticket, DEAL_PROFIT); deal_close_price = HistoryDealGetDouble(ticket, DEAL_PRICE); deal_sl = HistoryDealGetDouble(ticket, DEAL_SL); deal_tp = HistoryDealGetDouble(ticket, DEAL_TP); deal_close_time = (datetime)HistoryDealGetInteger(ticket, DEAL_TIME); if(HistoryDealGetString(ticket, DEAL_SYMBOL) == ChartSymbol(chart_id)) { string deal_string; string current_deal_profit; string object_name; // Display deal profit/loss if(deal_profit > 0) { deal_string = DoubleToString(deal_profit, 2); current_deal_profit = StringFormat("YOU WON +$%s", deal_string); object_name = StringFormat("PROFIT %d", i); ObjectCreate(chart_id, object_name, OBJ_TEXT, 0, deal_close_time, deal_close_price); ObjectSetString(chart_id, object_name, OBJPROP_TEXT, current_deal_profit); ObjectSetInteger(chart_id, object_name, OBJPROP_COLOR, clrMediumBlue); ObjectSetInteger(chart_id, object_name, OBJPROP_FONTSIZE,8); } else if(deal_profit < 0) { double deal_to_positive = MathAbs(deal_profit); deal_string = DoubleToString(deal_to_positive, 2); object_name = StringFormat("PROFIT %d", i); current_deal_profit = StringFormat("YOU LOST -$%s", deal_string); ObjectCreate(chart_id, object_name, OBJ_TEXT, 0, deal_close_time, deal_close_price); ObjectSetString(chart_id, object_name, OBJPROP_TEXT, current_deal_profit); ObjectSetInteger(chart_id, object_name, OBJPROP_COLOR, clrRed); ObjectSetInteger(chart_id, object_name, OBJPROP_FONTSIZE,8); } // Display deal SL zone string sl_obj_name = StringFormat("SL ZONE %d", i); if(deal_sl > 0) { ObjectCreate(chart_id, sl_obj_name, OBJ_RECTANGLE, 0, deal_open_time, deal_open_price, deal_close_time, deal_sl); } ObjectSetInteger(chart_id, sl_obj_name, OBJPROP_COLOR, sl_zonez_color); ObjectSetInteger(chart_id, sl_obj_name, OBJPROP_STYLE, STYLE_SOLID); ObjectSetInteger(chart_id, sl_obj_name, OBJPROP_WIDTH, 1); ObjectSetInteger(chart_id, sl_obj_name, OBJPROP_FILL, sl_zonez_color); ObjectSetInteger(chart_id, sl_obj_name, OBJPROP_BACK, true); // Display deal TP zone string tp_obj_name = StringFormat("TP ZONE %d", i); if(deal_tp > 0) { ObjectCreate(chart_id, tp_obj_name, OBJ_RECTANGLE, 0, deal_open_time, deal_open_price, deal_close_time, deal_tp); } ObjectSetInteger(chart_id, tp_obj_name, OBJPROP_COLOR, tp_zonez_color); ObjectSetInteger(chart_id, tp_obj_name, OBJPROP_STYLE, STYLE_SOLID); ObjectSetInteger(chart_id, tp_obj_name, OBJPROP_WIDTH, 1); ObjectSetInteger(chart_id, tp_obj_name, OBJPROP_FILL, tp_zonez_color); ObjectSetInteger(chart_id, tp_obj_name, OBJPROP_BACK, true); // Display deal trend line string line_obj_name = StringFormat("line %d", i); ObjectCreate(chart_id, line_obj_name, OBJ_TREND, 0, deal_open_time, deal_open_price, deal_close_time, deal_close_price); ObjectSetInteger(chart_id, line_obj_name, OBJPROP_COLOR, line_zonez_color); ObjectSetInteger(chart_id, line_obj_name, OBJPROP_STYLE, STYLE_DASH); ObjectSetInteger(chart_id, line_obj_name, OBJPROP_WIDTH, 2); } } } } } }
Explanation:
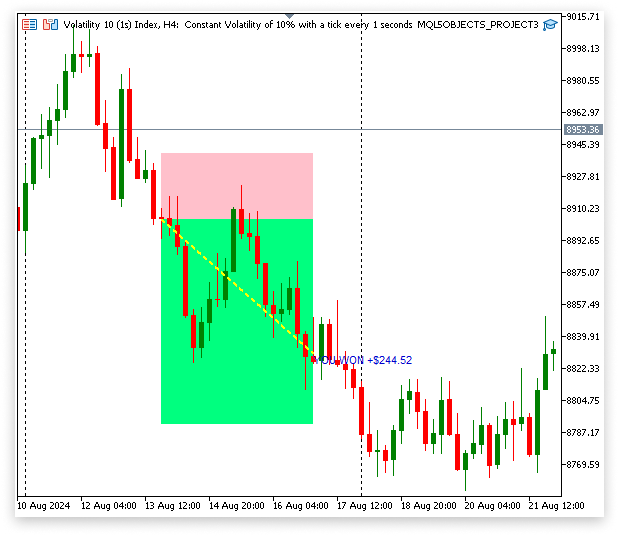
This section of code initially evaluates the show_history variable to see if the history display functionality is enabled. If "yes" is selected, the code uses Comment("") to remove any prior comments from the chart, leaving only the most recent data visible. The result is then stored in the deal_history boolean variable. The HistorySelect(date1, date2) method is then used to choose the historical deals within the given date range. We can utilize historical trading data with this pick. The data regarding each previous agreement is then stored in various variables. The closing and opening prices of the trade are recorded in deal_close_price and deal_open_price. The "deal_sl" and "deal_tp" are used to log the values of Take Profit and Stop Loss. The "deal_close_time" and "deal_open_time" document the closing and opening periods of the deal, as well as deal_profit, which tracks the deal's profit or loss.
The code determines whether deal history is accessible. If so, it starts a loop that uses HistoryDealGetTicket(i) to retrieve the ticket number for each deal as it iterates over all possible deals. It differentiates between entry and departure offers for every ticket. While exit transactions offer the closing price, profit, stop loss, and take profit values, entry deals are utilized to record the opening price and time. These specifics are used to generate various chart items, such as trend lines that show the price movement during the transaction, text labels that indicate profit or loss, and rectangles that represent the zones for take-profit and stop-loss. This method makes sure that historical trading data is displayed on the screen efficiently, giving important insights into previous performance.
Output:
Conclusion
In this article, we explored working with objects in MQL5, focusing on building and modifying chart elements to enhance trade analysis. We covered creating rectangles for take-profit and stop-loss zones, trend lines to track price changes, and text labels for important trading data. We also examined how to display previous trades using labels and visual aids, giving a clear picture of historical performance.
 Developing a multi-currency Expert Advisor (Part 9): Collecting optimization results for single trading strategy instances
 Neural Networks Made Easy (Part 86): U-Shaped Transformer
 Creating an MQL5-Telegram Integrated Expert Advisor (Part 5): Sending Commands from Telegram to MQL5 and Receiving Real-Time Responses
 Reimagining Classic Strategies (Part VIII): Currency Markets And Precious Metals on the USDCAD
- Free trading apps
- Over 8,000 signals for copying
- Economic news for exploring financial markets
You agree to website policy and terms of use
Thank you so much, Israel for the good series of Introduction to MQL5.I really appreciated your work. I have one question that do you have any tutorial regarding to how to set up the Strategy Tester for testing the algo trading bot. Thank you for your reply in advance.