
Introduction to MQL5 (Part 10): A Beginner's Guide to Working with Built-in Indicators in MQL5
Introduction
Welcome back to our MQL5 series! I’m excited to have you here for part ten, where we’ll explore another crucial aspect of algorithmic trading: working with built-in indicators. As always, this part promises to be both engaging and practical, as we’ll continue with our project-based approach to ensure you can apply what you learn directly to your trading strategies.
We will be developing a Relative Strength Index (RSI) EA in this article. One of the most used technical indicators in trading is the RSI. We'll build a tool that tracks market conditions and makes trades automatically by including this indicator in our EA. Although the Relative Strength Index (RSI) is the subject of this article, the ideas we'll discuss apply to most built-in indicators because they all operate on similar principles. Since this series is intended mostly for beginners, my main goal will be to keep the explanations and code as straightforward as possible. I know that for a novice, it is crucial to fully comprehend every stage of the process, including why certain code is written, what each component performs, and how the various parts work together.
Concise and memory-efficient code is frequently highly valued in professional MQL5 development. Although this method is excellent for efficiency optimization, it can occasionally make the code more difficult to understand, particularly for people unfamiliar with programming. Because of this, I've deliberately adopted a more comprehensive, methodical approach in this series to ensure that you feel at ease during the entire process.
In this article, you'll learn:
- How to use built-in indicators.
- Using indicator handles to interact with indicators.
- Accessing indicator buffers to retrieve calculated indicator values.
- Retrieving RSI values and their corresponding candlestick data from the chart.
- Identifying RSI highs and lows for implementing liquidity sweep concepts.
- Step-by-step creation of an EA based on RSI values and candlestick data.
- Creating objects to mark significant RSI highs and lows directly on the chart for better analysis.
- Setting a percentage risk per trade to account for inconsistent candle sizes when using built-in indicators.
By the end of the article, you'll have a comprehensive understanding of integrating built-in indicators into your trading strategies, with a focus on risk management, risk modification, and practical insights for creating and refining an RSI-based EA.
1. Understanding Built-in Indicators in MQL5
1.1. What are Built-in Indicators?
MetaTrader 5 built-in indicators are useful quick cuts for market analysis. They provide you with immediate information about market conditions, momentum, and price movements. For instance, Bollinger Bands indicate the amount of market movement, Moving Averages assist in identifying trends, and the RSI can indicate when a market is overbought or oversold. These tools greatly simplify trading and save you time.
1.2. Indicator Handles
In MQL5, indicator handles are unique identifiers assigned to indicators when they are created or initialized. These handles act as references to the indicators, allowing you to interact with them and access their data. When you add an indicator to a chart, you're required to input specific properties such as the period, price type, and other settings that define how the indicator behaves.
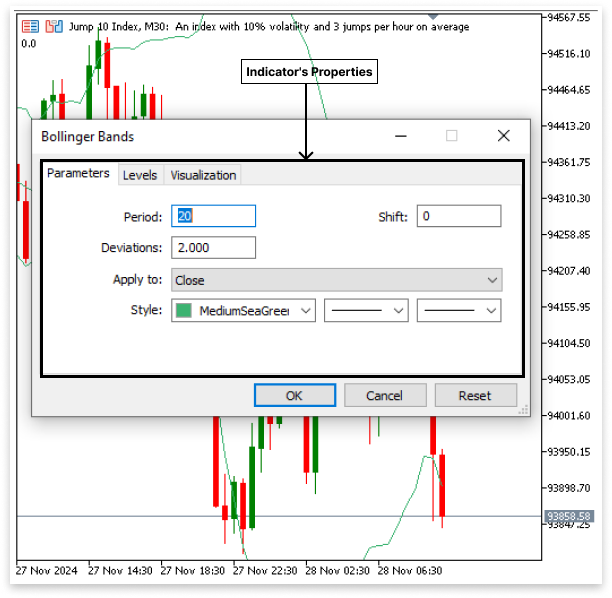
In code, the handle plays a similar role: it allows your program to "know" which indicator it is working with and access its properties. Essentially, the indicator handle acts as a way to input and trigger the settings for the indicator within your program, enabling you to work with it effectively in your trading strategies.
Once an indicator handle is created using functions like iRSI or iBands, it "binds" your code to that specific indicator, so you can retrieve and manipulate its data easily. Without the handle, your program wouldn't be able to distinguish between different indicators, nor would it be able to access the calculated values of the indicator's buffers. For example, if you want to input an indicator’s settings into your code, you'll use a function like iRSI to specify the necessary parameters (such as the period, applied price, and shift), which will then create the handle for the RSI indicator.
Syntax:
iRSI(symbol, period, rsi_period, applied_price); Explanation:
- symbol: This parameter specifies the symbol (currency pair, stock, or asset) for which the RSI will be calculated.
- period: This is the period (or timeframe) on which the RSI will be calculated. It defines how far back the RSI will consider data points.
- rsi_period: This is the number of periods used in the calculation of the RSI. The RSI is typically calculated using 14 periods, but this can be adjusted to suit your strategy.
- applied_price: This parameter defines which price type to use when calculating the RSI. RSI can be based on different price values, such as the closing price, opening price, or high/low prices.
int rsi_handle = iRSI(_Symbol,PERIOD_CURRENT,14,PRICE_CLOSE);
Explanation:
int rsi_handle:
- Declares an integer variable rsi_handle to store the RSI indicator handle (a unique ID for the indicator).
iRSI(...):
- The function used to calculate the Relative Strength Index (RSI) for the given symbol, timeframe, and settings.
_Symbol:
- Refers to the current trading symbol (e.g., EUR/USD) on the chart. It automatically uses the symbol you're working with.
PERIOD_CURRENT:
- Refers to the timeframe of the chart (e.g., 1-hour, 1-day). It ensures that the RSI is calculated based on the chart's active timeframe.
14:
- The RSI period, specifies the number of bars/candles to be used in the calculation (commonly 14 periods).
PRICE_CLOSE:
- Specifies that the RSI will be calculated using the closing prices of each bar or candle.
This is how you input indicator details directly into your code, similar to how you would set them up on an MetaTrader 5 chart. By using functions like iRSI, you define the symbol, timeframe, period, and price type, just as you would when applying an indicator on the chart. This allows your code to access and work with the indicator’s data, ensuring your trading strategy functions as expected with the specified settings.
The same principles can be applied to other built-in indicators in MetaTrader 5. For example, you can use different functions to handle various indicators, each requiring specific parameters. Here are five commonly used functions:
- iBands - For Bollinger Bands, allows you to set the symbol, timeframe, period, deviation, and applied price.
- iMA - For Moving Average, specifies the symbol, timeframe, period, shift, method, and applied price.
- iMACD - For MACD, define the symbol, timeframe, fast and slow EMA's, signal period, and applied price.
- iADX - For Average Directional Index, specifies the symbol, timeframe, and period.
With an array of technical analysis tools to improve your trading techniques, MQL5 offers a lot more built-in indicator functions. Applying the same ideas to other indicators is simple if you know how to work with one. The indicators that best fit your trading requirements can be found by exploring deeper into the MQL5 documentation.
1.2. Indicator Buffer
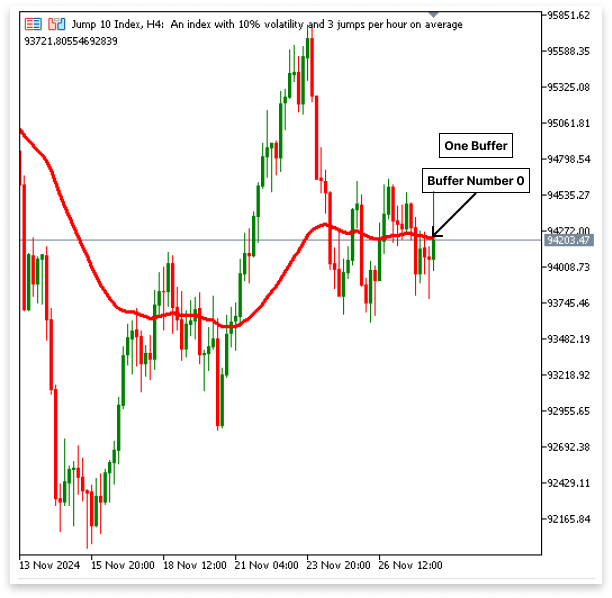
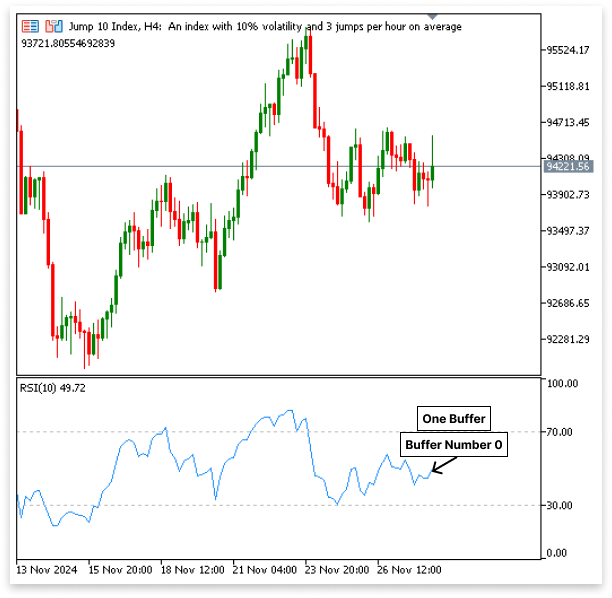
After defining an indicator using a handle, the next step is to retrieve its data. This is done through indicator buffers, which store the calculated values of an indicator for each price point on the chart. Each indicator has a specific number of buffers depending on the type of data it generates:
Moving Average (MA)
This indicator has 1 buffer, which stores the calculated moving average values at each candle.
Relative Strength Index (RSI)
Similarly, the RSI indicator has 1 buffer for storing RSI values
Bollinger Bands
This indicator uses 3 buffers to store data.
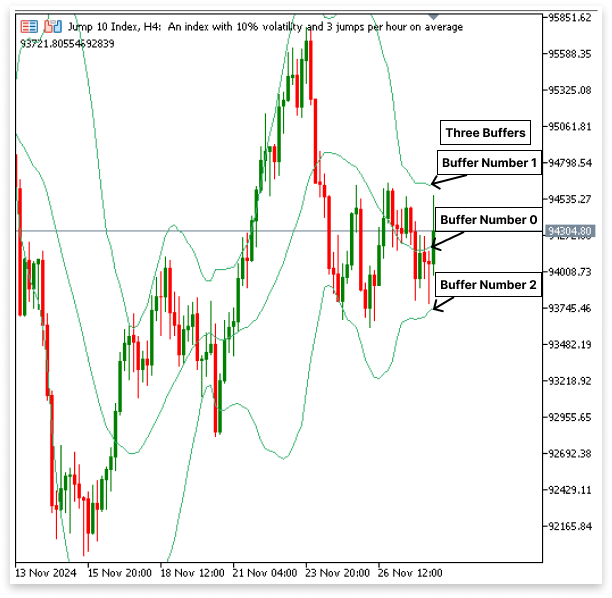
- The middle band (index 0) is the main trend line.
- The upper band (index 1) represents a potential overbought level.
- The lower band (index 2) represents a potential oversold level.
These buffers can be accessed programmatically using the CopyBuffer() function.
The CopyBuffer() function in MQL5 is used to retrieve data from an indicator's buffer into an array for further analysis or decision-making. Once you create an indicator handle using functions like iRSI or iBands, you use CopyBuffer() to access the calculated indicator values.
Syntax:int CopyBuffer(indicator_handle, buffer_number, start_position, count, buffer);
Parameters:
- indicator_handle: The unique identifier (handle) of the indicator created earlier, such as from iRSI or iBands.
- buffer_number: The index of the buffer to retrieve data from. For example, Bollinger Bands, 0 for middle band, 1 for upper band, 2 for lower band. For RSI or Moving Average, Only 0 since they have one buffer.
- start_pos: The starting position on the chart (0 = most recent candle).
- count: The number of values you want to retrieve from the buffer.
- buffer[]: The array where the data from the indicator's buffer will be stored.
int band_handle;               // Bollinger Bands handle
double upper_band[], mid_band[], lower_band[]; // Buffers for the bands
void OnStart()
  {
// Create the Bollinger Bands indicator
   band_handle = iBands(_Symbol, PERIOD_CURRENT, 20, 0, 2.0, PRICE_CLOSE);
// Ensure arrays are series for correct indexing
   ArraySetAsSeries(upper_band, true);
   ArraySetAsSeries(mid_band, true);
   ArraySetAsSeries(lower_band, true);
// Copy data from buffers (Index 0 = Middle, 1 = Upper, 2 = Lower)
   CopyBuffer(band_handle, 0, 0, 10, mid_band);   // Middle band data
   CopyBuffer(band_handle, 1, 0, 10, upper_band); // Upper band data
   CopyBuffer(band_handle, 2, 0, 10, lower_band); // Lower band data
// Print the most recent values
   Print("Middle Band: ", mid_band[0]);
   Print("Upper Band: ", upper_band[0]);
   Print("Lower Band: ", lower_band[0]);
  }
Explanation:
In this example, we demonstrate how to use the CopyBuffer() function to retrieve data from the Bollinger Bands indicator. First, the iBands function creates an indicator handle using specific parameters such as the symbol (_Symbol), timeframe (PERIOD_CURRENT), period (20), shift (0), deviation (2.0), and applied price (PRICE_CLOSE). This handle, which is kept in band_handle, serves as a conduit between our application and the Bollinger Bands indicator, providing us with access to the numbers that are computed. The data for the upper, middle, and lower bands are then stored in three arrays that we declare: upper_band, mid_band, and lower_band. The most recent value will be at index 0 if these arrays are set as series using ArraySetAsSeries. Setting these arrays as series using ArraySetAsSeries ensures that the most recent value will be at index 0.
Each of the three buffers of the Bollinger Bands indicator — buffer 0 for the middle band, buffer 1 for the upper band, and buffer 2 for the lower band — has its call to the CopyBuffer() function. Every call stores the last eleven values in the relevant array after retrieving them from the related buffer. Finally, the program prints the most recent values of the middle, upper, and lower bands using Print(). The link between price and the Bollinger Bands can then be utilized to identify possible breakouts or trend reversals, among other uses of this data for additional analysis or decision-making within the trading system.
2. Developing the RSI-Based Expert Advisor (EA)
2.1. How the EA Works:
The EA considers overbought and oversold levels to be crucial markers of a possible reversal.
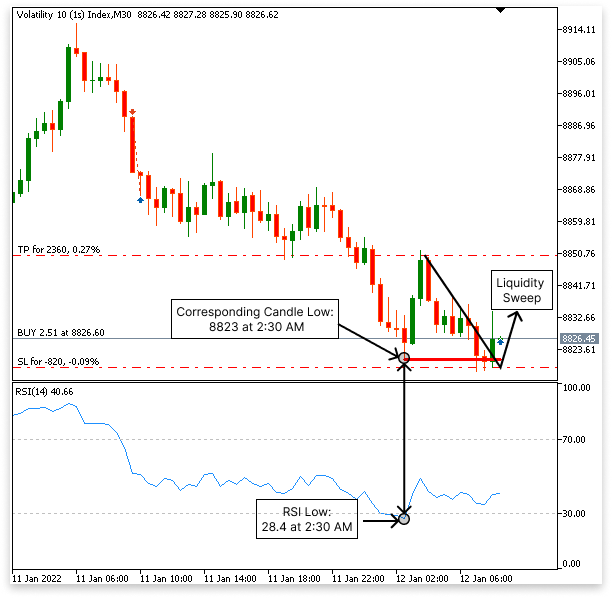
2.1.1. Logic for Buy
- Check if the RSI value is below 30.
- It determines if the RSI has formed a low.
- The EA identifies the corresponding candle’s low on the normal chart.
- Waits for the price to sweep the liquidity by breaking below the low of the designated candle.
- When the first bullish candle closes above the low after the price breaks the low, the EA initiates a buy trade anticipating an upward rise.
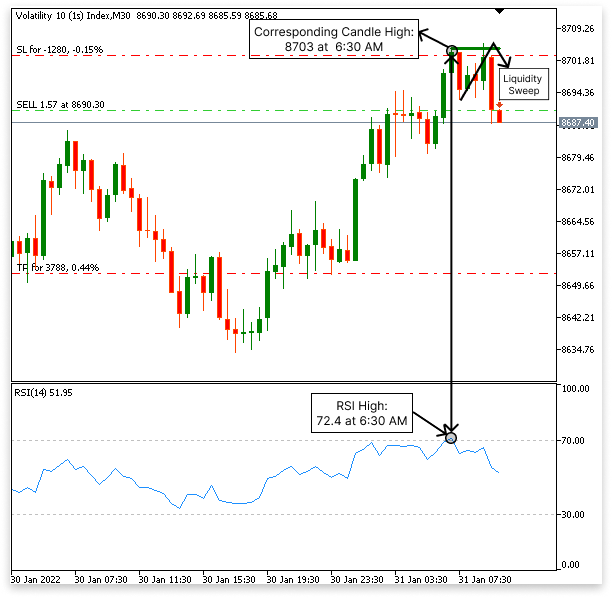
2.1.2. Logic for Sell
- Check if the RSI value is above 70.
- It determines if the RSI has formed a high.
- The EA identifies the corresponding candle’s high on the normal chart.
- It then monitors the price action, waiting for the price to break above the high of the identified candle, sweeping the liquidity.
- After the price breaks the high, the EA places a sell trade once the first bearish candle closes below the high, anticipating a downward move.
2.2. Adding the Trade Library
The first step when building an Expert Advisor (EA) that opens, closes, or modifies positions is to include the trade library. This library provides essential functions for executing and managing trades programmatically.
Example:#include <Trade/Trade.mqh> // Include the trade library for trading functions // Create an instance of the CTrade class for trading operations CTrade trade; //magic number input int MagicNumber = 1111; //+------------------------------------------------------------------+ //| Expert initialization function | //+------------------------------------------------------------------+ int OnInit() { // Set the magic number for the EA's trades trade.SetExpertMagicNumber(MagicNumber); // Return initialization success return(INIT_SUCCEEDED); }
Explanation:
Including the Trade Library
- For you to use the CTrade class, the trade library must be imported using the #include <Trade/Trade.mqh> declaration. This class streamlines trading processes by offering features to manage take-profit, stop-loss, market orders, pending orders, and other trading-related duties.
Creating an Instance of CTrade
- The CTrade trade; line creates an instance of the CTrade class, which will be used throughout the EA to execute and manage trades.
- The MagicNumber is declared as an input variable using the Input keyword. This allows the user of the EA to define a unique identifier for trades made by the EA.
Why is this important?
- The magic number ensures that trades placed by the EA can be identified and managed separately from other trades.
- It allows the EA to distinguish its trades from manual ones or trades from other EAs.
- By modifying the magic number, the user can run the EA on different assets or even the same asset under varying market conditions or time frames.
int OnInit()
  {
// Set the magic number for the EA's trades
   trade.SetExpertMagicNumber(MagicNumber);

// Return initialization success
   return(INIT_SUCCEEDED);
  }
Initialization Function:
The OnInit() function is executed when the EA starts. Here, the SetExpertMagicNumber() method assigns the specified magic number to the EA, ensuring all trades opened by this instance of the EA will carry this identifier. This approach provides flexibility, as users can adjust the magic number for different trading scenarios, making it easier to manage multiple instances of the EA across various instruments or strategies.
2.3. Retrieving RSI Values and Candlestick Data
Retrieving accurate market data is fundamental for the EA to perform effective trading operations. The logic of this EA revolves around understanding candlestick patterns and the RSI indicator, making it crucial to gather these values reliably. This data allows the EA to analyze if RSI highs and lows correspond to specific candlesticks, which is key for determining potential entry and exit points. By combining RSI values with candlestick data, the EA ensures it evaluates market conditions holistically, identifying overbought or oversold conditions in context with price action. This approach strengthens the EA’s ability to make logical and precise trading decisions.
2.3.1. Retrieving RSI Values
As discussed earlier, obtaining RSI values is an essential step for the EA to evaluate market conditions. This is accomplished in two parts: setting up the RSI indicator properties using the iRSI handle and retrieving the actual RSI values through the CopyBuffer function.
Example:
#include <Trade/Trade.mqh>
CTrade trade;

// Magic number
input int MagicNumber = 1111;
//RSI handle
int       rsi_handle;
double    rsi_buffer[];

//+------------------------------------------------------------------+
//| Expert initialization function                                   |
//+------------------------------------------------------------------+
int OnInit()
  {
// Configure RSI buffer as a series for easier indexing
   ArraySetAsSeries(rsi_buffer, true);
// Initialize RSI handle for the current symbol, timeframe, and parameters
   rsi_handle = iRSI(_Symbol, PERIOD_CURRENT, 14, PRICE_CLOSE);
// Set the magic number (for trading, not relevant to RSI retrieval here)
   trade.SetExpertMagicNumber(MagicNumber);
   return (INIT_SUCCEEDED); // Indicate successful initialization
  }
//+------------------------------------------------------------------+
//| Expert tick function                                             |
//+------------------------------------------------------------------+

void OnTick()
  {
// Copy RSI values from the indicator into the buffer
   CopyBuffer(rsi_handle, 0, 1, 100, rsi_buffer);
// Display the most recent RSI value for verification
   Comment("rsi_buffer[0]: ", rsi_buffer[0]);
  }
Explanation:
Arranging the RSI Buffer
- In the OnInit function, the ArraySetAsSeries function is used to configure the rsi_buffer as a series array, meaning the latest data will be at index 0. This simplifies accessing the most recent RSI values.
Creating the RSI Handle
- Inside the OnTick function, the iRSI function is called to initialize the RSI handle (rsi_handle). This function sets up the RSI indicator properties such as the symbol (_Symbol), timeframe (PERIOD_CURRENT), period (14), and applied price (PRICE_CLOSE).
Parameters:
- _Symbol: The trading instrument for which RSI is calculated.
- PERIOD_CURRENT: The chart’s current timeframe.
- 14: The RSI period (a commonly used default value).
- PRICE_CLOSE: RSI is calculated based on closing prices.
Copying RSI Values
- The CopyBuffer function fetches the RSI values for the indicator and populates the rsi_buffer array. It starts copying from the most recent value (offset 1) and retrieves up to 100 values.
Parameters:
- 0: Specifies the buffer index of the RSI indicator (0 for the main line).
- 1: Start copying from the second latest RSI value, as the most recent RSI is still forming and its values are unstable.
- 100: Retrieve up to 100 values.
This approach ensures that the EA has access to up-to-date RSI values, which are critical for analyzing overbought and oversold conditions and driving trading decisions.
Displaying the RSI Value
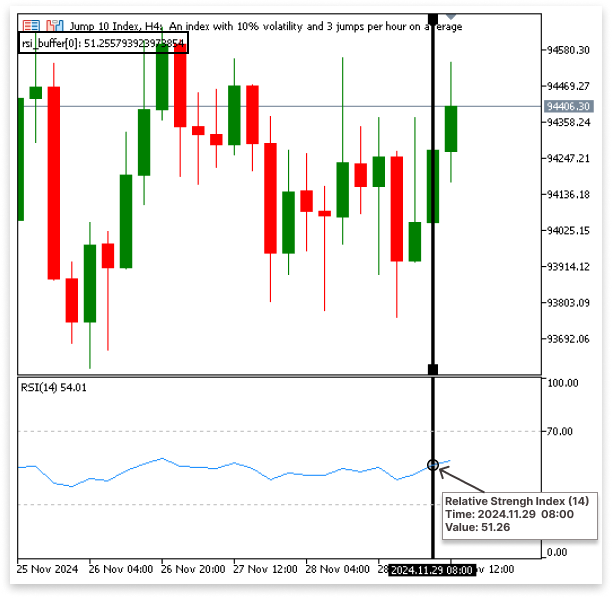
- The code validates the data retrieval procedure by displaying the most recent RSI value (rsi_buffer[0]) on the chart using the Comment function.
- This approach ensures that the EA has access to up-to-date RSI values, which are critical for analyzing overbought and oversold conditions and driving trading decisions.
Output:
2.3.2. Retrieving Candlestick Data
To analyze price activity and match it with RSI readings, it is imperative to retrieve candlestick data. To retrieve important candlestick information, such as the open, close, high, and low prices along with the timestamps that correlate to them, the EA employs particular functions. In order to assess market conditions and make wise trading decisions, these data points are essential.
Example:
#include <Trade/Trade.mqh>
CTrade trade;

// Magic number
input int MagicNumber = 1111;

int       rsi_handle;
double    rsi_buffer[];

double open[];
double close[];
double high[];
double low[];
datetime time[];

//+------------------------------------------------------------------+
//| Expert initialization function                                   |
//+------------------------------------------------------------------+
int OnInit()
  {
// Configure RSI buffer as a series for easier indexing
   ArraySetAsSeries(rsi_buffer, true);

// Initialize RSI handle for the current symbol, timeframe, and parameters
   rsi_handle = iRSI(_Symbol, PERIOD_CURRENT, 14, PRICE_CLOSE);

// Configure candlestick arrays as series
   ArraySetAsSeries(open, true);
   ArraySetAsSeries(close, true);
   ArraySetAsSeries(high, true);
   ArraySetAsSeries(low, true);
   ArraySetAsSeries(time, true);

// Set the magic number
   trade.SetExpertMagicNumber(MagicNumber);

   return (INIT_SUCCEEDED); // Indicate successful initialization
  }

//+------------------------------------------------------------------+
//| Expert tick function                                             |
//+------------------------------------------------------------------+
void OnTick()
  {
// Copy RSI values from the indicator into the buffer
   CopyBuffer(rsi_handle, 0, 1, 100, rsi_buffer);

// Copy candlestick data
   CopyOpen(_Symbol, PERIOD_CURRENT, 1, 100, open);
   CopyClose(_Symbol, PERIOD_CURRENT, 1, 100, close);
   CopyHigh(_Symbol, PERIOD_CURRENT, 1, 100, high);
   CopyLow(_Symbol, PERIOD_CURRENT, 1, 100, low);
   CopyTime(_Symbol, PERIOD_CURRENT, 1, 100, time);

// Display the most recent candlestick data for verification
   Comment("open[0]: ", open[0],
           "\nclose[0]: ", close[0],
           "\nhigh[0]: ", high[0],
           "\nlow[0]: ", low[0],
           "\ntime[0]: ", time[0]);
  }
Explanation:
Arranging the Candlestick Arrays
- In the OnInit function, the ArraySetAsSeries function is used to configure the open, close, high, low, and time arrays as series.
- This ensures that the most recent data appears at index 0, simplifying the retrieval and analysis of the latest completed candlestick data.
Copying Candlestick Data
- In the OnTick function, the CopyOpen, CopyClose, CopyHigh, CopyLow, and CopyTime functions are used to retrieve the respective data for candlesticks.
Parameters:
- _Symbol: The current trading instrument.
- PERIOD_CURRENT: The current chart timeframe (e.g., M1, H1).
- 1: Start copying from the second-latest candle because the most recent candle (index 0) is still forming, and its values are unstable.
- 100: Retrieve up to 100 candlestick values for analysis.
Each function populates its respective array:
- open[]: Contains the opening prices of the specified candlesticks.
- close[]: Contains the closing prices.
- high[]: Contains the highest prices.
- low[]: Contains the lowest prices.
- time[]: Stores the opening timestamps for synchronization with price action.
Displaying Candlestick Data
The Comment function is used to display the most recent completed candlestick data (index 0) on the chart for validation purposes:
- open[0]: The opening price.
- close[0]: The closing price.
- high[0]: The highest price.
- low[0]: The lowest price.
- time[0]: The timestamp indicating when the candle opened.
2.3.3. Determining RSI Highs and Lows
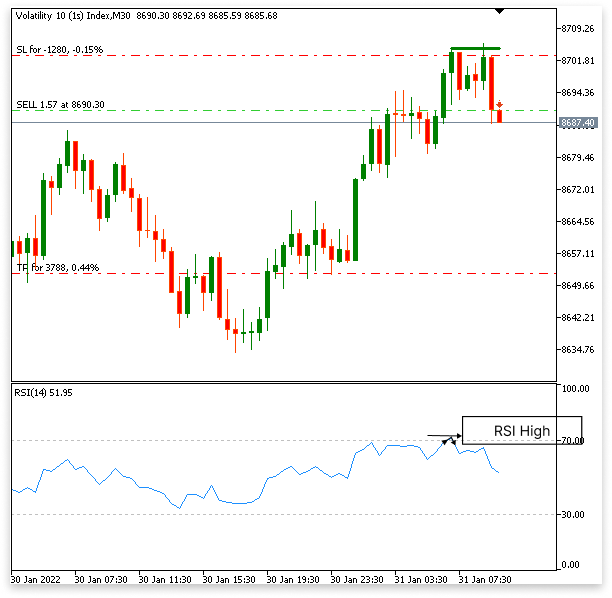
The EA must recognize RSI lows when the RSI drops below-oversold levels (30) and RSI highs when it climbs over overbought levels (70). To identify possible areas of interest, these RSI points are then connected to particular candlesticks on the chart. This stage is the foundation of the EA's operation since these markers are essential for configuring the logic for liquidity sweeps.
Determining RSI highs and lows is pretty straightforward:
RSI Low: 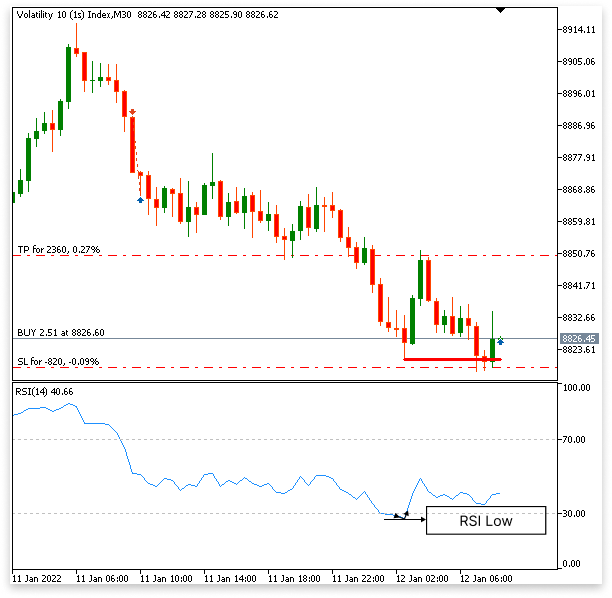
RSI High:
Example:
// Magic number
input int MagicNumber = 1111;

// RSI handle and buffer
int       rsi_handle;
double    rsi_buffer[];

// Candlestick data arrays
double open[];
double close[];
double high[];
double low[];
datetime time[];

// Variables to store high and low levels
double max_high = 0;        // Maximum high for the candlesticks
datetime min_time1 = 0;     // Time of the maximum high candlestick
double min_low = 0;         // Minimum low for the candlesticks
datetime min_time2 = 0;     // Time of the minimum low candlestick

// Variables to store RSI highs and lows
datetime time_low = 0;      // Time of the RSI low
datetime times_high = 0;    // Time of the RSI high

//+------------------------------------------------------------------+
//| Expert initialization function                                   |
//+------------------------------------------------------------------+
int OnInit()
  {
// Configure RSI buffer as a series for easier indexing
   ArraySetAsSeries(rsi_buffer, true);

// Initialize RSI handle for the current symbol, timeframe, and parameters
   rsi_handle = iRSI(_Symbol, PERIOD_CURRENT, 14, PRICE_CLOSE);

// Configure candlestick arrays as series
   ArraySetAsSeries(open, true);
   ArraySetAsSeries(close, true);
   ArraySetAsSeries(high, true);
   ArraySetAsSeries(low, true);
   ArraySetAsSeries(time, true);

// Set the magic number for the EA
   trade.SetExpertMagicNumber(MagicNumber);

   return (INIT_SUCCEEDED); // Indicate successful initialization
  }

//+------------------------------------------------------------------+
//| Expert tick function                                             |            |
//+------------------------------------------------------------------+
void OnTick()
  {
// Copy RSI values from the indicator into the buffer
   CopyBuffer(rsi_handle, 0, 1, 100, rsi_buffer);

// Copy candlestick data (open, close, high, low, time)
   CopyOpen(_Symbol, PERIOD_CURRENT, 1, 100, open);
   CopyClose(_Symbol, PERIOD_CURRENT, 1, 100, close);
   CopyHigh(_Symbol, PERIOD_CURRENT, 1, 100, high);
   CopyLow(_Symbol, PERIOD_CURRENT, 1, 100, low);
   CopyTime(_Symbol, PERIOD_CURRENT, 1, 100, time);

// Loop to find the maximum high from a bullish candlestick pattern
   for(int i = 0; i < 12; i++)
     {
      // Check for a bullish pattern: current close < open and previous close > open
      if(close[i] < open[i] && close[i+1] > open[i+1])
        {
         // Calculate the maximum high between the two candlesticks
         max_high = MathMax(high[i], high[i+1]);
         // Record the time of the corresponding candlestick
         min_time1 = MathMin(time[i], time[i+1]);
         break;
        }
     }

// Loop to find the minimum low from a bearish candlestick pattern
   for(int i = 0; i < 12; i++)
     {
      // Check for a bearish pattern: current close > open and previous close < open
      if(close[i] > open[i] && close[i+1] < open[i+1])
        {
         // Calculate the minimum low between the two candlesticks
         min_low = MathMin(low[i], low[i+1]);
         // Record the time of the corresponding candlestick
         min_time2 = MathMin(time[i], time[i+1]);
         break;
        }
     }

// Loop to find the RSI low point
   for(int i = 0; i < 12; i++)
     {
      // Check if the RSI is oversold and forms a low point
      if(rsi_buffer[i+1] < 30 && rsi_buffer[i] > rsi_buffer[i+1])
        {
         // Record the time of the RSI low
         time_low = time[i+1];
         break;
        }
     }

// Loop to find the RSI high point
   for(int i = 0; i < 12; i++)
     {
      // Check if the RSI is overbought and forms a high point
      if(rsi_buffer[i+1] > 70 && rsi_buffer[i] < rsi_buffer[i+1])
        {
         // Record the time of the RSI high
         times_high = time[i+1];
         break;
        }
     }
  }
Explanation:
RSI Lows (Oversold Conditions)
- The loop looks for points where the RSI is below 30 (rsi_buffer[i+1] < 30) and begins to rise (rsi_buffer[i] > rsi_buffer[i+1]).
- These conditions indicate that the RSI has reached a low and is reversing direction.
- The timestamp of the corresponding candlestick is stored in time_low.
RSI Highs (Overbought Conditions)
- The loop looks for points where the RSI is above 70 (rsi_buffer[i+1] > 70) and begins to fall (rsi_buffer[i] < rsi_buffer[i+1]).
- These conditions indicate that the RSI has reached a high and is reversing direction.
- The timestamp of the corresponding candlestick is stored in times_high.
2.3.4. Marking the Low and High on the Chart
2.3.4.1. Marking the Low on the Chart
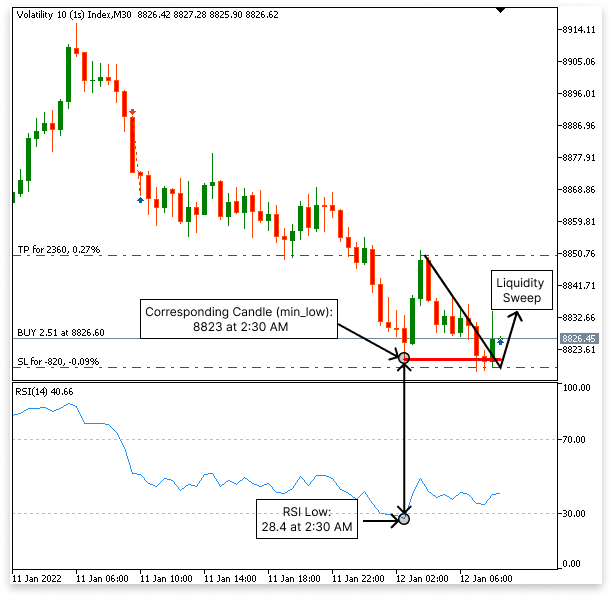
Once the logic for identifying the RSI low is satisfied, the program evaluates the candlestick data to pinpoint the corresponding minimum low on the chart. Since it takes two RSI values to form a low, the EA uses the lows of the two matching candlesticks to determine the precise level.
This minimum low is critical as it establishes the area where the program will wait for a potential liquidity sweep.
Logic:
- The RSI forms a low when:
- rsi_buffer[i+1] < 30: RSI dips below oversold level.
- rsi_buffer[i] > rsi_buffer[i+1]: RSI starts rising after reaching its lowest point.
- Once the RSI low is confirmed, the program identifies the minimum low using the low array from the two corresponding candlesticks on the chart.
- This minimum low sets the level where the EA waits for a potential liquidity sweep.
- Once the RSI low is identified, the program retrieves the low prices of the two corresponding candlesticks from the low array.
- Using the MathMin() function, it calculates the smallest value between these two lows, marking the level for monitoring liquidity sweeps.
- This minimum low serves as the point where the EA expects a potential reversal or liquidity sweep, a critical factor in trading decisions.
// Loop to find RSI and candlestick lows
for(int i = 0; i < 12; i++)
  {
// Check if the RSI is oversold and forms a low point
   if(rsi_buffer[i+1] < 30 && rsi_buffer[i] > rsi_buffer[i+1])
     {
      // Record the time of the RSI low
      time_low = time[i+1];

      // Find the minimum low from the two corresponding candlesticks
      min_low = (double)MathMin(low[i], low[i+1]);

      // Break the loop once the low is found
      break;
     }
  }
2.3.4.2.Marking the High on the Chart
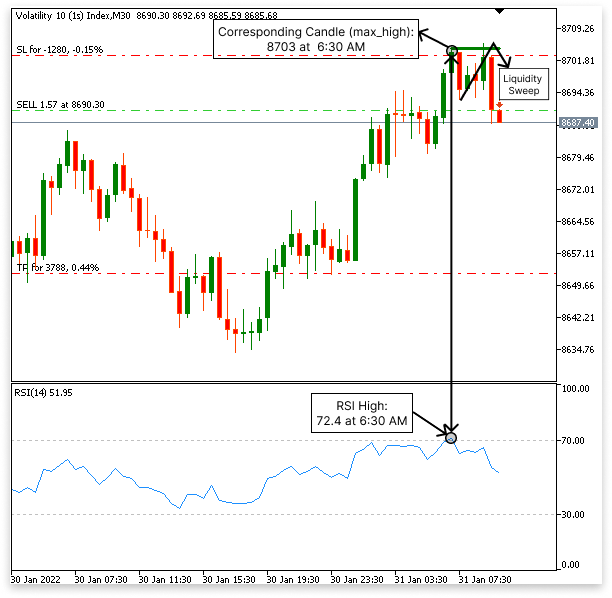
When the logic for identifying the RSI high is satisfied, the program evaluates the corresponding candlestick data to determine the maximum high on the chart. Since it takes two RSI values to form a high, the EA uses the highs of the two matching candlesticks to pinpoint the exact level.
This maximum high becomes the reference for setting the area where the EA will wait for a potential liquidity sweep. The approach is the inverse of the logic for lows.
Logic:
- The RSI forms a high when:
- rsi_buffer[i+1] > 70: RSI rises above the overbought level.
- rsi_buffer[i] < rsi_buffer[i+1]: RSI starts falling after reaching its highest point.
- Once the RSI high is confirmed, the program identifies the maximum high using the high array from the two corresponding candlesticks on the chart.
- This maximum high sets the level where the EA waits for a potential liquidity sweep.
- Once the RSI high is identified, the program retrieves the high prices of the two corresponding candlesticks from the high array.
- Using the MathMax() function, it calculates the highesr value between these two highs, marking the level for monitoring liquidity sweeps.
// Loop to find RSI and candlestick highs
for(int i = 0; i < 12; i++)
  {
// Check if the RSI is overbought and forms a high point
   if(rsi_buffer[i+1] > 70 && rsi_buffer[i] < rsi_buffer[i+1])
     {
      // Record the time of the RSI high
      times_high = time[i+1];

      // Find the maximum high from the two corresponding candlesticks
      max_high = (double)MathMax(high[i], high[i+1]);

      // Break the loop once the high is found
      break;
     }
  }
2.3.5. Controlling RSI Highs and Lows with a 12-Candle Delay
The potential for several RSI highs or lows to occur in a little period of time is one of the difficulties in utilizing RSI to identify highs and lows, particularly when the RSI stays in the overbought or oversold zones. As a result, different levels may be designated for liquidity sweeps. The logic adds a 12-candle wait to solve this, making sure that after a high or low is determined, it doesn't update until 12 candles have formed.
Example:
// Magic number
input int MagicNumber = 1111;

int       rsi_handle;
double    rsi_buffer[];

double open[];
double close[];
double high[];
double low[];
datetime time[];

double max_high = 0;
datetime min_time1 = 0;
double min_low = 0;
datetime min_time2 = 0;

datetime time_low = 0;
datetime times_high = 0;


//+------------------------------------------------------------------+
//| Expert initialization function                                   |
//+------------------------------------------------------------------+
int OnInit()
  {
// Configure RSI buffer as a series for easier indexing
   ArraySetAsSeries(rsi_buffer, true);

// Initialize RSI handle for the current symbol, timeframe, and parameters
   rsi_handle = iRSI(_Symbol, PERIOD_CURRENT, 14, PRICE_CLOSE);

// Configure candlestick arrays as series
   ArraySetAsSeries(open, true);
   ArraySetAsSeries(close, true);
   ArraySetAsSeries(high, true);
   ArraySetAsSeries(low, true);
   ArraySetAsSeries(time, true);

// Set the magic number
   trade.SetExpertMagicNumber(MagicNumber);

   return (INIT_SUCCEEDED); // Indicate successful initialization
  }

//+------------------------------------------------------------------+
//| Expert tick function                                             |
//+------------------------------------------------------------------+
void OnTick()
  {
// Copy RSI values from the indicator into the buffer
   CopyBuffer(rsi_handle, 0, 1, 100, rsi_buffer);

// Copy candlestick data
   CopyOpen(_Symbol, PERIOD_CURRENT, 1, 100, open);
   CopyClose(_Symbol, PERIOD_CURRENT, 1, 100, close);
   CopyHigh(_Symbol, PERIOD_CURRENT, 1, 100, high);
   CopyLow(_Symbol, PERIOD_CURRENT, 1, 100, low);
   CopyTime(_Symbol, PERIOD_CURRENT, 1, 100, time);

   static double max_high_static = max_high;
   static datetime min_time1_static = min_time1;

   static double min_low_static = min_low;
   static datetime min_time2_static = min_time2;


   int total_bar_high = Bars(_Symbol,PERIOD_CURRENT,min_time1_static,TimeCurrent());

   for(int i = 0; i < 12; i++)
     {

      if(close[i] < open[i] && close[i+1] > open[i+1])
        {

         max_high = (double)MathMax(high[i],high[i+1]);
         min_time1 = (datetime)MathMin(time[i],time[i+1]);

         break;


        }
     }

   int total_bar_low = Bars(_Symbol,PERIOD_CURRENT,min_time2_static,TimeCurrent());
   for(int i = 0; i < 12; i++)
     {

      if(close[i] > open[i] && close[i+1] < open[i+1])
        {

         min_low = (double)MathMin(low[i],low[i+1]);

         min_time2 = (datetime)MathMin(time[i],time[i+1]);
         break;

        }

     }

   for(int i = 0; i < 12; i++)
     {

      if(rsi_buffer[i+1] < 30 && rsi_buffer[i] > rsi_buffer[i+1])
        {

         time_low = time[i+1];
         break;

        }

     }

   for(int i = 0; i < 12; i++)
     {

      if(rsi_buffer[i+1] > 70 && rsi_buffer[i] < rsi_buffer[i+1])
        {

         times_high = time[i+1];
         break;

        }

     }

   if((total_bar_high == 0 || total_bar_high > 12) && (min_time1 == times_high))
     {

      max_high_static = max_high;
      min_time1_static = min_time1;

     }
   else
      if(min_time1 != times_high && total_bar_high > 13)
        {
         max_high_static = 0;
         min_time1_static = 0;
        }

   if((total_bar_low == 0 || total_bar_low > 12) && (min_time2 == time_low))
     {

      min_low_static = min_low;
      min_time2_static = min_time2;

     }

   else
      if(min_time2 != time_low && total_bar_low > 13)
        {
         min_low_static = 0;
         min_time2_static = 0;
        }
  }
Explanation:
RSI and Candlestick High/Low Identification:
- The indicator's activity in relation to overbought or oversold levels is used by the RSI logic to assess whether a high or low is forming.
- The program determines the highest high or lowest low from the associated candlesticks if this is the case.
- Using Bars(), the program calculates how many candles have formed since the last high or low.
- The high or low values are updated only if at least 12 candles have elapsed, preventing frequent changes.
- If more than 13 candles form and the RSI condition for the previous high or low is no longer valid, the stored values are cleared.
- This ensures the EA does not rely on outdated information for its trading decisions.
In this section, we enhance the EA to visually represent the identified RSI highs and lows by plotting lines directly on the chart. This not only allows the EA to use these line objects to identify the highs and lows programmatically but also enables traders to monitor the critical levels manually for better decision-making.
#include <Trade/Trade.mqh>
CTrade trade;

// Magic number
input int MagicNumber = 1111;

int rsi_handle;
double rsi_buffer[];

double open[];
double close[];
double high[];
double low[];
datetime time[];

double max_high = 0;
datetime min_time1 = 0;
double min_low = 0;
datetime min_time2 = 0;

datetime time_low = 0;
datetime times_high = 0;

string high_obj_name = "High_Line";
string low_obj_name = "Low_Line";

long chart_id;

//+------------------------------------------------------------------+
//| Expert initialization function                                   |
//+------------------------------------------------------------------+
int OnInit()
  {
// Configure RSI buffer as a series for easier indexing
   ArraySetAsSeries(rsi_buffer, true);

// Initialize RSI handle for the current symbol, timeframe, and parameters
   rsi_handle = iRSI(_Symbol, PERIOD_CURRENT, 14, PRICE_CLOSE);

// Configure candlestick arrays as series
   ArraySetAsSeries(open, true);
   ArraySetAsSeries(close, true);
   ArraySetAsSeries(high, true);
   ArraySetAsSeries(low, true);
   ArraySetAsSeries(time, true);

// Set the magic number
   trade.SetExpertMagicNumber(MagicNumber);

   return (INIT_SUCCEEDED); // Indicate successful initialization
  }

//+------------------------------------------------------------------+
//| Expert tick function                                             |
//+------------------------------------------------------------------+
void OnTick()
  {
// Copy RSI values from the indicator into the buffer
   CopyBuffer(rsi_handle, 0, 1, 100, rsi_buffer);

// Copy candlestick data
   CopyOpen(_Symbol, PERIOD_CURRENT, 1, 100, open);
   CopyClose(_Symbol, PERIOD_CURRENT, 1, 100, close);
   CopyHigh(_Symbol, PERIOD_CURRENT, 1, 100, high);
   CopyLow(_Symbol, PERIOD_CURRENT, 1, 100, low);
   CopyTime(_Symbol, PERIOD_CURRENT, 1, 100, time);

   static double max_high_static = max_high;
   static datetime min_time1_static = min_time1;

   static double min_low_static = min_low;
   static datetime min_time2_static = min_time2;

//CHART ID
   chart_id = ChartID();

   int total_bar_high = Bars(_Symbol,PERIOD_CURRENT,min_time1_static,TimeCurrent());

   for(int i = 0; i < 12; i++)
     {

      if(close[i] < open[i] && close[i+1] > open[i+1])
        {

         max_high = (double)MathMax(high[i],high[i+1]);
         min_time1 = (datetime)MathMin(time[i],time[i+1]);

         break;

        }
     }

   int total_bar_low = Bars(_Symbol,PERIOD_CURRENT,min_time2_static,TimeCurrent());
   for(int i = 0; i < 12; i++)
     {

      if(close[i] > open[i] && close[i+1] < open[i+1])
        {

         min_low = (double)MathMin(low[i],low[i+1]);

         min_time2 = (datetime)MathMin(time[i],time[i+1]);
         break;

        }

     }

   for(int i = 0; i < 12; i++)
     {

      if(rsi_buffer[i+1] < 30 && rsi_buffer[i] > rsi_buffer[i+1])
        {

         time_low = time[i+1];
         break;

        }

     }

   for(int i = 0; i < 12; i++)
     {

      if(rsi_buffer[i+1] > 70 && rsi_buffer[i] < rsi_buffer[i+1])
        {

         times_high = time[i+1];
         break;

        }

     }

   if((total_bar_high == 0 || total_bar_high > 12) && (min_time1 == times_high))
     {

      max_high_static = max_high;
      min_time1_static = min_time1;

     }
   else
      if(min_time1 != times_high && total_bar_high > 13)
        {
         max_high_static = 0;
         min_time1_static = 0;
        }

   if((total_bar_low == 0 || total_bar_low > 12) && (min_time2 == time_low))
     {

      min_low_static = min_low;
      min_time2_static = min_time2;

     }

   else
      if(min_time2 != time_low && total_bar_low > 13)
        {
         min_low_static = 0;
         min_time2_static = 0;
        }

   ObjectCreate(ChartID(),high_obj_name,OBJ_TREND,0,min_time1_static,max_high_static,TimeCurrent(),max_high_static);
   ObjectSetInteger(chart_id,high_obj_name,OBJPROP_COLOR,clrGreen);
   ObjectSetInteger(chart_id,high_obj_name,OBJPROP_WIDTH,3);

   ObjectCreate(ChartID(),low_obj_name,OBJ_TREND,0,min_time2_static,min_low_static,TimeCurrent(),min_low_static);
   ObjectSetInteger(chart_id,low_obj_name,OBJPROP_COLOR,clrRed);
   ObjectSetInteger(chart_id,low_obj_name,OBJPROP_WIDTH,3);
  }
Explanation:
The code creates two trend lines on the chart using the ObjectCreate() function: high_obj_name, which marks the high, and low_obj_name, which marks the low. These trend lines extend to the present time (TimeCurrent()) and are derived from the computed high and low price levels (max_high_static and min_low_static) for the corresponding times (min_time1_static and min_time2_static). This enables the trader to visually monitor the chart's high and low points.
You can alter how these trend lines look by using the ObjectSetInteger() function. It is set to green for the high trend line and red for the low trend line. For both lines to be easily readable on the chart, their width is set to 3. Both the trader and the EA may more easily keep an eye on key price levels and assess possible market movements like liquidity sweeps with the use of this visual tool.
2.3.7. Specifying Buy and Sell Conditions for Liquidity Sweeps
The trading conditions must ensure precision and adherence to specific market scenarios to qualify for a liquidity sweep of the identified highs and lows. This section establishes the logic for executing buy and sell trades around these critical levels.
// Magic number
input int MagicNumber = 1111;

int       rsi_handle;
double    rsi_buffer[];

double open[];
double close[];
double high[];
double low[];
datetime time[];

double max_high = 0;
datetime min_time1 = 0;
double min_low = 0;
datetime min_time2 = 0;

datetime time_low = 0;
datetime times_high = 0;

string high_obj_name = "High_Line";
string low_obj_name = "Low_Line";

long chart_id;
double take_profit;
double  ask_price = 0;

//+------------------------------------------------------------------+
//| Expert initialization function                                   |
//+------------------------------------------------------------------+
int OnInit()
  {
// Configure RSI buffer as a series for easier indexing
   ArraySetAsSeries(rsi_buffer, true);

// Initialize RSI handle for the current symbol, timeframe, and parameters
   rsi_handle = iRSI(_Symbol, PERIOD_CURRENT, 14, PRICE_CLOSE);

// Configure candlestick arrays as series
   ArraySetAsSeries(open, true);
   ArraySetAsSeries(close, true);
   ArraySetAsSeries(high, true);
   ArraySetAsSeries(low, true);
   ArraySetAsSeries(time, true);

// Set the magic number
   trade.SetExpertMagicNumber(MagicNumber);

   return (INIT_SUCCEEDED); // Indicate successful initialization
  }

//+------------------------------------------------------------------+
//| Expert tick function                                             |
//+------------------------------------------------------------------+
void OnTick()
  {
// Copy RSI values from the indicator into the buffer
   CopyBuffer(rsi_handle, 0, 1, 100, rsi_buffer);

// Copy candlestick data
   CopyOpen(_Symbol, PERIOD_CURRENT, 1, 100, open);
   CopyClose(_Symbol, PERIOD_CURRENT, 1, 100, close);
   CopyHigh(_Symbol, PERIOD_CURRENT, 1, 100, high);
   CopyLow(_Symbol, PERIOD_CURRENT, 1, 100, low);
   CopyTime(_Symbol, PERIOD_CURRENT, 1, 100, time);

   static double max_high_static = max_high;
   static datetime min_time1_static = min_time1;

   static double min_low_static = min_low;
   static datetime min_time2_static = min_time2;


//GETTING TOTAL POSITIONS

   int totalPositions = 0;

   for(int i = 0; i < PositionsTotal(); i++)
     {
      ulong ticket = PositionGetTicket(i);

      if(PositionSelectByTicket(ticket))
        {

         if(PositionGetInteger(POSITION_MAGIC) == MagicNumber && PositionGetString(POSITION_SYMBOL) == ChartSymbol(chart_id))
           {

            totalPositions++;

           }
        }
     }

   ask_price = SymbolInfoDouble(_Symbol,SYMBOL_ASK);

   if(totalPositions < 1)
     {

      if(((low[0] < min_low_static && close[0] > min_low_static && close[0] > open[0]) || (low[1] < min_low_static && close[0] > min_low_static
            && close[0] > open[0]) || (low[2] < min_low_static && close[0] > min_low_static
                                       && close[0] > open[0] && close[1] < open[1])))
        {

         take_profit = (close[0] - low[0]) * 3 + close[0];

         trade.Buy(0.5,_Symbol,ask_price, low[0], take_profit);

        }

      else
         if(((high[0] > max_high_static && close[0] < max_high_static && close[0] < open[0]) || (high[1] > max_high_static && close[0] < max_high_static
               && close[0] < open[0]) || (high[2] > max_high_static && close[0] < max_high_static
                                          && close[0] < open[0] && close[1] > open[1])))
           {

            take_profit = MathAbs((high[0] - close[0]) * 3 - close[0]); // Adjusted take-profit calculation

            trade.Sell(0.5,_Symbol,ask_price, high[0], take_profit);
           }
     }

//CHART ID
   chart_id = ChartID();

   int total_bar_high = Bars(_Symbol,PERIOD_CURRENT,min_time1_static,TimeCurrent());

   for(int i = 0; i < 12; i++)
     {

      if(close[i] < open[i] && close[i+1] > open[i+1])
        {

         max_high = (double)MathMax(high[i],high[i+1]);
         min_time1 = (datetime)MathMin(time[i],time[i+1]);

         break;

        }
     }

   int total_bar_low = Bars(_Symbol,PERIOD_CURRENT,min_time2_static,TimeCurrent());
   for(int i = 0; i < 12; i++)
     {

      if(close[i] > open[i] && close[i+1] < open[i+1])
        {

         min_low = (double)MathMin(low[i],low[i+1]);

         min_time2 = (datetime)MathMin(time[i],time[i+1]);
         break;

        }

     }

   for(int i = 0; i < 12; i++)
     {

      if(rsi_buffer[i+1] < 30 && rsi_buffer[i] > rsi_buffer[i+1])
        {

         time_low = time[i+1];
         break;

        }

     }

   for(int i = 0; i < 12; i++)
     {

      if(rsi_buffer[i+1] > 70 && rsi_buffer[i] < rsi_buffer[i+1])
        {

         times_high = time[i+1];
         break;

        }

     }

   if((total_bar_high == 0 || total_bar_high > 12) && (min_time1 == times_high))
     {

      max_high_static = max_high;
      min_time1_static = min_time1;

     }
   else
      if(min_time1 != times_high && total_bar_high > 13)
        {
         max_high_static = 0;
         min_time1_static = 0;
        }

   if((total_bar_low == 0 || total_bar_low > 12) && (min_time2 == time_low))
     {

      min_low_static = min_low;
      min_time2_static = min_time2;

     }

   else
      if(min_time2 != time_low && total_bar_low > 13)
        {
         min_low_static = 0;
         min_time2_static = 0;
        }

   ObjectCreate(ChartID(),high_obj_name,OBJ_TREND,0,min_time1_static,max_high_static,TimeCurrent(),max_high_static);
   ObjectSetInteger(chart_id,high_obj_name,OBJPROP_COLOR,clrGreen);
   ObjectSetInteger(chart_id,high_obj_name,OBJPROP_WIDTH,3);

   ObjectCreate(ChartID(),low_obj_name,OBJ_TREND,0,min_time2_static,min_low_static,TimeCurrent(),min_low_static);
   ObjectSetInteger(chart_id,low_obj_name,OBJPROP_COLOR,clrRed);
   ObjectSetInteger(chart_id,low_obj_name,OBJPROP_WIDTH,3);
  }
Explanation:
Preventing Multiple Positions with totalPositions
The totalPositions variable ensures that the Expert Advisor (EA) maintains only one active position at a time. This mechanism prevents overexposure by checking all open positions and verifying if the magic number (identifier for the EA's trades) and the symbol match the current chart. If no matching position exists (totalPositions < 1), the EA evaluates conditions to place a new trade.
This safety mechanism ensures disciplined trade execution and avoids overlapping positions, making the strategy easier to manage and less prone to compounding risks.
Conditions for Buy Trades (Low Liquidity Sweep)
The buy trade logic is centered around detecting a liquidity sweep at a previously identified low level (min_low_static) and ensuring bullish confirmation.
Conditions
Break Below the Low:
- Any of the three recent candles (low[0], low[1], or low[2]) must fall below the identified minimum low, suggesting that liquidity has been swept below the key level.
Bullish Recovery:
- The current closing price (close[0]) must recover above the minimum low (min_low_static), signaling bullish intent after the sweep.
- Additionally, the candle must be bullish (close[0] > open[0]), reflecting upward momentum.
- If two candles before the current one (close[1] < open[1]) were bearish, it adds a reversal component, reinforcing the sweep's legitimacy.
Trade Execution
Once the conditions are satisfied, a buy order is executed with:- Take Profit: Three times the range between the closing price and the low (take_profit = (close[0] - low[0]) * 3 + close[0]).
- Stop Loss: The identified minimum low level (low[0]).
Conditions for Sell Trades (High Liquidity Sweep)
The sell trade logic mirrors the buy logic but focuses on identifying a liquidity sweep at a previously established high level (max_high_static) with bearish confirmation.
Conditions
Break Above the High:
- Any of the three recent candles (high[0], high[1], or high[2]) must exceed the identified maximum high, indicating a sweep of liquidity above this key level.
Bearish Reversal:
- The current closing price (close[0]) must fall below the maximum high (max_high_static), indicating a failure to sustain the breakout.
- Additionally, the candle must be bearish (close[0] < open[0]), suggesting downward momentum.
- If two candles before the current one (close[1] > open[1]) were bullish, it highlights a potential reversal
Trade Execution
Once the conditions are met, a sell order is placed with:
- Take Profit: Three times the range between the high and the closing price (take_profit = MathAbs((high[0] - close[0]) * 3 - close[0])).
- Stop Loss: The identified maximum high level (high[0]).
Summary
By combining the totalPositions mechanism with well-defined buy and sell conditions, this strategy ensures precision and limits risk in trading decisions:
- Buy trades are triggered after a sweep below a key low level with a bullish recovery.
- Sell trades are initiated after a sweep above a key high level with a bearish reversal.
This structured approach leverages liquidity sweeps as a core concept while ensuring that trades are executed only under favorable conditions. One limitation of this method is that the stop loss is set dynamically based on the low[0] or high[0] of the candle. This means the risk per trade varies depending on the size of the candlestick, leading to inconsistent exposure. To address this, the strategy should allow specifying a fixed percentage of the account balance to risk per trade (e.g., 2%). This ensures consistent risk management by calculating position size based on the distance between the entry price and the stop loss, aligned with the specified risk percentage.
2.3.8. Risk Management and Break-Even Modifications
When working with built-in indicators, effective risk management is essential to ensure consistent performance. Candle sizes can vary significantly, making it crucial to specify the percentage of your account balance you want to risk per trade. This consistency allows your risk-reward ratio (RRR) to compensate for losses during winning trades. Additionally, break-even modifications ensure that profits are secured when trades move in favor of the strategy. Incorporating break-even modifications secures profits when trades move in your favor, enhancing overall strategy robustness.
Example:
//+------------------------------------------------------------------+
//|                                      MQL5INDICATORS_PROJECT4.mq5 |
//|                                  Copyright 2024, MetaQuotes Ltd. |
//|                                             https://www.mql5.com |
//+------------------------------------------------------------------+
#property copyright "ForexYMN"
#property link      "crownsoyin@gmail.com"
#property version   "1.00"

#include <Trade/Trade.mqh>
CTrade trade;

// Magic number
input int    MagicNumber = 1111;
input double account_balance          = 1000;  // Account Balance
input double percentage_risk = 2.0;   //     How many percent of the account do you want to risk per trade?
input bool   allow_modify  = false; // Do you allow break even modifications?
input int    rrr           = 3;      // Choose Risk Reward Ratio

int       rsi_handle;
double    rsi_buffer[];

double open[];
double close[];
double high[];
double low[];
datetime time[];

double max_high = 0;
datetime min_time1 = 0;
double min_low = 0;
datetime min_time2 = 0;

datetime time_low = 0;
datetime times_high = 0;

string high_obj_name = "High_Line";
string low_obj_name = "Low_Line";

long chart_id;
double take_profit;
double  ask_price = 0;
double lot_size;
double risk_Amount;
double points_risk;

// Risk modification
double positionProfit = 0;
double positionopen = 0;
double positionTP = 0;
double positionSL = 0;
double modifyLevel = 0.0;
//+------------------------------------------------------------------+
//| Expert initialization function                                   |
//+------------------------------------------------------------------+
int OnInit()
  {
// Configure RSI buffer as a series for easier indexing
   ArraySetAsSeries(rsi_buffer, true);

// Initialize RSI handle for the current symbol, timeframe, and parameters
   rsi_handle = iRSI(_Symbol, PERIOD_CURRENT, 14, PRICE_CLOSE);

// Configure candlestick arrays as series
   ArraySetAsSeries(open, true);
   ArraySetAsSeries(close, true);
   ArraySetAsSeries(high, true);
   ArraySetAsSeries(low, true);
   ArraySetAsSeries(time, true);

// Set the magic number
   trade.SetExpertMagicNumber(MagicNumber);

   return (INIT_SUCCEEDED); // Indicate successful initialization
  }

//+------------------------------------------------------------------+
//| Expert tick function                                             |
//+------------------------------------------------------------------+
void OnTick()
  {

   int currBars = iBars(_Symbol,_Period);
   static int prevBars = currBars;
   if(prevBars == currBars)
      return;
   prevBars = currBars;
// Copy RSI values from the indicator into the buffer
   CopyBuffer(rsi_handle, 0, 1, 100, rsi_buffer);

// Copy candlestick data
   CopyOpen(_Symbol, PERIOD_CURRENT, 1, 100, open);
   CopyClose(_Symbol, PERIOD_CURRENT, 1, 100, close);
   CopyHigh(_Symbol, PERIOD_CURRENT, 1, 100, high);
   CopyLow(_Symbol, PERIOD_CURRENT, 1, 100, low);
   CopyTime(_Symbol, PERIOD_CURRENT, 1, 100, time);

   static double max_high_static = max_high;
   static datetime min_time1_static = min_time1;

   static double min_low_static = min_low;
   static datetime min_time2_static = min_time2;

//GETTING TOTAL POSITIONS

   int totalPositions = 0;

   for(int i = 0; i < PositionsTotal(); i++)
     {
      ulong ticket = PositionGetTicket(i);

      if(PositionSelectByTicket(ticket))
        {

         if(PositionGetInteger(POSITION_MAGIC) == MagicNumber && PositionGetString(POSITION_SYMBOL) == ChartSymbol(chart_id))
           {


            totalPositions++;

           }
        }
     }

   ask_price = SymbolInfoDouble(_Symbol,SYMBOL_ASK);

   if(totalPositions < 1)
     {

      if(((low[0] < min_low_static && close[0] > min_low_static && close[0] > open[0]) || (low[1] < min_low_static && close[0] > min_low_static
            && close[0] > open[0]) || (low[2] < min_low_static && close[0] > min_low_static
                                       && close[0] > open[0] && close[1] < open[1])))
        {

         take_profit = (close[0] - low[0]) * rrr + close[0];
         points_risk = close[0] - low[0];

         double riskAmount = account_balance * (percentage_risk / 100.0);
         double minus = NormalizeDouble(close[0] - low[0],5);
         lot_size = CalculateLotSize(_Symbol, riskAmount, minus);

         trade.Buy(lot_size,_Symbol,ask_price, low[0], take_profit);

        }

      else
         if(((high[0] > max_high_static && close[0] < max_high_static && close[0] < open[0]) || (high[1] > max_high_static && close[0] < max_high_static
               && close[0] < open[0]) || (high[2] > max_high_static && close[0] < max_high_static
                                          && close[0] < open[0] && close[1] > open[1])))
           {

            take_profit = MathAbs((high[0] - close[0]) * rrr - close[0]); // Adjusted take-profit calculation
            points_risk = MathAbs(high[0] - close[0]);

            double riskAmount = account_balance * (percentage_risk / 100.0);
            double minus = NormalizeDouble(high[0] - close[0],5);
            lot_size = CalculateLotSize(_Symbol, riskAmount, minus);

            trade.Sell(lot_size,_Symbol,ask_price, high[0], take_profit);
           }

     }

//CHART ID
   chart_id = ChartID();

   int total_bar_high = Bars(_Symbol,PERIOD_CURRENT,min_time1_static,TimeCurrent());

   for(int i = 0; i < 12; i++)
     {

      if(close[i] < open[i] && close[i+1] > open[i+1])
        {

         max_high = (double)MathMax(high[i],high[i+1]);
         min_time1 = (datetime)MathMin(time[i],time[i+1]);

         break;

        }
     }

   int total_bar_low = Bars(_Symbol,PERIOD_CURRENT,min_time2_static,TimeCurrent());
   for(int i = 0; i < 12; i++)
     {

      if(close[i] > open[i] && close[i+1] < open[i+1])
        {

         min_low = (double)MathMin(low[i],low[i+1]);

         min_time2 = (datetime)MathMin(time[i],time[i+1]);
         break;

        }

     }

   for(int i = 0; i < 12; i++)
     {

      if(rsi_buffer[i+1] < 30 && rsi_buffer[i] > rsi_buffer[i+1])
        {

         time_low = time[i+1];
         break;

        }

     }

   for(int i = 0; i < 12; i++)
     {

      if(rsi_buffer[i+1] > 70 && rsi_buffer[i] < rsi_buffer[i+1])
        {

         times_high = time[i+1];
         break;

        }

     }

   if((total_bar_high == 0 || total_bar_high > 12) && (min_time1 == times_high))
     {
      max_high_static = max_high;
      min_time1_static = min_time1;
     }
   else
      if(min_time1 != times_high && total_bar_high > 13)
        {
         max_high_static = 0;
         min_time1_static = 0;
        }
   if((total_bar_low == 0 || total_bar_low > 12) && (min_time2 == time_low))
     {
      min_low_static = min_low;
      min_time2_static = min_time2;
     }
   else
      if(min_time2 != time_low && total_bar_low > 13)
        {
         min_low_static = 0;
         min_time2_static = 0;
        }

   ObjectCreate(ChartID(),high_obj_name,OBJ_TREND,0,min_time1_static,max_high_static,TimeCurrent(),max_high_static);
   ObjectSetInteger(chart_id,high_obj_name,OBJPROP_COLOR,clrGreen);
   ObjectSetInteger(chart_id,high_obj_name,OBJPROP_WIDTH,3);


   ObjectCreate(ChartID(),low_obj_name,OBJ_TREND,0,min_time2_static,min_low_static,TimeCurrent(),min_low_static);
   ObjectSetInteger(chart_id,low_obj_name,OBJPROP_COLOR,clrRed);
   ObjectSetInteger(chart_id,low_obj_name,OBJPROP_WIDTH,3);

   if(allow_modify)
     {
      for(int i = 0; i < PositionsTotal(); i++)
        {
         ulong ticket = PositionGetTicket(i);

         if(PositionSelectByTicket(ticket))
           {
            positionopen = PositionGetDouble(POSITION_PRICE_OPEN);
            positionTP = PositionGetDouble(POSITION_TP);
            positionSL = PositionGetDouble(POSITION_SL);
            positionProfit = PositionGetDouble(POSITION_PROFIT);


            if(PositionGetInteger(POSITION_TYPE) == POSITION_TYPE_SELL && PositionGetInteger(POSITION_MAGIC) == MagicNumber && PositionGetString(POSITION_SYMBOL) == ChartSymbol(chart_id))
              {

               modifyLevel = MathAbs(NormalizeDouble((positionSL - positionopen) - positionopen,4));

               if(ask_price <= modifyLevel)
                 {

                  trade.PositionModify(ticket, positionopen, positionTP);
                 }
              }

            if(PositionGetInteger(POSITION_TYPE) == POSITION_TYPE_BUY && PositionGetInteger(POSITION_MAGIC) == MagicNumber && PositionGetString(POSITION_SYMBOL) == ChartSymbol(chart_id))
              {

               modifyLevel = MathAbs(NormalizeDouble((positionopen - positionSL) + positionopen,4));

               if(ask_price >= modifyLevel)
                 {
                  trade.PositionModify(ticket, positionopen, positionTP);
                 }
              }

           }
        }

     }

  }

//+------------------------------------------------------------------+
//| Function to calculate the lot size based on risk amount and stop loss
//+------------------------------------------------------------------+
double CalculateLotSize(string symbol, double riskAmount, double stopLossPips)
  {
// Get symbol information
   double point = SymbolInfoDouble(symbol, SYMBOL_POINT);
   double tickValue = SymbolInfoDouble(symbol, SYMBOL_TRADE_TICK_VALUE);

// Calculate pip value per lot
   double pipValuePerLot = tickValue / point;

// Calculate the stop loss value in currency
   double stopLossValue = stopLossPips * pipValuePerLot;

// Calculate the lot size
   double lotSize = riskAmount / stopLossValue;

// Round the lot size to the nearest acceptable lot step
   double lotStep = SymbolInfoDouble(symbol, SYMBOL_VOLUME_STEP);
   lotSize = MathFloor(lotSize / lotStep) * lotStep;

// Ensure the lot size is within the allowed range
   double minLot = SymbolInfoDouble(symbol, SYMBOL_VOLUME_MIN);
   double maxLot = SymbolInfoDouble(symbol, SYMBOL_VOLUME_MAX);
   if(lotSize < minLot)
      lotSize = minLot;
   if(lotSize > maxLot)
      lotSize = maxLot;

   return lotSize;
  }
Explanation:
input double account_balance   = 1000;  // Account Balance
input double percentage_risk   = 2.0;   // How many percent of the account do you want to risk per trade?
input bool   allow_modify      = false; // Do you allow break even modifications?
input int    rrr               = 3;     // Choose Risk Reward Ratio
The inputs define key parameters for managing risk in the trading strategy. account_balance specifies a fixed account balance, used to calculate how much to risk per trade, ensuring consistency. percentage_risk determines the percentage of the account balance to risk on each trade, helping control exposure and maintain stable risk levels. rrr (Risk-Reward Ratio) sets the desired reward relative to the risk, ensuring that the strategy aims for larger profits than losses. The allow_modify input controls whether the stop-loss should be moved to break even once a trade moves in favor of the strategy. If enabled, it secures profits and reduces the risk of winning trades. Together, these inputs create a disciplined approach to trading by ensuring consistent risk per trade and protecting profits when trades are successful.
take_profit = (close[0] - low[0]) * rrr + close[0];
points_risk = close[0] - low[0];

double riskAmount = account_balance * (percentage_risk / 100.0);
double minus = NormalizeDouble(close[0] - low[0],5);
lot_size = CalculateLotSize(_Symbol, riskAmount, minus);

trade.Buy(lot_size,_Symbol,ask_price, low[0], take_profit);
- take_profit = (close[0] - low[0]) * rrr + close[0]; calculates the take-profit level by multiplying the distance between the current close price and the low of the candle by the risk-reward ratio (rrr). The result is added to the close price to set a profit target above the entry point.
- points_risk = close[0] - low[0]; calculates the risk distance from the entry price (close) to the stop-loss (low) of the candle.
- riskAmount = account_balance * (percentage_risk / 100.0); calculates the amount to risk per trade based on the account balance and the risk percentage.
- lot_size = CalculateLotSize(_Symbol, riskAmount, minus); calculates the lot size based on the risk amount and the stop-loss distance (minus), ensuring that the trade aligns with the defined risk.
For Sell trades:
- take_profit = MathAbs((high[0] - close[0]) * rrr - close[0]); adjusts the take-profit calculation by using the distance between the current close price and the high of the candle, again considering the risk-reward ratio.
- points_risk = MathAbs(high[0] - close[0]); calculates the risk distance for a sell trade from the entry point to the stop-loss level (high of the candle).
- The rest of the logic (risk amount and lot size calculation) is the same as for buy trades, ensuring consistent risk management for both trade types.
if(allow_modify)
  {
   for(int i = 0; i < PositionsTotal(); i++)
     {
      ulong ticket = PositionGetTicket(i);


      if(PositionSelectByTicket(ticket))
        {
         positionopen = PositionGetDouble(POSITION_PRICE_OPEN);
         positionTP = PositionGetDouble(POSITION_TP);
         positionSL = PositionGetDouble(POSITION_SL);
         positionProfit = PositionGetDouble(POSITION_PROFIT);

         if(PositionGetInteger(POSITION_TYPE) == POSITION_TYPE_SELL && PositionGetInteger(POSITION_MAGIC) == MagicNumber && PositionGetString(POSITION_SYMBOL) == ChartSymbol(chart_id))
           {

            modifyLevel = MathAbs(NormalizeDouble((positionSL - positionopen) - positionopen,4));

            if(ask_price <= modifyLevel)
              {

               trade.PositionModify(ticket, positionopen, positionTP);
              }
           }

         if(PositionGetInteger(POSITION_TYPE) == POSITION_TYPE_BUY && PositionGetInteger(POSITION_MAGIC) == MagicNumber && PositionGetString(POSITION_SYMBOL) == ChartSymbol(chart_id))
           {

            modifyLevel = MathAbs(NormalizeDouble((positionopen - positionSL) + positionopen,4));

            if(ask_price >= modifyLevel)
              {
               trade.PositionModify(ticket, positionopen, positionTP);
              }
           }
        }
     }
  }
The code provided handles the logic for modifying active positions based on certain conditions, specifically focusing on implementing break-even adjustments for both buy and sell positions. Here's a breakdown of what the code does:
Checking for Modify Permission (allow_modify):
- The "if(allow_modify)" block ensures that the modification logic only runs if break-even modifications are allowed, as defined by the user.
- The for loop iterates through all currently open positions (PositionsTotal()). Each position is checked to see if it meets the conditions for modification.
Selecting Position:
- The code retrieves the ticket of each position (PositionGetTicket(i)) and uses it to select the position (PositionSelectByTicket(ticket)).
Fetching Position Details:
For each selected position, the following details are retrieved:
- positionopen: The price at which the position was opened.
- positionTP: The take-profit level of the position.
- positionSL: The stop-loss level of the position.
- positionProfit: The current profit of the position.
Sell Position Modification:
- The code checks if the position is a sell position (POSITION_TYPE_SELL).
- It calculates the modifyLevel as the absolute difference between the stop-loss (positionSL) and the open price (positionopen), and then checks if the current ask price (ask_price) has reached or passed this level.
- If the condition is met, the stop-loss is modified to the open price (break-even), leaving the take-profit unchanged (trade.PositionModify(ticket, positionopen, positionTP)).
- Similarly, for a buy position (POSITION_TYPE_BUY), it calculates the modifyLevel as the absolute difference between the open price and stop-loss, and checks if the ask price has moved favorably past this level.
- If the condition is met, it modifies the stop-loss to the open price (break-even) and keeps the take-profit unchanged.
Conclusion
In this article, we explored the use of built-in indicators in MQL5 using a practical, project-based approach. We developed an Expert Advisor (EA) for automatic trading using the RSI as an example, concentrating on trade entries and exits brought on by overbought and oversold signals. We stressed important points along the process, such as employing a risk-reward ratio (RRR) to match profit targets with calculated risks and establishing a constant % risk every trade to manage different candle sizes. To make the strategy more dependable and successful, we also addressed liquidity sweeps and added break-even adjustments to lock in profits as trades developed. This allowed the EA to adjust to abrupt shifts in the market.
 Chemical reaction optimization (CRO) algorithm (Part II): Assembling and results
 Trading with the MQL5 Economic Calendar (Part 4): Implementing Real-Time News Updates in the Dashboard
 Price Action Analysis Toolkit Development Part (4): Analytics Forecaster EA
 Generative Adversarial Networks (GANs) for Synthetic Data in Financial Modeling (Part 1): Introduction to GANs and Synthetic Data in Financial Modeling
- Free trading apps
- Over 8,000 signals for copying
- Economic news for exploring financial markets
You agree to website policy and terms of use
Hello Oluwatosin,
I have noted your request.