
Cycles and Forex

Introduction
Cyclicity is one of the main factors in our world. Cycles allow people to arrange their lives. Knowing cyclic order, we can predict the future. For example, I can confidently say that 2025 starts with January 1st.
Forex cycles can be related to various factors: economic news, time of day, days of the week, months of the year and seasons. Studying these cycles can help a trader predict future price action and make more informed trading decisions.
Cycles can be found in quite unexpected areas. Even the interest in cycles and waves in Forex is cyclical in nature:
- article "The implementation of automatic analysis of the Elliott waves in MQL5" — 2011
- article "Wolfe Waves" — 2017
- article "Benefiting from Forex market seasonality" — 2023
- article "Seasonality Filtering and time period for Deep Learning ONNX models with python for EA" — 2024.
As you can see, articles were published once every 6 years. Only the last article broke this cycle. But maybe there is some other explanation for this deviation?
Let's try to find answers to two questions. Are there cycles in price movement? And if they exist, how can they be used in trading?
Searching for cycles
In trading, cycles can be associated with recurring market trends or patterns. For example, the price may fluctuate within a given channel. And such a behavior may continue for quite a long time.
We can use spectral analysis, trigonometric polynomials, periodograms, auto correlation function and cycle detection algorithms to extract the cyclic component from a time series.
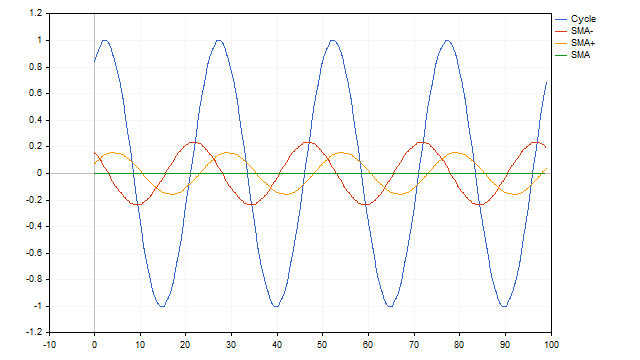
We can also use a simple moving average to find the cycle. This method is the simplest and most visual. Let us assume that we have a time series that is a cycle with period N. If we apply an SMA with the same period to this series, we will get an average level, around which the oscillations occur. The use of SMA with other periods allows us to obtain oscillatory processes that differ from the original. But despite these differences, using such averages it is possible to restore the parameters of the original cycle.
Some time series may be a sum of cycles with different periods. In this case, moving averages will also do well. The algorithm is quite simple. First, we subtract the values of the average with the largest period from the original series. We subtract the values of the next average from the resulting remainders, and continue this operation until we end up with only zeros. We need more SMA.
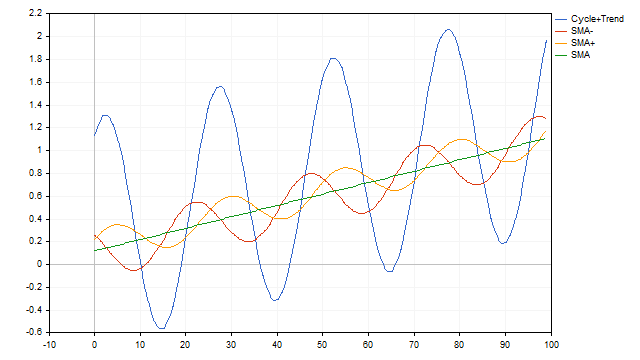
Moving averages will also handle the cycle + trend time series model just as easily. In this case, SMA will act as a cycle and trend detector at the same time.
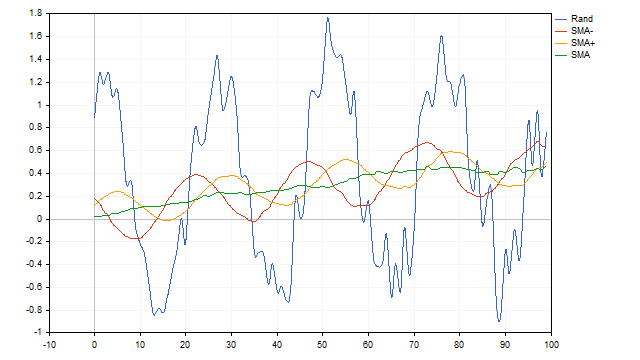
Up to this point, we have been applying a moving average to a deterministic time series - the cycle and trend equations were rigidly defined and did not change over time. Let's add some randomness to the original time series and see how SMA handles this situation. We will take the cycle amplitude as 100%. Let's assume that the amplitude can randomly change within 10% in either direction. The trend speed can vary from 0 to 1%. And let's add 10% white noise to it. SMA successfully copes with this task as well.
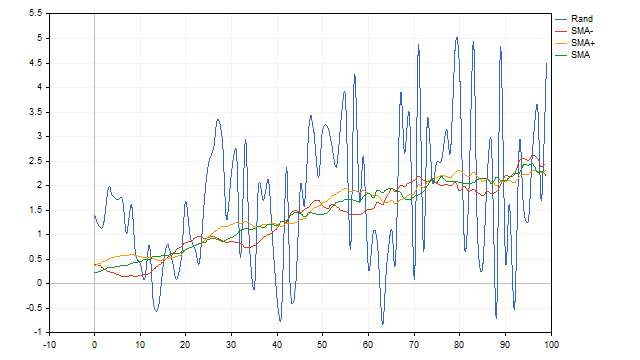
It seems that we have found the perfect indicator. Unfortunately, the drawbacks of SMA may outweigh its advantages. The moving average will not be able to sort out cycles consisting of only positive or negative half-waves. In addition, this indicator has low resolution. In simple terms, it will not be able to isolate a useful signal if the noise exceeds a certain limit.
Another small drawback is that before using SMA it is advisable to know in advance which cycle we need to select. Here we are faced with two questions:
- Is there a cycle in the time series we are studying?
- If there is a cycle, how can we know about its parameters?
To answer these questions, we can use dot mapping.
Look at this graph. Can you tell what it shows?
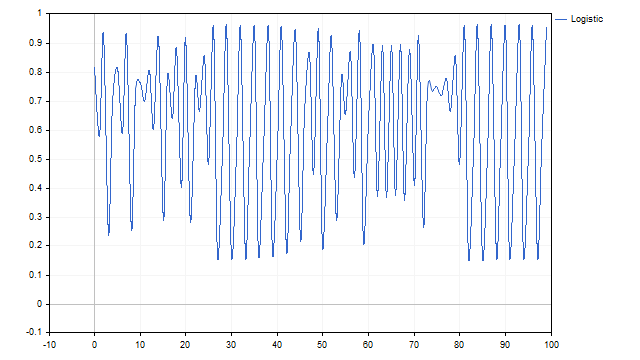
It is possible that this is a graph of the sum of several cycles. Or may be it is part of the the Daleks' master plan.
So, we have a one-dimensional time series with Z[i] values. Based on this, I will construct a two-dimensional graph, and the coordinates of each point of this graph will be set according to the following rule (indexing as in time series):
X[i] = Z[i];
Y[i] = Z[i-1].
The point of this transformation is that I want to display the relationship between two adjacent values of the original time series. For example, this obscure graph provides the following display.
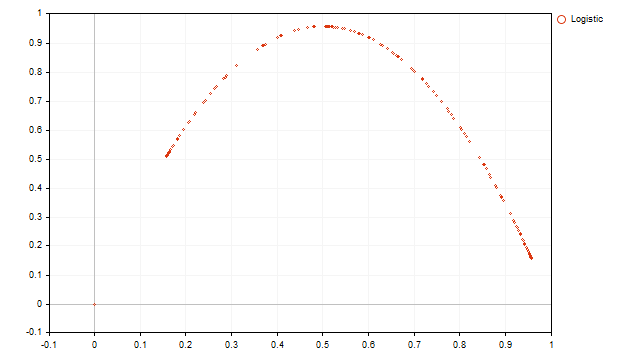
We can see a usual parabola. Knowing the properties of the parabola, we can formulate the equation of the original time series:
![]()
To find the equation ratios, we can use the least squares method. As a result, we will get a logistic map, which was used to generate the values of the original time series.
The dot plot method can be applied to any time series, but it does not always give a clear and precise representation of the time series.
For example, let's examine the pseudo-random number generator. Its graph looks like this:
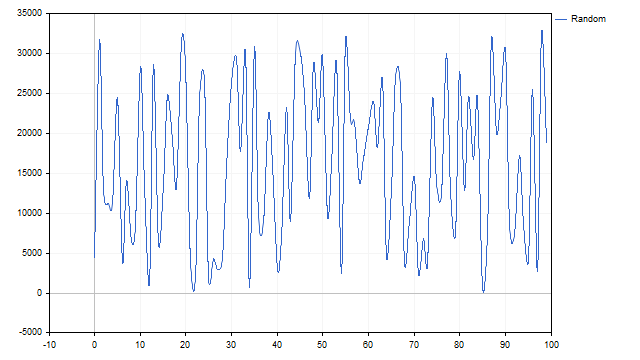
The addition of several cycles is clearly visible. Now we will figure it all out. Construct a dot display of the obtained values.
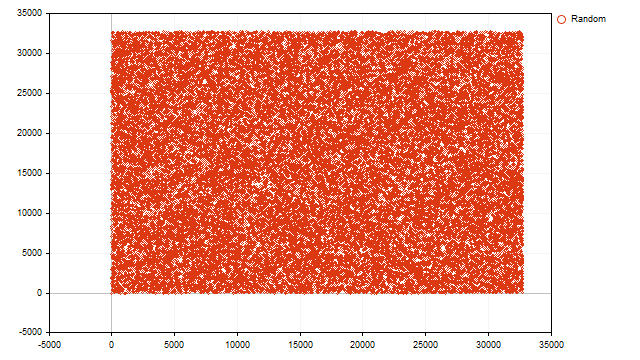
All points evenly fill the entire plane. From this we can conclude that the current value of the pseudo-random number generator does not depend on the previous one, and all matches are random.
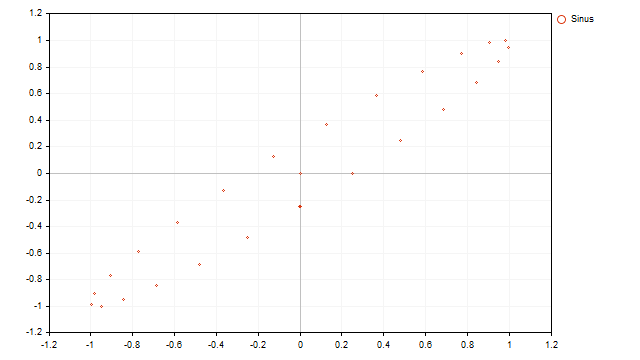
The display of a cyclic process looks cyclical:
Now let's see what the dotted display of real prices looks like:
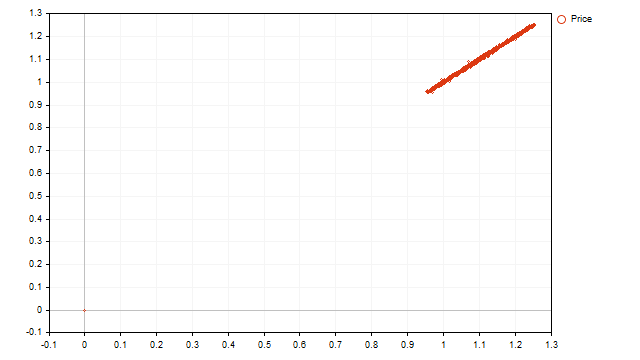
We see an increasing linear trend and no cycles. However, it is too early for us to fall into despair. Looking at this image, we can draw the following conclusions:
- trend is the main factor determining price movement;
- the strength of the trend is large enough and can mask cyclical processes.
The conclusion is obvious - we need more ways to identify cycles.
Cycles and randomness
In 1927, Eugen Slutsky published the article "Addition of random causes as a source of cyclic processes". In this work, he brilliantly demonstrated that cyclical and wave-like processes can arise as a result of the interaction (for example, addition) of random variables.
Let's test how this theory works on financial time series. We will take the prices of different symbols as the initial random variable. In this case, we will do the following: for the current pair, we will take the price of the current bar, for all subsequent symbols, we will take the price 1 bar back. So, the equation for the random variable will be approximately as follows:
![]()
Thus, the resulting random variable will depend on a large number of previous price values of different symbols. Let's strengthen this dependence by building a moving average based on these values.
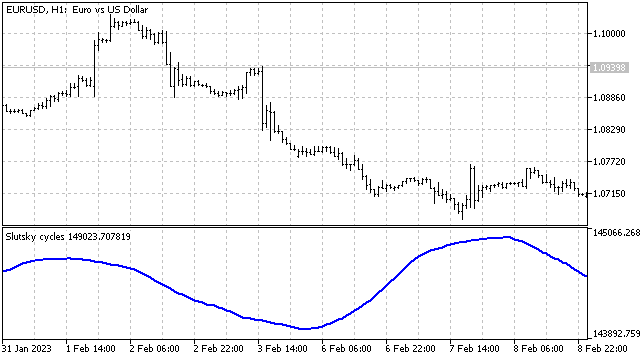
There are wave-like processes. But we would like to know whether they are cyclical? And if there is a cycle, what are its parameters?
To answer these questions, we can use finite differences. The 1 st difference is obtained by subtracting the previous value of the time series from the current one:
![]()
The second finite difference is obtained by subtracting the first differences.
![]()
This difference is interesting because, if certain conditions are met, it may indicate the cyclical nature of the process. Let's assume that we are dealing with some kind of cycle. Let a be the initial value of the angle, and s be its change step. Then the last three points of the time series can be set as:
![]()
Use trigonometric identities to find the 2 nd difference of these values:
![]()
This is the equation for the discrete harmonic oscillator. Please note that here oscillator means an oscillating system, not an indicator.
It is not easy to transfer this equation to prices. On the left side of the equation, we can use any real values as they are, but on the right side, we will have to make some changes.
To isolate the fluctuations, we first need to find the level around which they occur. Let's denote it as MA. Then the equation will look like this:
![]()
On the left side, the MAs will mutually absorb each other, but on the right side, they will remain.
![]()
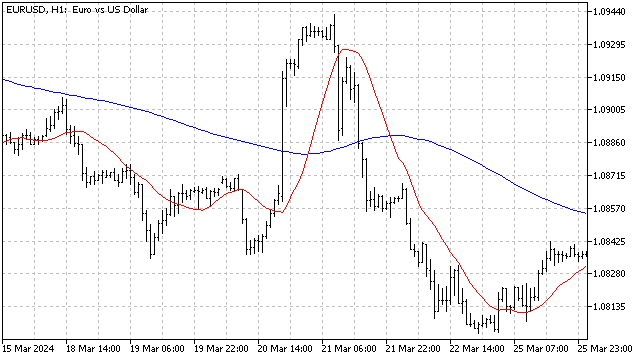
There are several ways to calculate this level. For example, we can first remove the trend from the original time series, or find the average of all values in the series. Both of these methods have one common drawback - they are very dependent on historical data and are weakly responsive to current changes in the market. To get rid of this drawback, I will use the adaptive indicators calculation algorithm. In this case, the MA level will adjust to the current market situation. As a result, we will get an indicator that allows us to track the level, around which the moving average fluctuates. For the example I used SMA, but in practice you can use any price averaging.
Unfortunately, the harmonic oscillator has a number of disadvantages that must be taken into account when using it. It works well with sine signals. But even a mixture of sinusoids can cause difficulties - the oscillator simply will not be able to select the most important cycle.
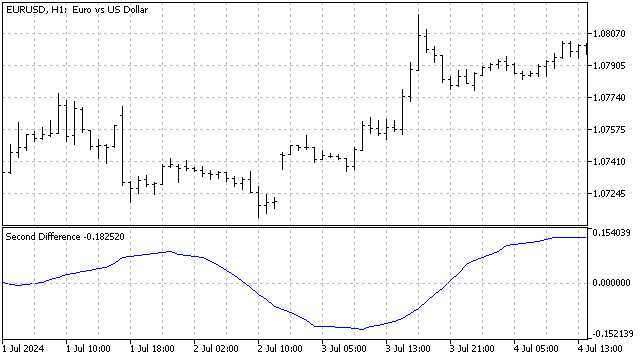
Most of the shortcomings can be solved with the help of the 2 nd difference. In appearance it remains the same. But we can change the distance between the members of this difference. For example, I have a chart with the H1 timeframe open. I assume that there may be a daily cycle in the price movement (period is 24). Then I will use the second difference looking as follows:
![]()
If there is a cycle or cycles in the price movement, then the 2 nd difference will be zero. The appearance of these cycles is not important. The main thing is that they are repeated more or less correctly. Also, the 2 nd difference can easily cope with the trend. The only requirement is that the length of this trend should be no less than twice the period.
How can this method be applied in practice? Let's assume that there is a stable cycle in price movement with some random deviations. Then, if we find the sum of several (in my case 24) last values of differences, then random errors compensate each other. That is, if the cycle and/or trend is stable, the sum of the differences will fluctuate around zero. If there are any disturbances in the market (the beginning of a new trend, the launch of a new cycle, or the end of an old one), the sum of the differences will begin to deviate significantly. Moreover, these deviations may appear cyclical. From this we can conclude that cycle disturbances can be cyclical in nature. It is like a Schrödinger market.
In general, the use of finite differences can be very useful in market analysis. They can be used as is, combined with each other and paired with other indicators. As a result, you can get new interesting tools for studying price movements.
Other differences
It is not necessary to use classical differences when analyzing time series. We can build differences according to our tasks. For this purpose, we can use the principles applied in construction of wavelets.
Let's take some number that will represent the initial wave. The simplest and most obvious option is to take 1. We put 0 to the right and left of this number. We will get a string like this: "0, 1, 0". Now, starting from the second number, we go from left to right and subtract the left number from the right one.
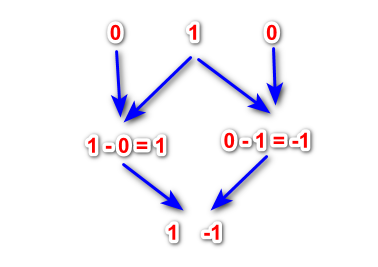
This way we get a level 1 wavelet. Put zeros on the left and right of the resulting ratios and perform subtractions again. This operation can be continued until we reach the desired level of wavelet. Such differences have some properties of classical wavelets and can be used in the analysis of financial time series.
Any group of numbers can be used as the initial wave, for example 1, 2, 1 or 1, 1, 1. In this case, the ratios of the original wave should not be symmetrical relative to the center of the wave. Nothing bad will happen if the original wave is represented as 3, 2, 1. We can also use negative numbers.
Since the sum of the ratios of all the obtained differences is equal to 0, they immediately represent ready-made oscillators.
The disadvantage of such differences is that we do not even imagine what the result will be when using a certain initial wave.
The main advantage of such differences is that with their help we can restore the original signal. For example, we know the values of the 1 st and 2 nd differences. If we subtract the 1 st difference from the current value of the time series, we will get the previous value of the series. Knowing these two values and the 2 nd difference, we get the next value of the series, and so on.
This property allows us to search for similar areas in history. If the differences between different levels are approximately equal to each other, then we have similar price movements.
Conclusion
It is important to remember that the market does not usually follow predictable cycles. Even if we observe some kind of cycle, there is always a risk that the pattern may change. There are waves, but their behavior requires further in-depth study. Either way, understanding market cycles can be a useful tool in any trader's arsenal. By exploring cycles, we can find new ways and means for technical analysis.
The following programs are attached to the article:
| Name | Type | Features |
|---|---|---|
| Dot Mapping | script | display types
After the script completes its work, the images are saved in the Files folder. |
| Slutsky cycles | indicator | Handles all symbols available in Market Watch |
| Slutsky MA | indicator |
|
| Second Difference | indicator |
|
| scr Wavelet | script | displays the wavelet ratios
|
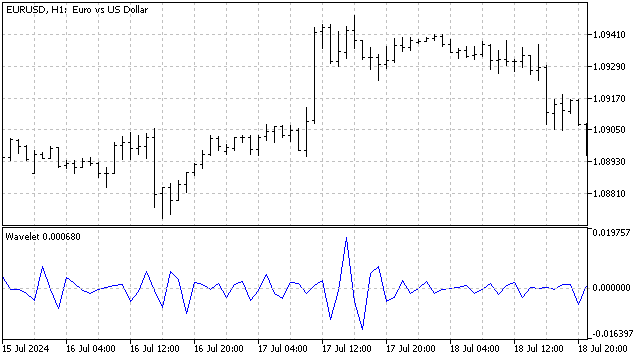
| Wavelet | indicator | Uses wavelets as an oscillator
|
Translated from Russian by MetaQuotes Ltd.
Original article: https://www.mql5.com/ru/articles/15614
- Free trading apps
- Over 8,000 signals for copying
- Economic news for exploring financial markets
You agree to website policy and terms of use