
Angle-based operations for traders

Introduction
Angle-based operations have been used in trading for a very long time. The main advantage of these operations is the simplicity of constructing angles and their clarity. A striking example of angle-based operations are Gann tools.
It would seem that everything about angles is already known. But I will try to look at the angles from a different perspective. Let's try to remember the well-forgotten old things in order to get something completely new.
Building the first angle
The angle is one of the simplest geometric shapes. Draw two lines from one point - what could be simpler? One of the lines most often represents the abscissa axis.
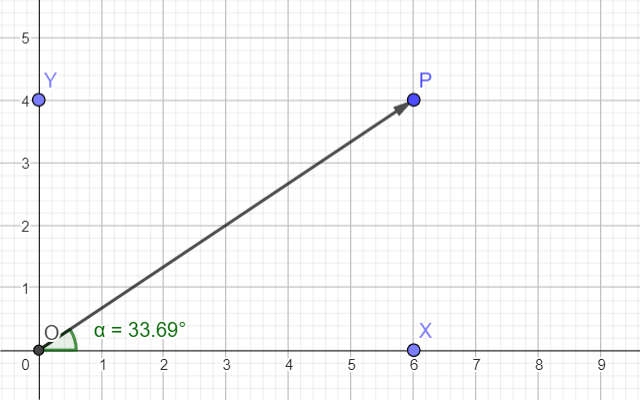
In this case, the angle value is very easy to calculate using the P point coordinates.
Since the angle is a dimensionless quantity, both axes should have the same values. If you measure meters along one axis, and kilograms along the other, then you will get some kind of relationship between them, but not an angle.
Let's try to implement the angle-based operation as an indicator. I will make the following indicator: different currency pairs will be displayed along the X and Y axes. Then a small angle will correspond to a high price for the first currency pair, and a low price for the second. Accordingly, a large angle will indicate that the price of the second symbol is higher than the first. In other words, our future indicator will determine the overbought/oversold state of one currency pair relative to another. Not a bad idea for pairs trading.
The first difficulty we encounter is that we have different values on different axes (for example, I took EURUSD and USDJPY). We can overcome this difficulty easily by dividing the price of each instrument by the point value.
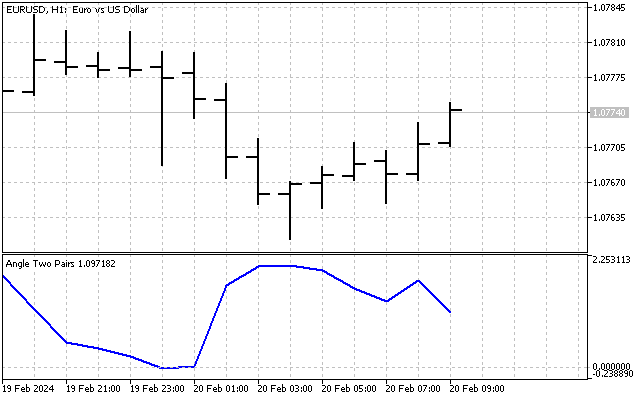
Then we immediately solve two problems - on both axes we will have comparable values (price expressed in points), plus the scale on these axes will be the same. This is what our indicator looks like.
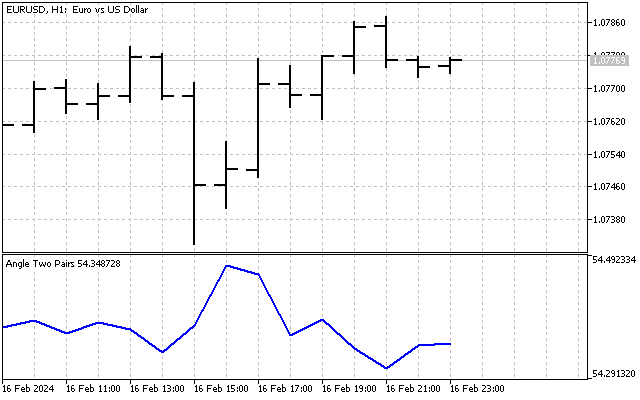
At first glance, the indicator seems rather trivial. Its value fluctuates around some average value, and the difference between the maximum and minimum of the indicator is only 2-3 degrees. But let's not draw premature conclusions. Perhaps we can improve this indicator and make it more informative.
A little reminder. The most common angular measure we use in everyday life is the degree. For mathematical calculations, the radian measure is most often used. The transition from a degree measure to a radian measure and vice versa is carried out according to the following equations:
In other words, converting degrees to radians and vice versa is simply multiplying by some scaling factor. However, if you need to display information numerically, then it is preferable to use degrees. 45° definitely looks better than 0.78539 rad.
Angles and normal distribution
When studying real processes, researchers use various probability distributions of random variables. The most popular one is normal distribution.
Let's recall some of its properties. Its graph is a bell-shaped line. The ends of this line go to infinity.
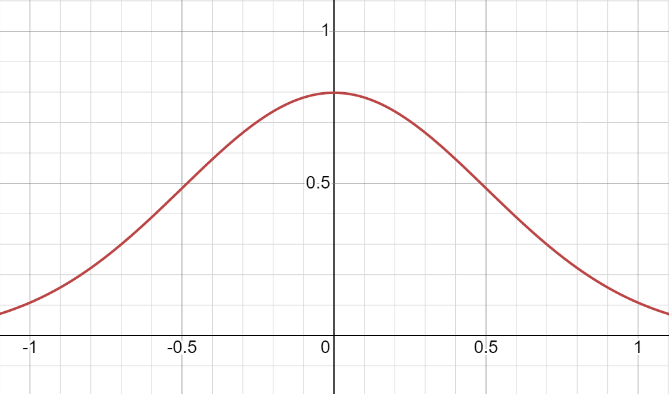
Let's mentally perform the following operation. We will begin to slowly fold the axis X in a circle. While doing this, we will follow the following rule - the further we move away from the center, the stronger the folding will be. If we are patient enough, the X axis will turn into a circle. The line of normal distribution itself will be distorted, and as a result we will get wrapped normal distribution.
The first difference between a regular normal distribution and a wrapped distribution is that -∞ maps to -180°, and +∞ maps to +180°. But this is not our objective. The main purpose of the wrapped normal distribution is to handle angular values. The equation of the wrapped normal distribution looks like this:
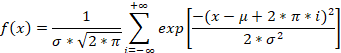
As we can see, the wrapped distribution uses both mean and standard deviation. Everything is like the usual normal distribution. The summation looks pretty unsettling, but we will easily cope with these infinities when working with real data.
Let's take our indicator and apply the wrapped normal distribution to it.
First, we need to determine the average of all angles occurring in history. In our case, finding the average will not be difficult - the usual summation and division by the number of observations. But, generally speaking, the angular average needs to be looked for a little differently. Imagine that you need to find the average of two angles - 10° and 350°. The usual approach gives the answer of 180°. This answer is wrong. Their average is zero.
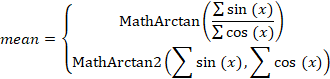
To get the correct answer in any situation we will have to do the following: first we need to find the sums of sines and cosines of all angles. Divide the first sum by the second and get the middle angle tangent.
Now, finding the value of the average angle will not be difficult. But there is a small condition here too. If all angles lie between -90° and +90°, then we can use the MathArctan function. If the angles go beyond these limits, we should definitely use the more universal MathArctan2 function.
Thus, the average angle will be equal to:
After we have estimated the value of the average angle, we can begin to estimate the standard deviation. For this we can use the Yamartino method. First we need to find the auxiliary quantity:
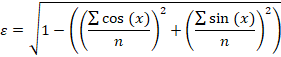
It already provides a fairly accurate estimate of the standard deviation, but it can also be improved:
Now, let's make changes to our indicator. We will calculate its readings as follows: first, we will find the difference between the current and average angles, and then compare this difference with the standard deviation. As a result, we will get a picture like this.
The indicator allows us to more accurately determine overbought/oversold levels, and its closest analogue is the CCI indicator.
Angles and linear function
We have dealt with angles for the same type of data. Is it possible to apply angular operations to a trend? The answer is no, since we are dealing with different types of data - we have time on one axis, and price on the other.
Well, the answer is correct, but wrong nonetheless. Let's recall the linear function. It describes a linear relationship between two independent variables and is given by the equation:
Where is the angle here? It is hidden in the k ratio. This ratio is equal to the tangent of the slope angle of the line relative to the X axis.
Let's try to use this function to describe a trend. The linear function equation for traders will look like this:
In this case, the k ratio will receive another interpretation - it shows the average price change per unit of time. One more small note: I entered time into the equation. But in real calculations, it is much easier to use indices instead of time. Firstly, holidays and weekends will greatly affect the accuracy of the calculations. And secondly, using indices makes equations (and calculations) much simpler. The only requirement for these indices is that they should increase from left to right.
Now let's look at ways to estimate linear trend parameters. First of all, we can use least squares method (LSM). Let me remind you that instead of time, I use indices whose values vary from 0 to n-1.
But there are more reliable ways to evaluate these parameters. For example we can use Theil-Sen estimate. Let's see how this assessment might work in a real-world setting. Let's take a trend with the parameters k=0.25 and b=10. Add a little noise to it in the form of randomly distributed deviations. Using the resulting points, we will try to find the parameters of the initial trend. As a result, we will get something like this.
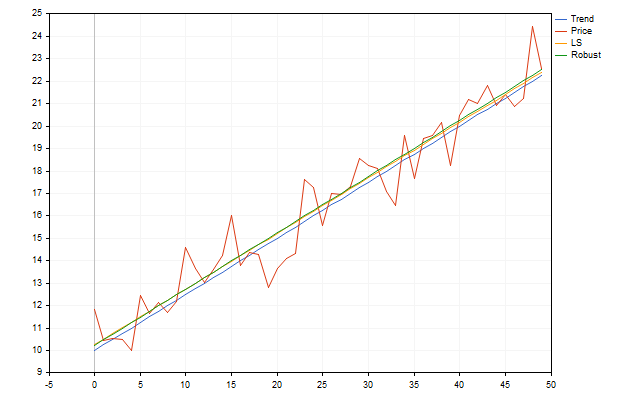
At first glance, it seems that the robust method does not provide much advantage. But this is only because the errors in our trend model were distributed equally and according to the normal law. Actual prices may not meet this criterion. Then the Theil-Sen method will work much better, and it may give a little more information. It is the robust estimate that I will use in the future.
So, let's look at how you can estimate the parameters of a linear trend using the Theil-Sen method. First, we need to make the k parameter. It will be equal to the median from all possible differences of the form:
The median value can be found as follows. First, write all the values into an array. Then sort it. The median will be equal to the value located in the center of the array.
Now we can start estimating the b parameter. To do this, we need to find the median of all possible values:
We have figured out the theory, so it is time to move on to practice. Let's see what possibilities the use of the Theil-Sen estimate opens up for us.
Theil-Sen estimate and indicators
After estimating the trend parameters, we are left with two data arrays. Let's see if we can use these arrays in some other way.
So, we assessed the trend parameters and even built its line. Now we can build a channel within which price movement occurs. To do this, we first need to assess how far prices deviate from the trend line.
Let's use the array that we used when estimating the b parameter. In order to estimate the deviation, we need to find the median absolute deviation. That is, first, for each element of the array, we find the absolute value of difference with the b parameter. Then it remains to find the median of the obtained values. This median will give a robust estimate of the standard deviation.
Knowing the standard deviation, we can build a trend channel. For example, this is what a channel 6 standard deviations wide looks like.
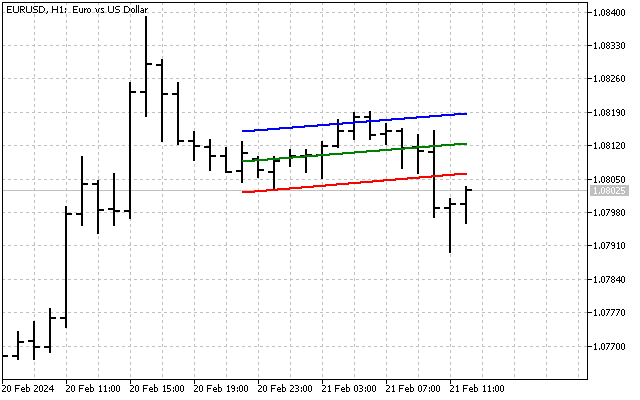
This indicator is essentially similar to Bollinger Bands. In addition, trend channel lines can be used as support and resistance levels.
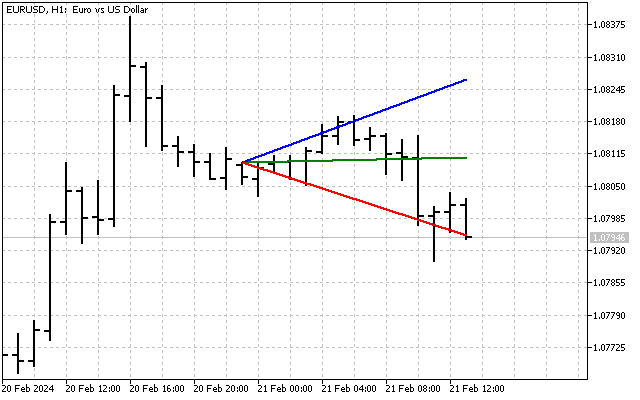
Besides, we can build a fan of trend lines. All calculations are performed in the same way as when constructing a channel. The only difference is that we need to take the k parameter and the corresponding array. This is what a fan looks like with a range of 1 deviation by angle.
Of course, we can combine a channel and a fan. To do this, we first build the channel lines. Then we apply the fan to them. As a result, we will get something like this.
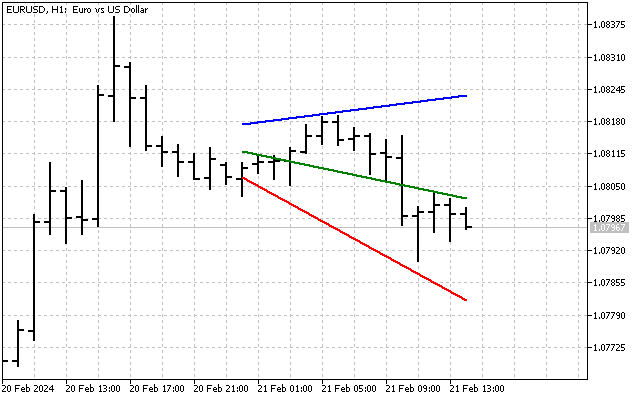
Thus, the use of robust methods allowed us to obtain a trend line, and three additional indicators that can be used in technical analysis.
Additional considerations
Angle-based operations can be used not only for constructing trends and angles. Let's recall the CCI indicator already mentioned in the article. What if we make a similar indicator while using trend angles rather than prices?
Then, we will be able to evaluate trend changes based on history. This is what our indicator will look like.
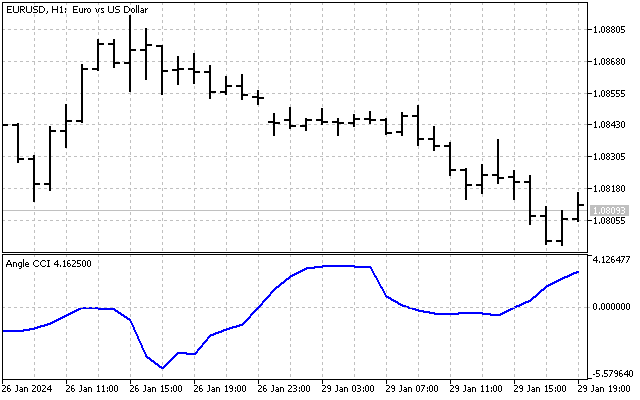
All technical indicators can be converted to work with angular values. With these tweaks, we can discover new ways of technical analysis.
Conclusion
The following programs were used when writing this article.
| Name | Type | Description |
|---|---|---|
| Angle Two Pairs | Indicator |
|
| LS vs Robust | Script | Compare LSM and Theil-Sen estimate |
| Theil–Sen estimator | Indicator |
|
| Angle CCI | Indicator |
|
Translated from Russian by MetaQuotes Ltd.
Original article: https://www.mql5.com/ru/articles/14326
- Free trading apps
- Over 8,000 signals for copying
- Economic news for exploring financial markets
You agree to website policy and terms of use
Gunn's angles made my eyes water.)
First of all, I'm not drawing these corners.
They will easily appear on their own if the vertical axis is continued further.
Secondly, I will use the standard deviation as the vertical unit, and the median price as the axis. The result is something like this.
Instead of a square, we have a rectangle. And the corners show (approximately) the boundaries of Brownian price movement.
Well.
interesting approach
Instead of a square, we get a rectangle. And the corners show (approximately) the boundaries of Brownian price movement.
????? when Brownian motion and some of its boundaries is something, but not a rectangle :-)) This is the kind of maths that should "fly off the teeth". Like the multiplication table.
A figure quite close to a rhombus is obtained from seasonal volatility (day-week-month-quarter). And it will turn out to be a "deciphering" of Ghana's angles and grids without mystical squares and table twisting. You can statistically deduce
a robot trading on the principle similar to your screenshot:
Another way to get angles out of the price. Thanks to Grandpa Gunn.
Another way to get angles out of the price. Thanks to Grandpa Gunn.
strange angle value
Another way to get angles out of the price. Thanks to Grandpa Gunn.
The box (template) is much more convenient, because you get both price and time levels (cut-offs) at once. And within a day it is most accurate to quadrature the past movement, the smallest error in calculations is obtained.