
MQL5 Wizard Techniques you should know (Part 56): Bill Williams Fractals
Introduction
Bill Williams’ fractal indicator is a pivotal and important indicator amongst the collection habits known for. It primarily identifies reversal points in price action of traded symbols. Based on the concept of fractals, as a repetitive 5-bar pattern often marked as bearish if the middle bar of the 5 has the highest high, or bullish in cases where the middle bar has the lowest low. We look at some of this indicator's patterns that can be utilised by traders, as we have in the past with MQL5 wizard articles.
Consecutive Fractals in the Same Direction
For our first pattern, pattern-0, a bullish Formation is defined when a series of bullish fractal lows form at or close to the prior low. This is usually interpreted as the market finding support at that point. It's important to note that by consecutive fractal lows, what is meant is there is no fractal high between the lows. This is a significant indicator because typical patterns are fractal highs following fractal lows, in alternation. For the bullish pattern, though, it is taken to indicate that different buyers are stepping into the market at similar price levels, which reinforces the thesis for an accumulation phase that precedes an upward move.
Conversely, multiple consecutive bearish fractals highs can map a resistance level that price is unable to break through. This strong rejection (or repeated rejection on large time frames) often indicates strong selling pressure and a likely continuation or start of a downtrend.
We implement Pattern-0 in MQL5 as follows:
//+------------------------------------------------------------------+
//| Check for Pattern 0.                                             |
//+------------------------------------------------------------------+
bool CSignalFractals::IsPattern_0(ENUM_POSITION_TYPE T)
{  if(T == POSITION_TYPE_BUY && FractalLow(X() + 1) != 0.0 && FractalLow(X()) != 0.0)
   {  return(true);
   }
   else if(T == POSITION_TYPE_SELL && FractalHigh(X() + 1) != 0.0 && FractalHigh(X()) != 0.0)
   {  return(true);
   }
   return(false);
}
By default, a Bill Williams fractal indicator is provided amongst the suite of inbuilt indicators. It does require some adjusting, too, as a lot of its values for the Upper/Highs and Lower/Lows buffers produce NaNs on initial use. We therefore create a modified version of this by introducing 2 functions; FractalHigh and Fractal Low. The code for both is listed below:
double            FractalHigh(int ind)
{  //
   m_high.Refresh(-1);
   if(m_high.MaxIndex(ind, 5) == ind)
   {  return(m_high.GetData(ind));
   }
   return(0.0);
}
double            FractalLow(int ind)
{  //
   m_low.Refresh(-1);
   if(m_low.MinIndex(ind, 5) == ind)
   {  return(m_low.GetData(ind));
   }
   return(0.0);
}
In the pattern-0 function, we simply call the fractal low function on 2 previous consecutive bars when checking for a bullish Signal or the fractal high on the same when seeking a bearish pattern. This number of consecutive bars can be customized by the reader by being increased if there is a need to filter out more false signals. As is often the case, though, fewer trade setups require testing over longer periods before they can be dependable. We perform all tests for patterns of this indicator on the symbol GBP USD, on the 4-hour timeframe, on the year 2024, having optimized the patterns for the year 2023. The forward walk for pattern-0 gives us the following report.
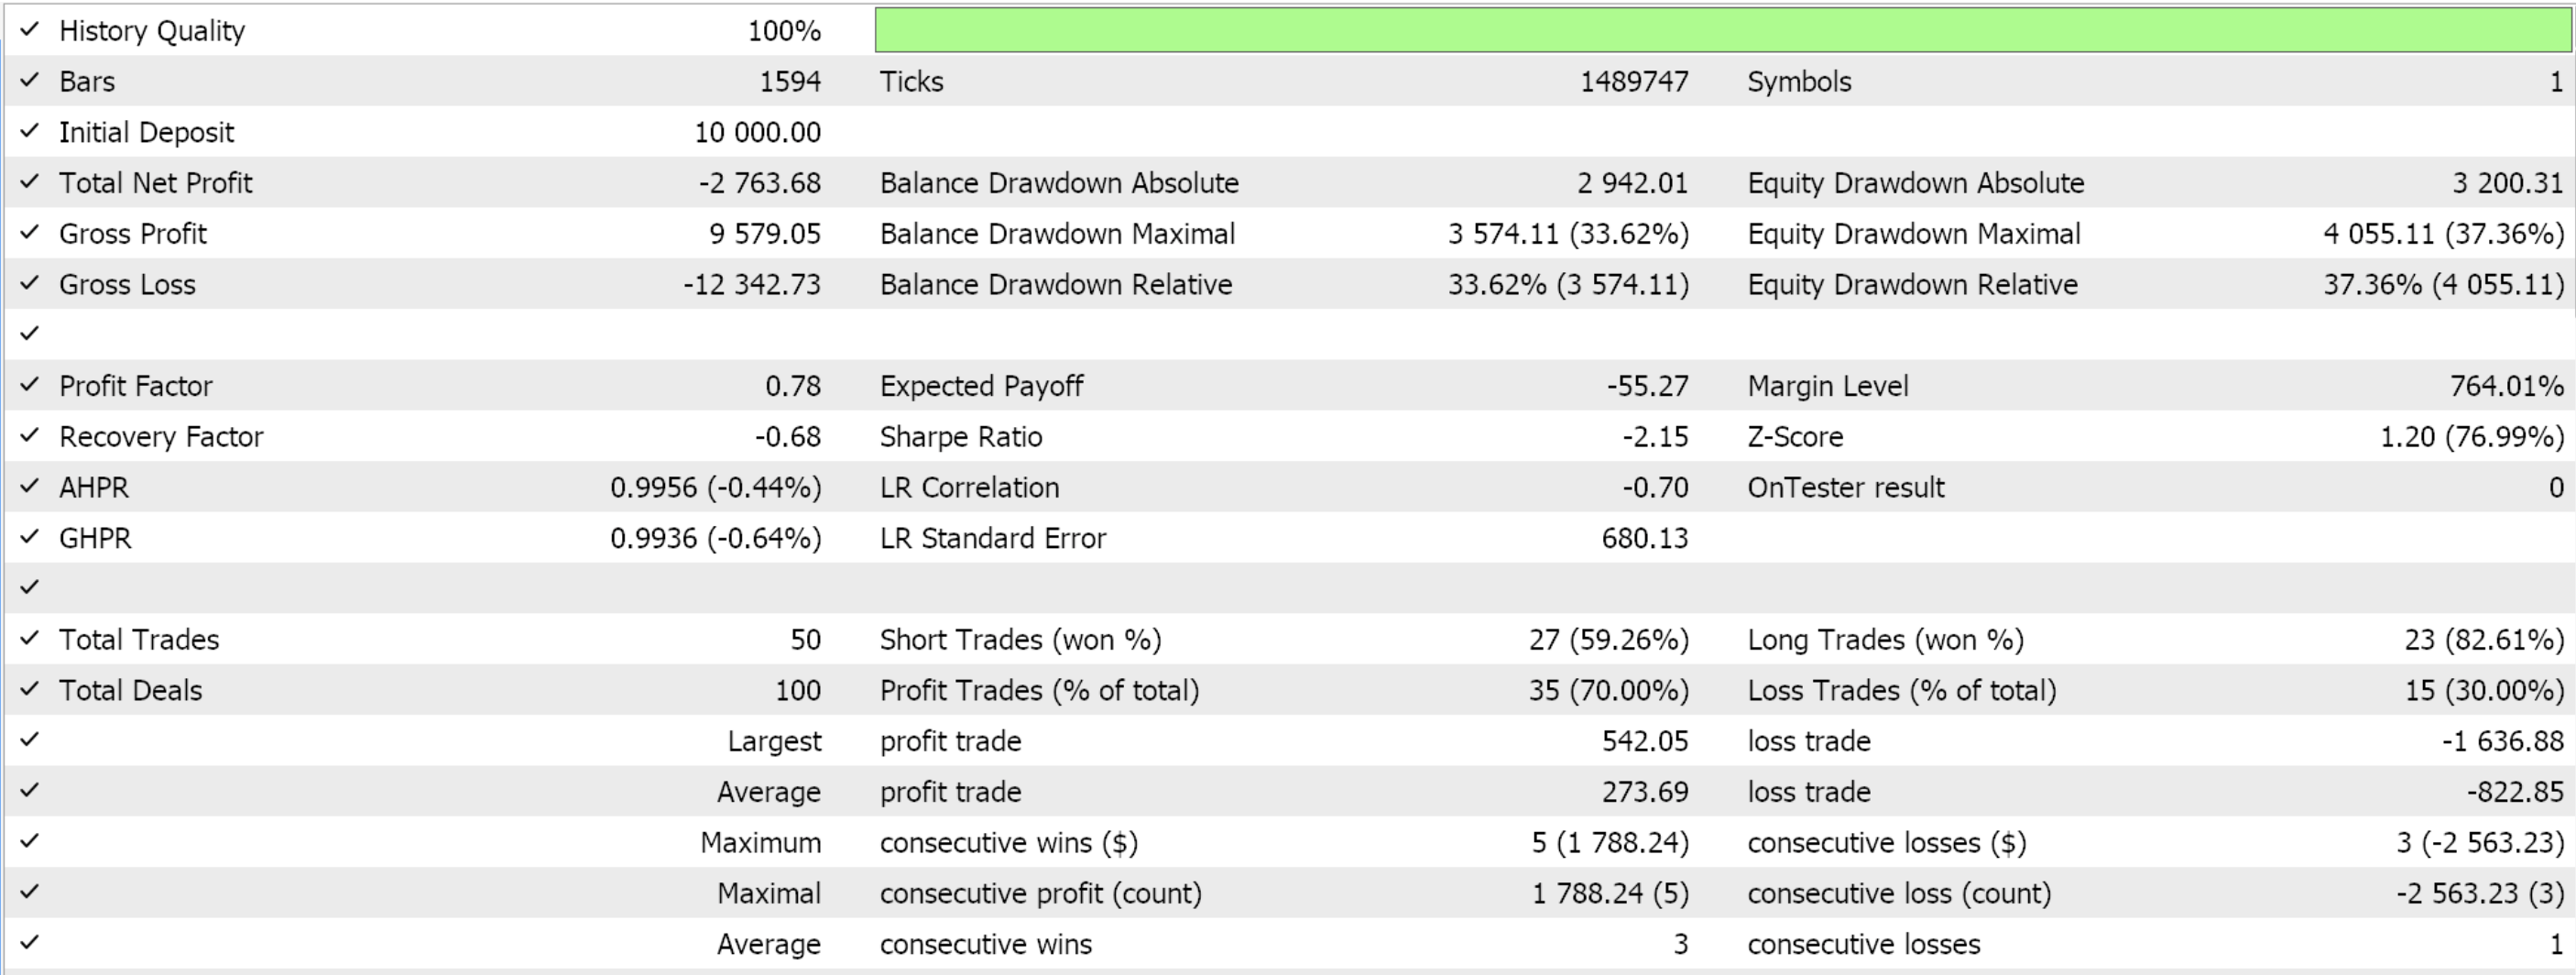
Pattern 0 indicates a strong trend continuations. It therefore can help in reopening positions in a prevalent trend if profit taking had been done.
Fractal Trend Breakout
Pattern-1, our second, defines its bullish formation firstly with a bearish fractal that had served as resistance. A bullish formation occurs when price, going against the grain, decisively breaks above this fractal high. This breakout is then interpreted as buyers overpowering sellers such that the former resistance level flips into a support, thus signalling a trend reversal. This could also be a strong trend continuation if it occurred within a much broader bullish trend that had become less evident on small time frames.
A bearish version of pattern 1 would as one would expect be the opposite. A bullish low fractal would be followed by price breaking below the fractal low mark. This breach is taken as an indication of sellers taking control and setting the stage for a downtrend. We implement this as follows in MQL5:
//+------------------------------------------------------------------+
//| Check for Pattern 1.                                             |
//+------------------------------------------------------------------+
bool CSignalFractals::IsPattern_1(ENUM_POSITION_TYPE T)
{  if(T == POSITION_TYPE_BUY && FractalHigh(X() + 1) != 0.0 && Close(X()) > FractalHigh(X() + 1))
   {  return(true);
   }
   else if(T == POSITION_TYPE_SELL && FractalLow(X() + 1) != 0.0 && Close(X()) < FractalLow(X() + 1))
   {  return(true);
   }
   return(false);
}
In our code above, we are checking for fractal points on the previous bar and then comparing the current close price to that fractal price. As argued in the logic, the fractal high (the bearish fractal) is pertinent to the bullish pattern and the fractal low also matters to the bearish pattern.
The forward run on the year 2024 from optimizing for open and close thresholds for the year 2023 presents us with the following report:
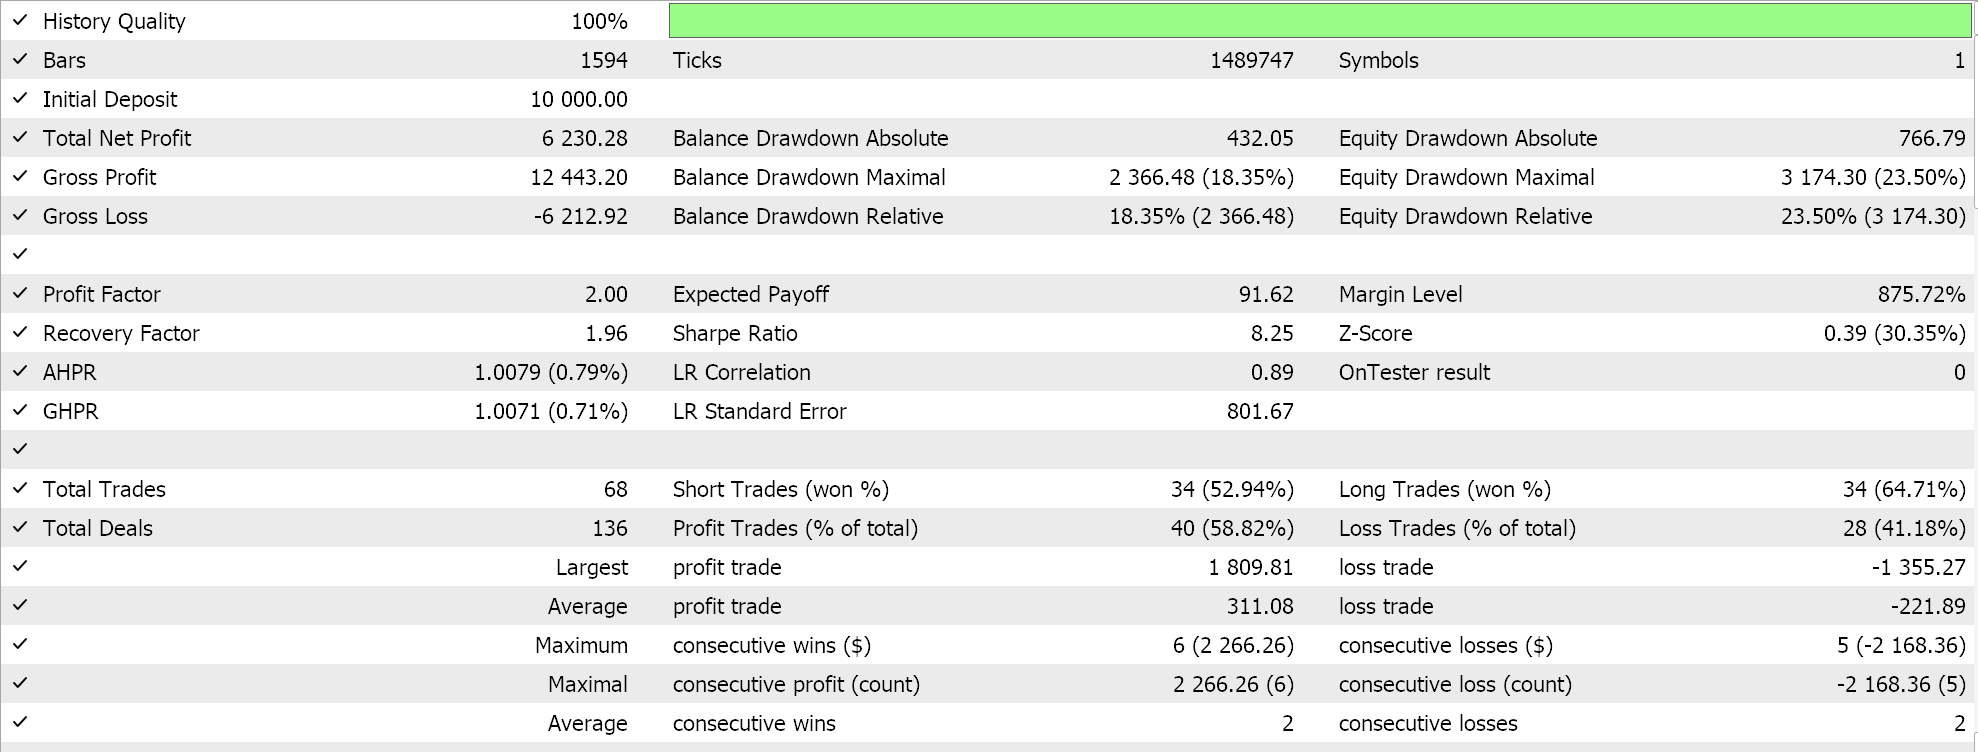
Pattern-1 stands out because unlike pattern-0 which is a continuation, this can serve as a reversal. Because of this, it's always a good idea to use it with other indicators.
Inside Fractals (Lower Highs, Higher Lows)
Pattern-2, has its bullish formation defined when bullish fractals (swing lows) form close to the range of a previous broader fractal. Price action often compresses within this range, with the low fractals almost forming a straight line. So when a move above this tight range is made, then that would confirm a bullish bias as buyers would be pushing price out of a consolidation zone.
On the flip, with a bearish fractal formation, if the swing highs form a cluster within the confines of a prior bearish fractal range this would similarly mark a period of indecision. Once price falls below the lower boundary of this range, and support fails, this breakout to the downside would confirm a bearish move. This is how we implement this in MQL5:
//+------------------------------------------------------------------+
//| Check for Pattern 2.                                             |
//+------------------------------------------------------------------+
bool CSignalFractals::IsPattern_2(ENUM_POSITION_TYPE T)
{  CArrayDouble _buffer;
   if(T == POSITION_TYPE_BUY)
   {  for(int i = 0; i < m_periods; i++)
      {  if(FractalLow(X() + i) != 0.0)
         {  _buffer.Add(FractalLow(X() + i));
         }
      }
      if(_buffer[_buffer.Maximum(0, _buffer.Total())] - _buffer[_buffer.Minimum(0, _buffer.Total())] <= fabs(Close(X()) - Close(X() + 10)))
      {  return(true);
      }
   }
   else if(T == POSITION_TYPE_SELL)
   {  for(int i = 0; i < m_periods; i++)
      {  if(FractalHigh(X() + i) != 0.0)
         {  _buffer.Add(FractalHigh(X() + i));
         }
      }
      if(_buffer[_buffer.Maximum(0, _buffer.Total())] - _buffer[_buffer.Minimum(0, _buffer.Total())] <= fabs(Close(X()) - Close(X() + 10)))
      {  return(true);
      }
   }
   return(false);
}
Implementing this pattern necessitates, as per our approach, the use of an array standard class. This is because we are looking for fractal points over a fixed period, and the number that we'll retrieve is uncertain. With this, we also need to get a sense of the standard deviation of these fractal points.
Because our array class does not provide the standard deviation function like the vector data type and because it is also compute-intense, we opt to take the range of these points instead. In order to get a sense that their range is compressed, we compare it to the magnitude of the trend in the close price and if it is less, we have confirmation.
Strictly speaking, this is a crude assessment as one can easily see that in trending markets when the close price change magnitude gets quite large any set of fractal points range will pass this test. This is why it may be a good idea for readers to make changes that say compare the fractal points range or their standard deviation to an absolute value. This value could be tuned with optimization.
A forward run after optimizing our wizard assembled Expert Advisor, with pair USD JPY on 4-hour time frame gives us these results:
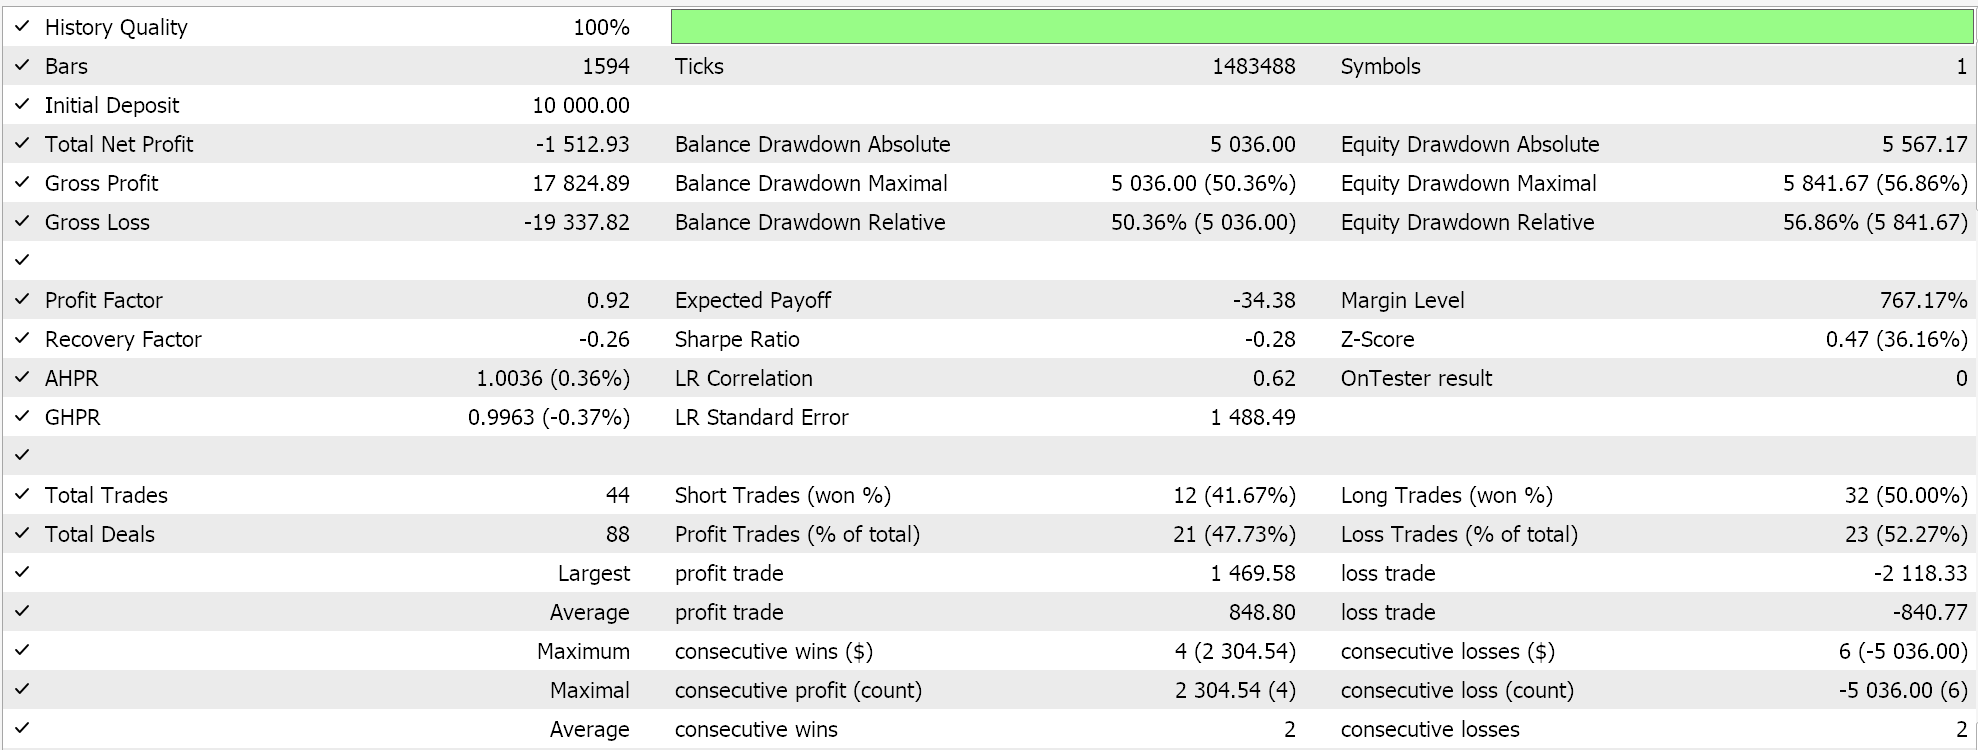
Pattern 2 is a compression pattern that indicates potential for breakout. On multi-timeframes, when you have smaller fractals forming within larger ones, that usually suggests a squeeze before an expansion.
Fractal Divergence with Price Action
Divergence with Price Action is our pattern-3. For this, pattern, a bullish-divergence is seen when price makes a lower low (an indication of sustained downward pressure) however the corresponding bullish fractals (the swing lows) are above those of the prior swing. This divergence is interpreted to be bullish with the argument that despite falling prices the underlying support is strengthening, hinting at an imminent bullish reversal.
A bearish divergence, on the other hand, is when price forms a higher high while the bearish fractal highs are lower than previous ones. This setup usually signals that even though price is rising, the resistance is squeezing price, which could be a forewarning of loss in buying power and reversal to the downside. We implement this in MQL5 as follows:
//+------------------------------------------------------------------+
//| Check for Pattern 3.                                             |
//+------------------------------------------------------------------+
bool CSignalFractals::IsPattern_3(ENUM_POSITION_TYPE T)
{  CArrayDouble _buffer;
   if(T == POSITION_TYPE_BUY)
   {  for(int i = 0; i < m_periods; i++)
      {  if(FractalLow(X() + i) != 0.0)
         {  _buffer.Add(FractalLow(X() + i));
         }
         if(_buffer.Total() >= 2)
         {  break;
         }
      }
      if(_buffer[0] > _buffer[1] && Low(X()) < Low(X() + 1))
      {  return(true);
      }
   }
   else if(T == POSITION_TYPE_SELL)
   {  for(int i = 0; i < m_periods; i++)
      {  if(FractalHigh(X() + i) != 0.0)
         {  _buffer.Add(FractalHigh(X() + i));
         }
         if(_buffer.Total() >= 2)
         {  break;
         }
      }
      if(_buffer[0] < _buffer[1] && High(X()) > High(X() + 1))
      {  return(true);
      }
   }
   return(false);
}
Coding our pattern-3 also necessitates the use of the standard array class that is available in the MQL5 IDE. This is mostly for reasons already mentioned in pattern-2, however in this instance we are looking for only 2 fractal points rather than a collection over a period set by the input parameter ‘m_periods’. We use the 2 fractal points together with the 2 extreme price points in establishing our potential signal, as already argued above.
A post optimization forward-walk for similar symbol, timeframe and test period as the previous patterns presents us with the following report:
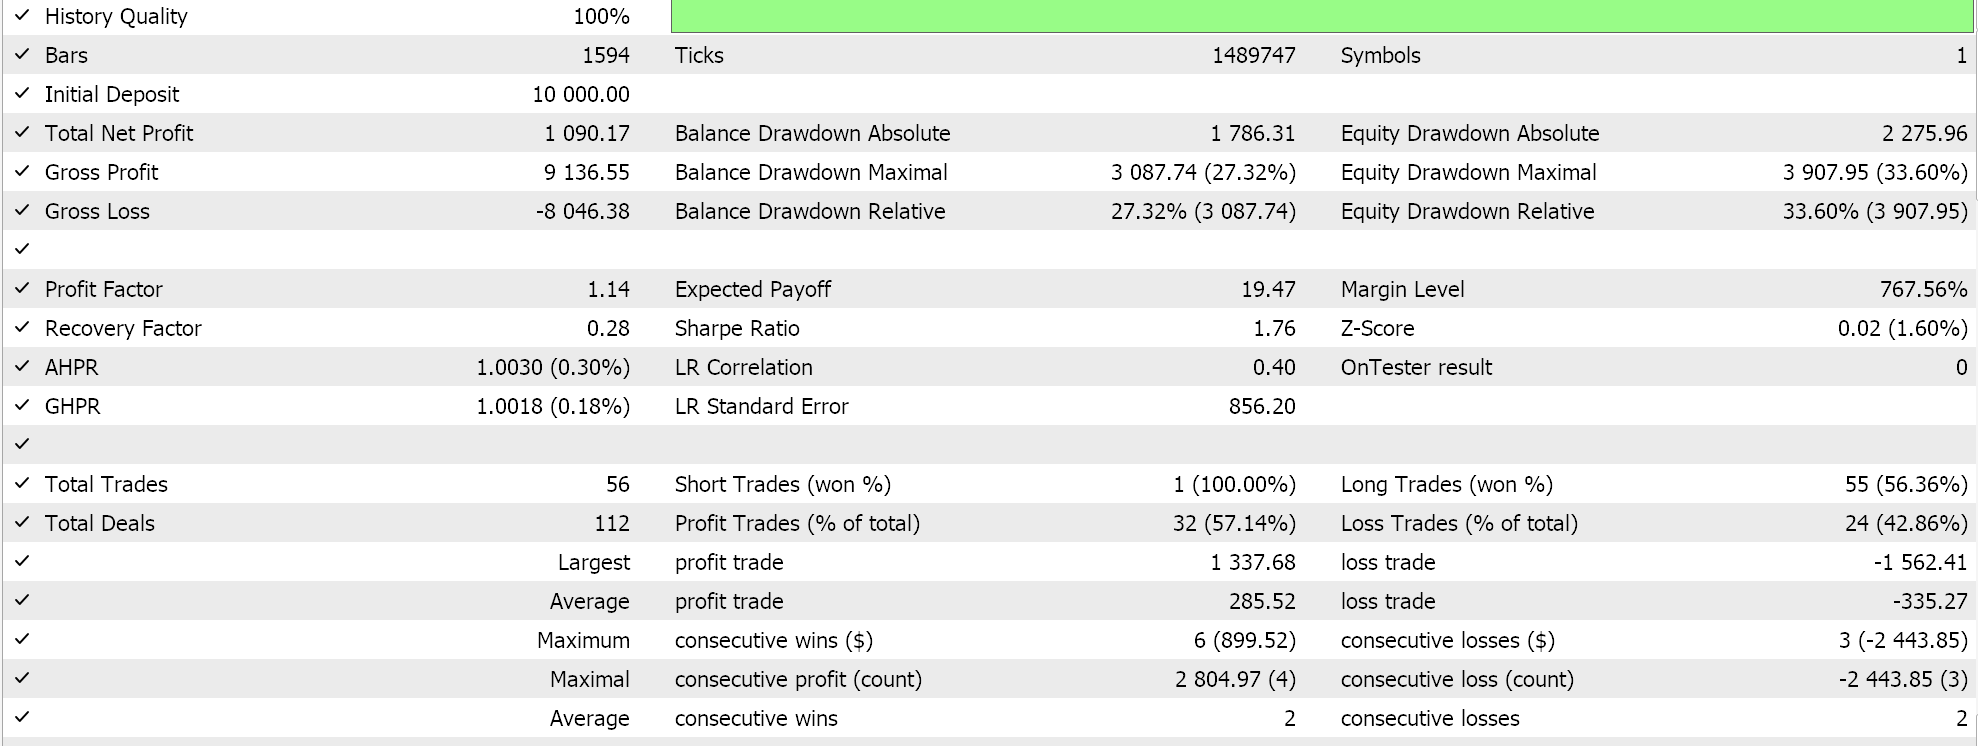
Twin Opposing Fractals (Reversal Zones)
Twin Opposing Fractals make our pattern-4. The bullish formation for this pattern involves two identically placed fractals, a bullish (at lows) and a bearish (at highs). The crisscrossing of these two creates an indecision zone. When price bounces off the bullish fractal and rises above the bearish fractal, a bullish Signal is confirmed.
With the bearish formation, the sequence is a bullish fractal immediately followed by a bearish fractal. If price bounces off the bearish (high) fractal and drops below the bullish fractal, then a sell signal is also confirmed. We code this in MQL5 as follows:
//+------------------------------------------------------------------+
//| Check for Pattern 4.                                             |
//+------------------------------------------------------------------+
bool CSignalFractals::IsPattern_4(ENUM_POSITION_TYPE T)
{  bool _1 = (FractalHigh(X() + 1) != 0.0 && FractalLow(X() + 1) != 0.0);
   bool _2 = (FractalHigh(X() + 2) != 0.0 && FractalLow(X() + 2) != 0.0);
   if(_1 || _2)
   {  if(T == POSITION_TYPE_BUY)
      {  if((_1 && Close(X()) > FractalHigh(X() + 1)) || (_2 && Close(X()) > FractalHigh(X() + 2)))
         {  return(true);
         }
      }
      else if(T == POSITION_TYPE_SELL)
      {  if((_1 && Close(X()) < FractalLow(X() + 1)) || (_2 && Close(X()) < FractalLow(X() + 2)))
         {  return(true);
         }
      }
   }
   return(false);
}
Our code uses two Booleans to check for the twin fractal pattern. We have elected to use 2 Booleans because the effects of this unique pattern could be dragging slightly (as opposed to lagging). Each value marks either the last complete bar, or the bar before it. If the pattern is found, we proceed to simply check for whether the close price breached any of its key levels, as already explained above.
A post optimization forward-walk for this pattern gives us the following report:
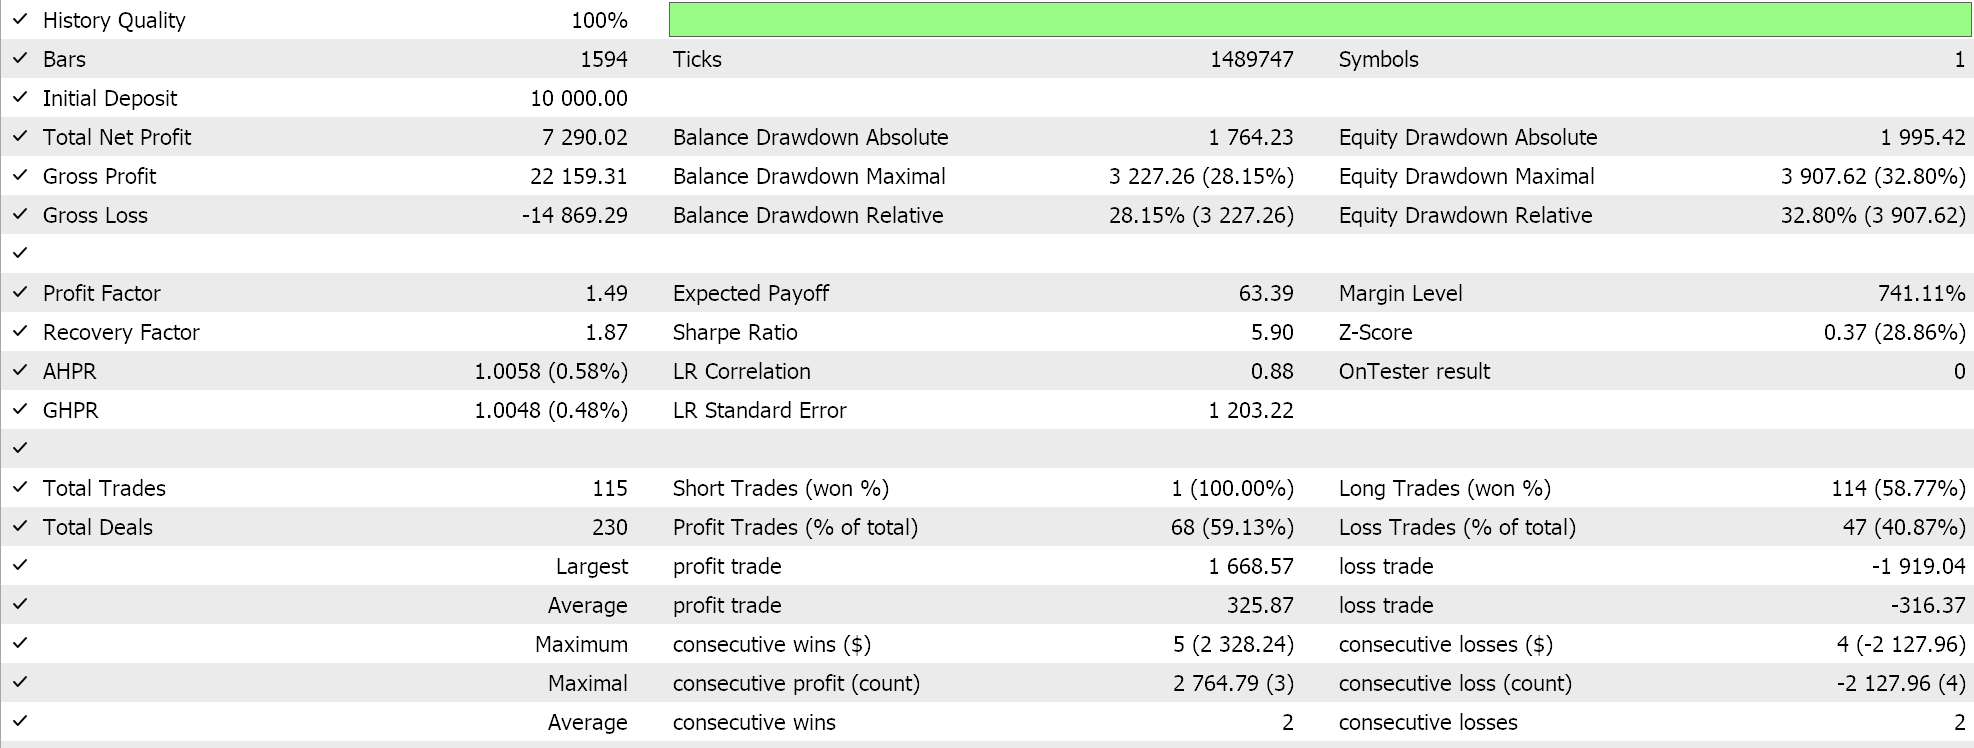
The consecutive appearance of bullish and bearish fractals also highlights another indecision point in the markets. Breakouts on either side, then, are what are used as signals for pattern-4.
Fractal Confirmation of Swing Highs & Lows
For this pattern, Pattern-5, we look at price action over a series of bars in relation to the fractal benchmarks. The bullish formation is defined when a bullish fractal (which is often a potential support level) is set and subsequent price action does not break significantly below this level. If price continues to bounce off of this level, it does reinforce the thesis for it being a bullish support zone.
Conversely, a bearish swing/ formation is established if a fractal high is set and after subsequent price action, price does not exceed the high benchmark of the fractal. The argument here being that the persistent inability to break higher from the fractal does reinforce its role as a resistance area and thus a signal for bearish sentiment. We implement this in MQL5 as follows:
//+------------------------------------------------------------------+
//| Check for Pattern 5.                                             |
//+------------------------------------------------------------------+
bool CSignalFractals::IsPattern_5(ENUM_POSITION_TYPE T)
{  vector _std;
   _std.Init(5);
   _std.Fill(0.0);
   if(T == POSITION_TYPE_BUY && FractalLow(X() + m_periods) != 0.0)
   {  if(_std.CopyRates(m_symbol.Name(), m_period, 4, 0, m_periods) && _std.Std() <= fabs(Close(X()) - Close(X() + m_periods)))
      {  return(true);
      }
   }
   else if(T == POSITION_TYPE_SELL && FractalHigh(X() + m_periods))
   {  if(_std.CopyRates(m_symbol.Name(), m_period, 2, 0, m_periods) && _std.Std() <= fabs(Close(X()) - Close(X() + m_periods)))
      {  return(true);
      }
   }
   return(false);
}
Our code above engages a vector for not only copying the buffer of rates that we need, but also to efficiently retrieving their standard deviation. We compare this deviation to the magnitude of the prevalent trend in close price, as we did with pattern 2. Drawbacks and cautions raised on this in pattern 2 therefore apply here, so the reader is at liberty to make amends in modifying the attached code.
A walk forward run after optimizing with similar symbol, windows, and timeframe as above gives us the following report:
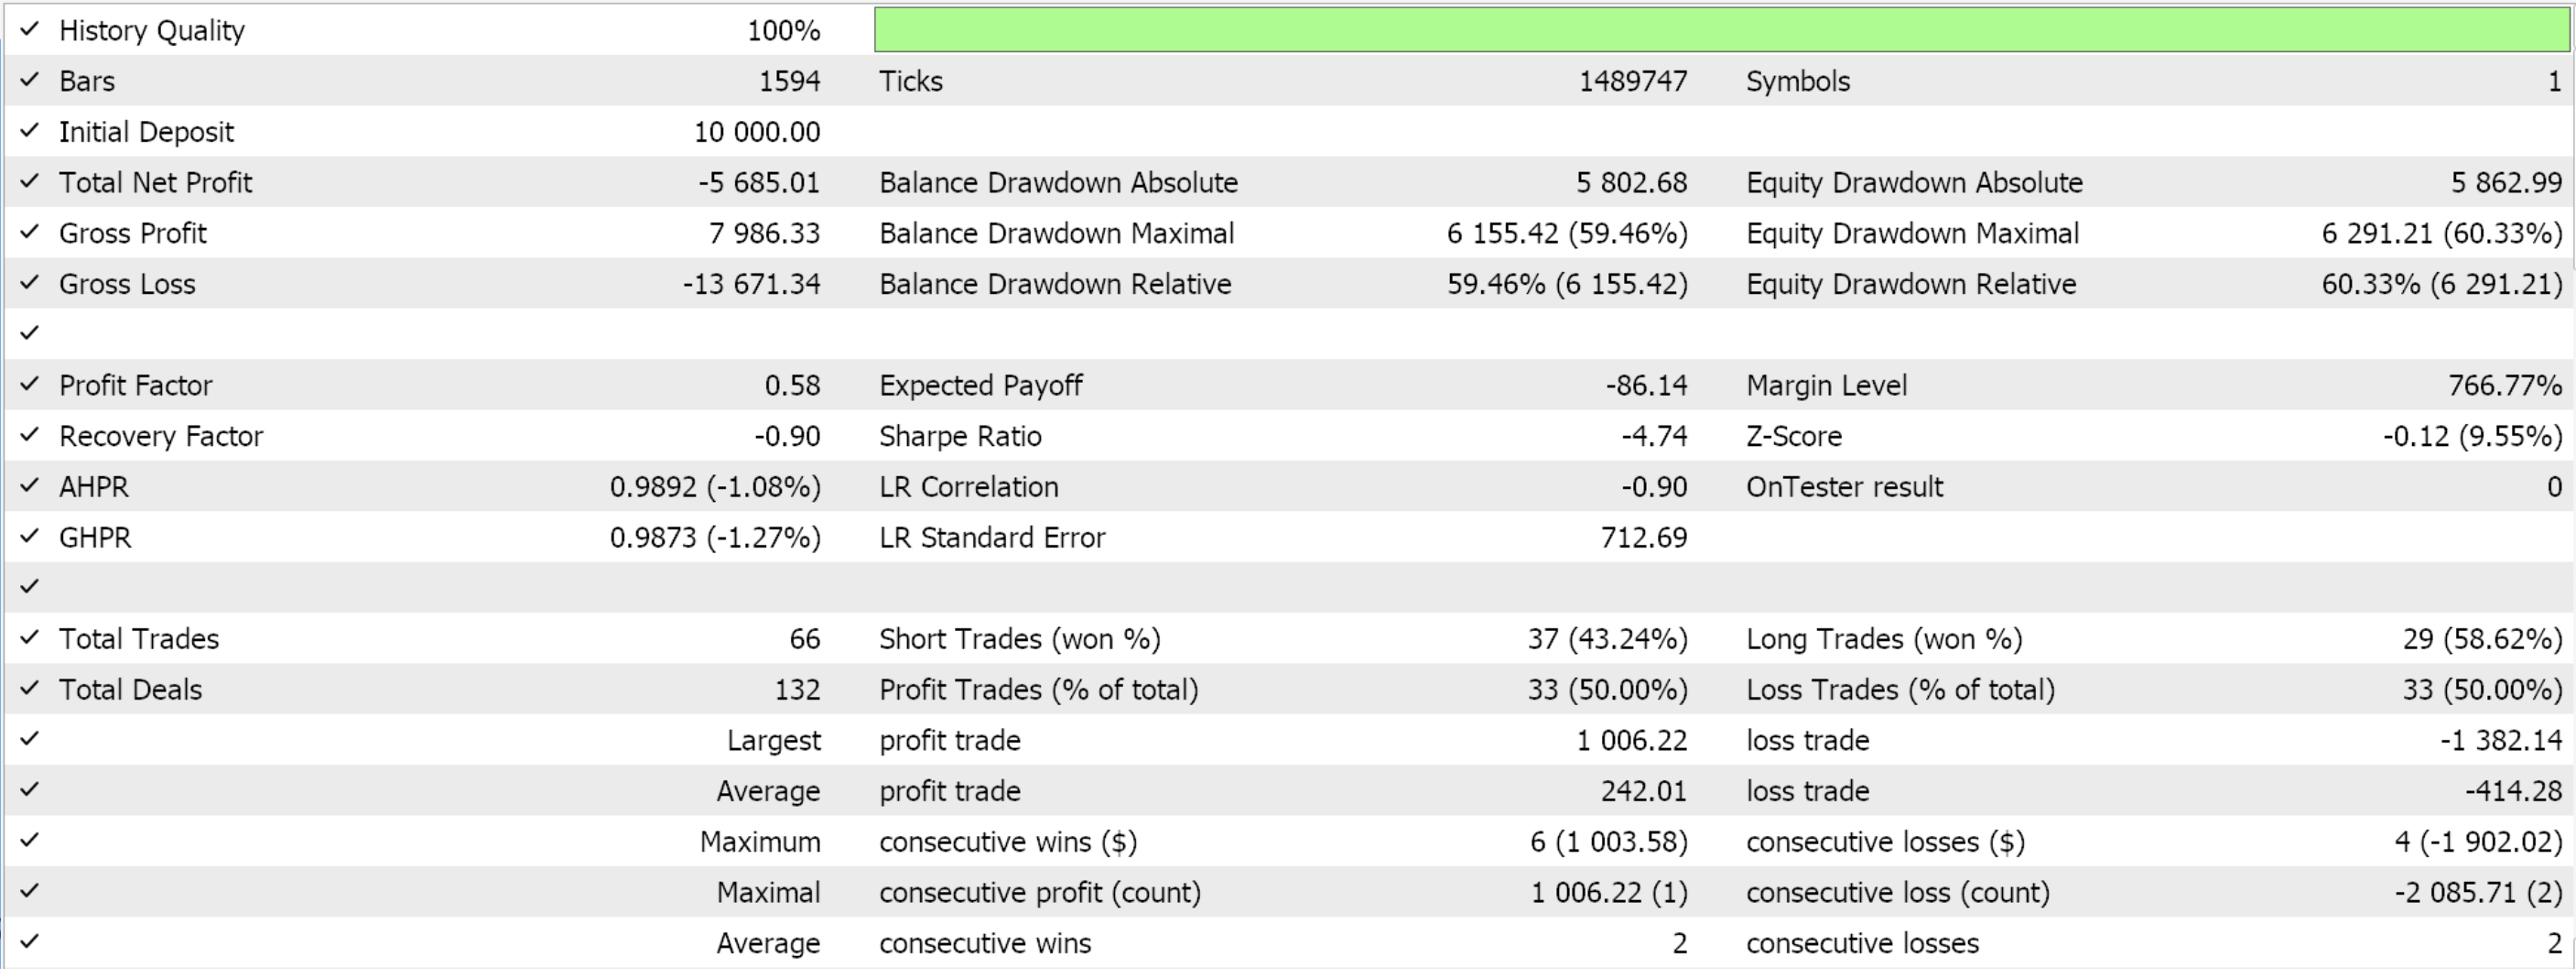
I had not been doing forward walks in these series, but since the test windows are very small, we are now including them as a standard. What will be missing will be the optimization runs over the training period because having both will make the article too crowded.
Fractal Failure Swing
Pattern-6 focuses on ‘failure’ of price action to breach fractal levels. For the bullish, after a bull fractal swing, if price attempts to break even lower and this attempt fails, i.e. the new low is rejected by a quick reversal to the upside, then this often indicates that sellers are exhausted and buyers need to step in.
Conversely for the bearish, when a fractal high is formed and price attempts to move higher than this fractal, but fails, this “swing failure” is taken as indication that sellers are in charge and that price is likely headed to a downtrend. Implementation in MQL5 as follows:
//+------------------------------------------------------------------+
//| Check for Pattern 6.                                             |
//+------------------------------------------------------------------+
bool CSignalFractals::IsPattern_6(ENUM_POSITION_TYPE T)
{  if(T == POSITION_TYPE_BUY && FractalLow(X() + 2) != 0.0)
   {  if(Low(X() + 1) <= FractalLow(X() + 2) && Close(X()) >= High(X() + 2))
      {  return(true);
      }
   }
   else if(T == POSITION_TYPE_SELL && FractalHigh(X() + 2) != 0.0)
   {  if(High(X() + 1) >= FractalHigh(X() + 2) && Close(X()) <= Low(X() + 2))
      {  return(true);
      }
   }
   return(false);
}
This is one of our most straightforward patterns as far as coding is concerned. As argued above, we are simply comparing prior low prices to the fractal low before it and then the close price to the high price 2 bars before it on the bullish. We follow the inverse of this on the bearish. Choice of how far to go back in history can be looked into by the reader.
A forward walk after optimizing, as was the case with patterns 0-5 for open and close thresholds of this pattern presents us with the following report:
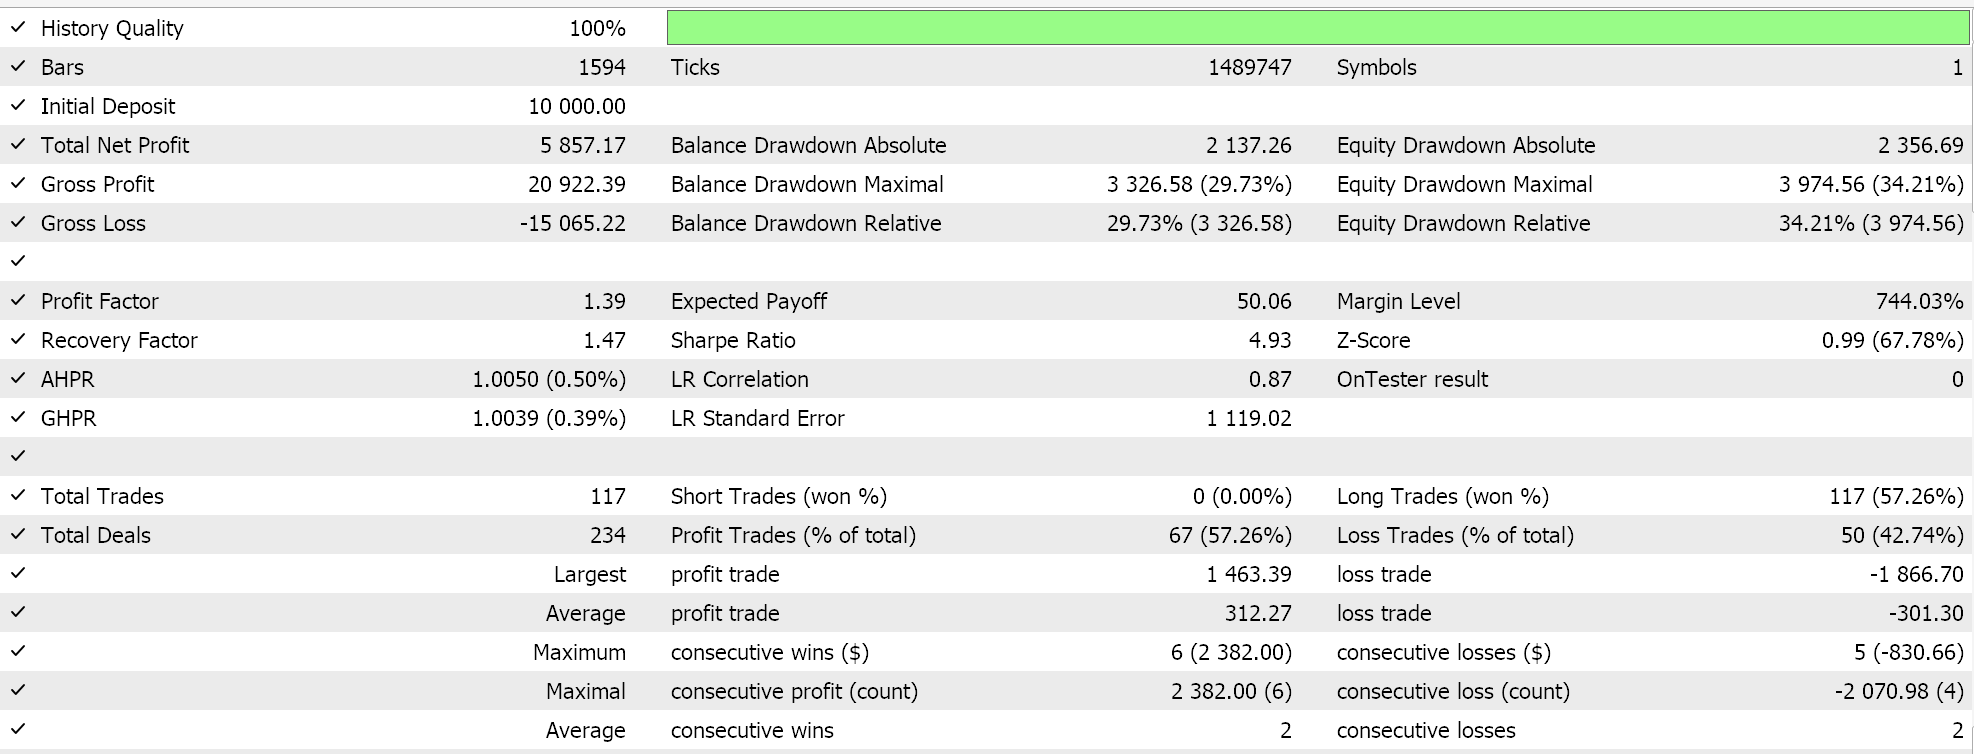
A fractal high (or low) that is not exceeded by subsequent candles often serves as a rejection. It is a strong signal of trend exhaustion.
Fractal Cluster Around Moving Averages
Our 8th pattern, Pattern-7, combines the fractal indicator with moving average. For the bullish setup, when a series of fractal-lows cluster near a moving average, (e.g. 50-MA) this is taken as an indication that the moving average is acting as a strong support level. These fractal lows therefore tend to provide entry opportunities for buyers and once the price decisively moves above the closest resistance level or even the moving average itself, this confirms the bullish thesis.
Likewise, a bearish formation is when multiple high fractals huddle around the moving average, which would be serving as a resistance at that time. The recurring rejection of price at these levels and a decisive move below support or the MA, would confirm a bearish bias. Implementation of this in MQL5 is as follows:
//+------------------------------------------------------------------+
//| Check for Pattern 7.                                             |
//+------------------------------------------------------------------+
bool CSignalFractals::IsPattern_7(ENUM_POSITION_TYPE T)
{  CArrayDouble _buffer;
   if(T == POSITION_TYPE_BUY)
   {  for(int i = 1; i < m_periods; i++)
      {  if(FractalLow(X() + i) != 0.0)
         {  _buffer.Add(fabs(FractalLow(X() + i) - MA(X() + i)));
         }
      }
      if(_buffer[_buffer.Maximum(0, _buffer.Total())] <= fabs(Close(X() + 1) - Close(X() + m_periods)) && Close(X() + 1) <= MA(X() + 1) && Close(X()) > MA(X()))
      {  return(true);
      }
   }
   else if(T == POSITION_TYPE_SELL)
   {  for(int i = 1; i < m_periods; i++)
      {  if(FractalHigh(X() + i) != 0.0)
         {  _buffer.Add(fabs(FractalHigh(X() + i) - MA(X() + i)));
         }
      }
      if(_buffer[_buffer.Maximum(0, _buffer.Total())] <= fabs(Close(X() + 1) - Close(X() + m_periods)) && Close(X() + 1) >= MA(X() + 1) && Close(X()) < MA(X()))
      {  return(true);
      }
   }
   return(false);
}
Pattern 7 like pattern 2 and pattern 3 also uses the array class but this time to log the magnitude of the gap between the fractal point and the moving average. As argued above we are looking for situations where this gap is as small as possible and that's why we take its maximum value from all the gap points that go in the buffer. We are again comparing this magnitude to prevalent trend, so the reader is reminded to make adjustments to this as already mentioned above with other patterns such as pattern 6.
Forward walking with input settings from optimizing the same symbol used in patterns above gives us the following report:
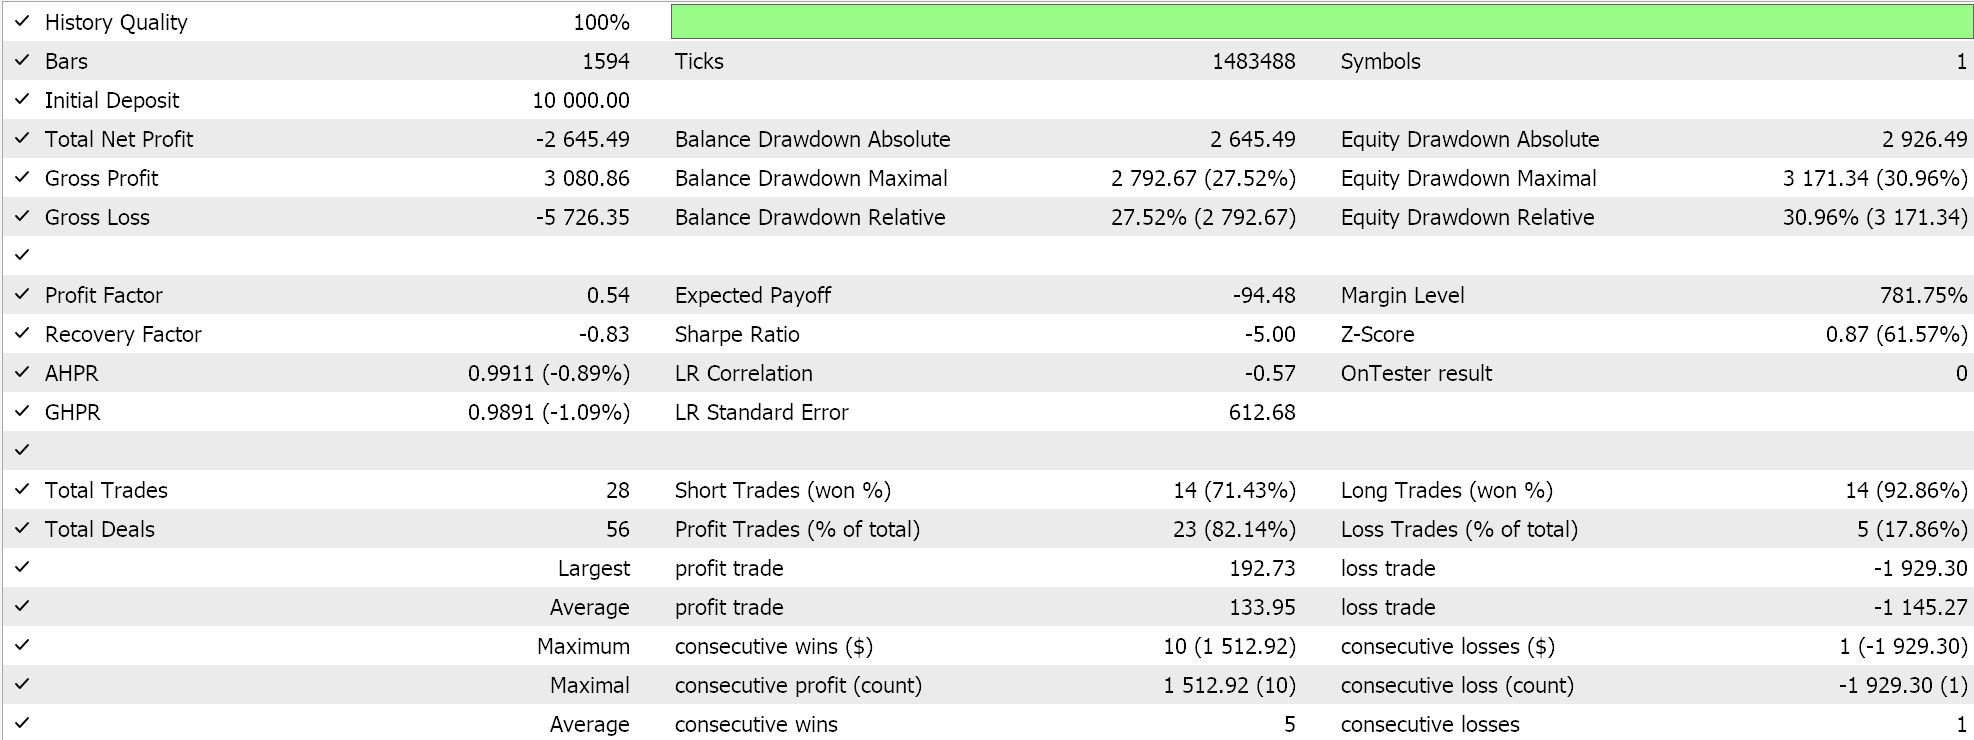
When many fractals firm near a moving average, it does suggest a pivot zone with a breakout from the cluster confirming a continuation or reversal.
Fractal-Gap Pattern
For pattern-8, the bullish signal is when a bullish fractal low is located near a price gap (usually in high-volatility or news-driven price action). In this situation, the gap acts as a support area. The presence of a fractal at the gap is then interpreted as buyers viewing this area as an opportunity. Once the gap is “filled” or held, an upward move is likely.
The bearish formation is also when a bearish fractal high appears near or at the location of a price gap that has opened on the upside. In this scenario, the gap would represent a level of resistance. The presence of the fractal would indicate sellers are defending the level and should price begin a downtrend then the bearish trend will be locked in. We implement this in MQL5 as follows:
//+------------------------------------------------------------------+
//| Check for Pattern 8.                                             |
//+------------------------------------------------------------------+
bool CSignalFractals::IsPattern_8(ENUM_POSITION_TYPE T)
{  if(T == POSITION_TYPE_BUY && FractalLow(X() + 2) != 0.0)
   {  if(Low(X() + 1) > High(X() + 2) && Close(X()) >= High(X() + 2))
      {  return(true);
      }
   }
   else if(T == POSITION_TYPE_SELL && FractalHigh(X() + 2) != 0.0)
   {  if(High(X() + 1) < Low(X() + 2) && Close(X()) <= Low(X() + 2))
      {  return(true);
      }
   }
   return(false);
}
For pattern-8 we are simply interested in a price gap and so our implementation above is almost as straightforward as pattern 6.
And a forward walk with similar symbol and test environment settings as we have had above of USD JPY 4-hour timeframe in the year 2023 is given below:
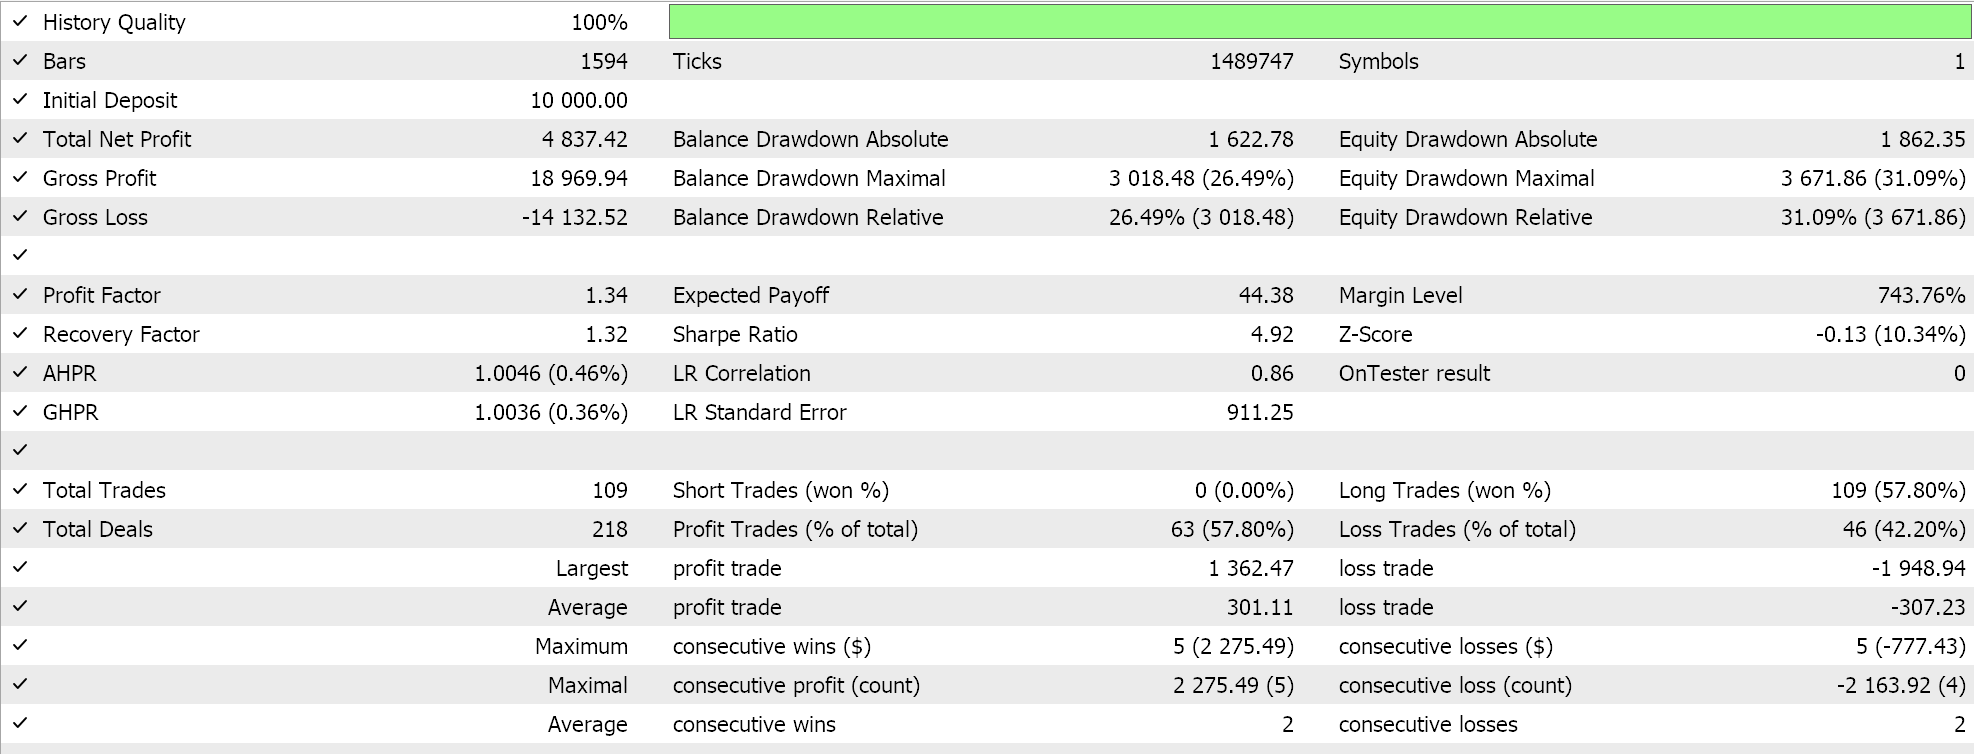
The coincidence of price gaps and fractal breakouts always amplifies price movement. These setups, though, are more common in news-driven events.
Fractal Alignment with Fibonacci Levels
Our final pattern combines the fractal with Fibonacci Levels. A bullish alignment occurs when a low fractal coincides with a key Fibonacci retracement level. This confluence between fractal identified support and the Fibo level does enhance the strength of the support area. This dual confirmation therefore serves as a robust bullish Signal– if price should hold at this level. Usually, it could be a signal to a bounce or trend continuation.
In a bearish formation, the high fractal aligns with a critical Fibonacci retracement level. This alignment then reinforces resistance at that point. If price then struggles to break above the Fibonacci zone and instead reverses downward from this confluence zone, this confirms a bearish signal. Both setups are coded as follows in MQL5:
//+------------------------------------------------------------------+
//| Check for Pattern 9.                                             |
//+------------------------------------------------------------------+
bool CSignalFractals::IsPattern_9(ENUM_POSITION_TYPE T)
{  if(T == POSITION_TYPE_BUY && FractalLow(X()) != 0.0)
   {  if(Is_Fibo_Level(X()))
      {  return(true);
      }
   }
   else if(T == POSITION_TYPE_SELL && FractalHigh(X()) != 0.0)
   {  if(Is_Fibo_Level(X()))
      {  return(true);
      }
   }
   return(false);
}
The code to our final pattern was a bit tricky to conceive, since what is always apparent and obvious in manual trading is hardly the case when it comes to automating. How would we “plot” and mark Fibonacci levels? We devise a rudimentary function to help us with this that we've called “Is_Fibo_Level()”. Its code is given below:
bool Is_Fibo_Level(int ind)
{  double _r=0.0;
   vector _h,_l;
   int _size = 3 * PeriodSeconds(PERIOD_MN1) / PeriodSeconds(m_period);
   _h.Init(_size);
   _l.Init(_size);
   if(_h.CopyRates(m_symbol.Name(),m_period,2,0,_size) && _l.CopyRates(m_symbol.Name(),m_period,4,0,_size))
   {  _r = _h.Max()-_l.Min();
      if(_l.Min()-ATR(ind) <= Close(ind) && Close(ind) <= _l.Min()+ATR(ind))
      {  return(true);
      }
      else if(_l.Min()+(0.236*_r)-ATR(ind) <= Close(ind) && Close(ind) <= _l.Min()+(0.236*_r)+ATR(ind))
      {  return(true);
      }
      else if(_l.Min()+(0.382*_r)-ATR(ind) <= Close(ind) && Close(ind) <= _l.Min()+(0.382*_r)+ATR(ind))
      {  return(true);
      }
      else if(_l.Min()+(0.5*_r)-ATR(ind) <= Close(ind) && Close(ind) <= _l.Min()+(0.5*_r)+ATR(ind))
      {  return(true);
      }
      else if(_l.Min()+(0.618*_r)-ATR(ind) <= Close(ind) && Close(ind) <= _l.Min()+(0.618*_r)+ATR(ind))
      {  return(true);
      }
      else if(_h.Max()-ATR(ind) <= Close(ind) && Close(ind) <= _h.Max()+ATR(ind))
      {  return(true);
      }
   }
   return(false);
}
This function simply samples prices over the past 3 months, an arbitrary period that obviously does not capture key price levels as one would if they were in a manual setup. They always say the proof of the pudding is in the eating, so perhaps dwelling too much on how we see things manually may not necessarily translate in trade performance, which is why we develop this into pattern-9 where we simply look for a coincidence between fractal points and levels of this function. The ATR is also used in a very rudimentary manner to set how wide our levels are, so in the event that the 3-month window witnesses low-Volatility, a lot of overlaps are bound to happen. This then could be a starting point for the interested reader when making modifications.
A forward walk as we have done with the other five patterns gives us this report:
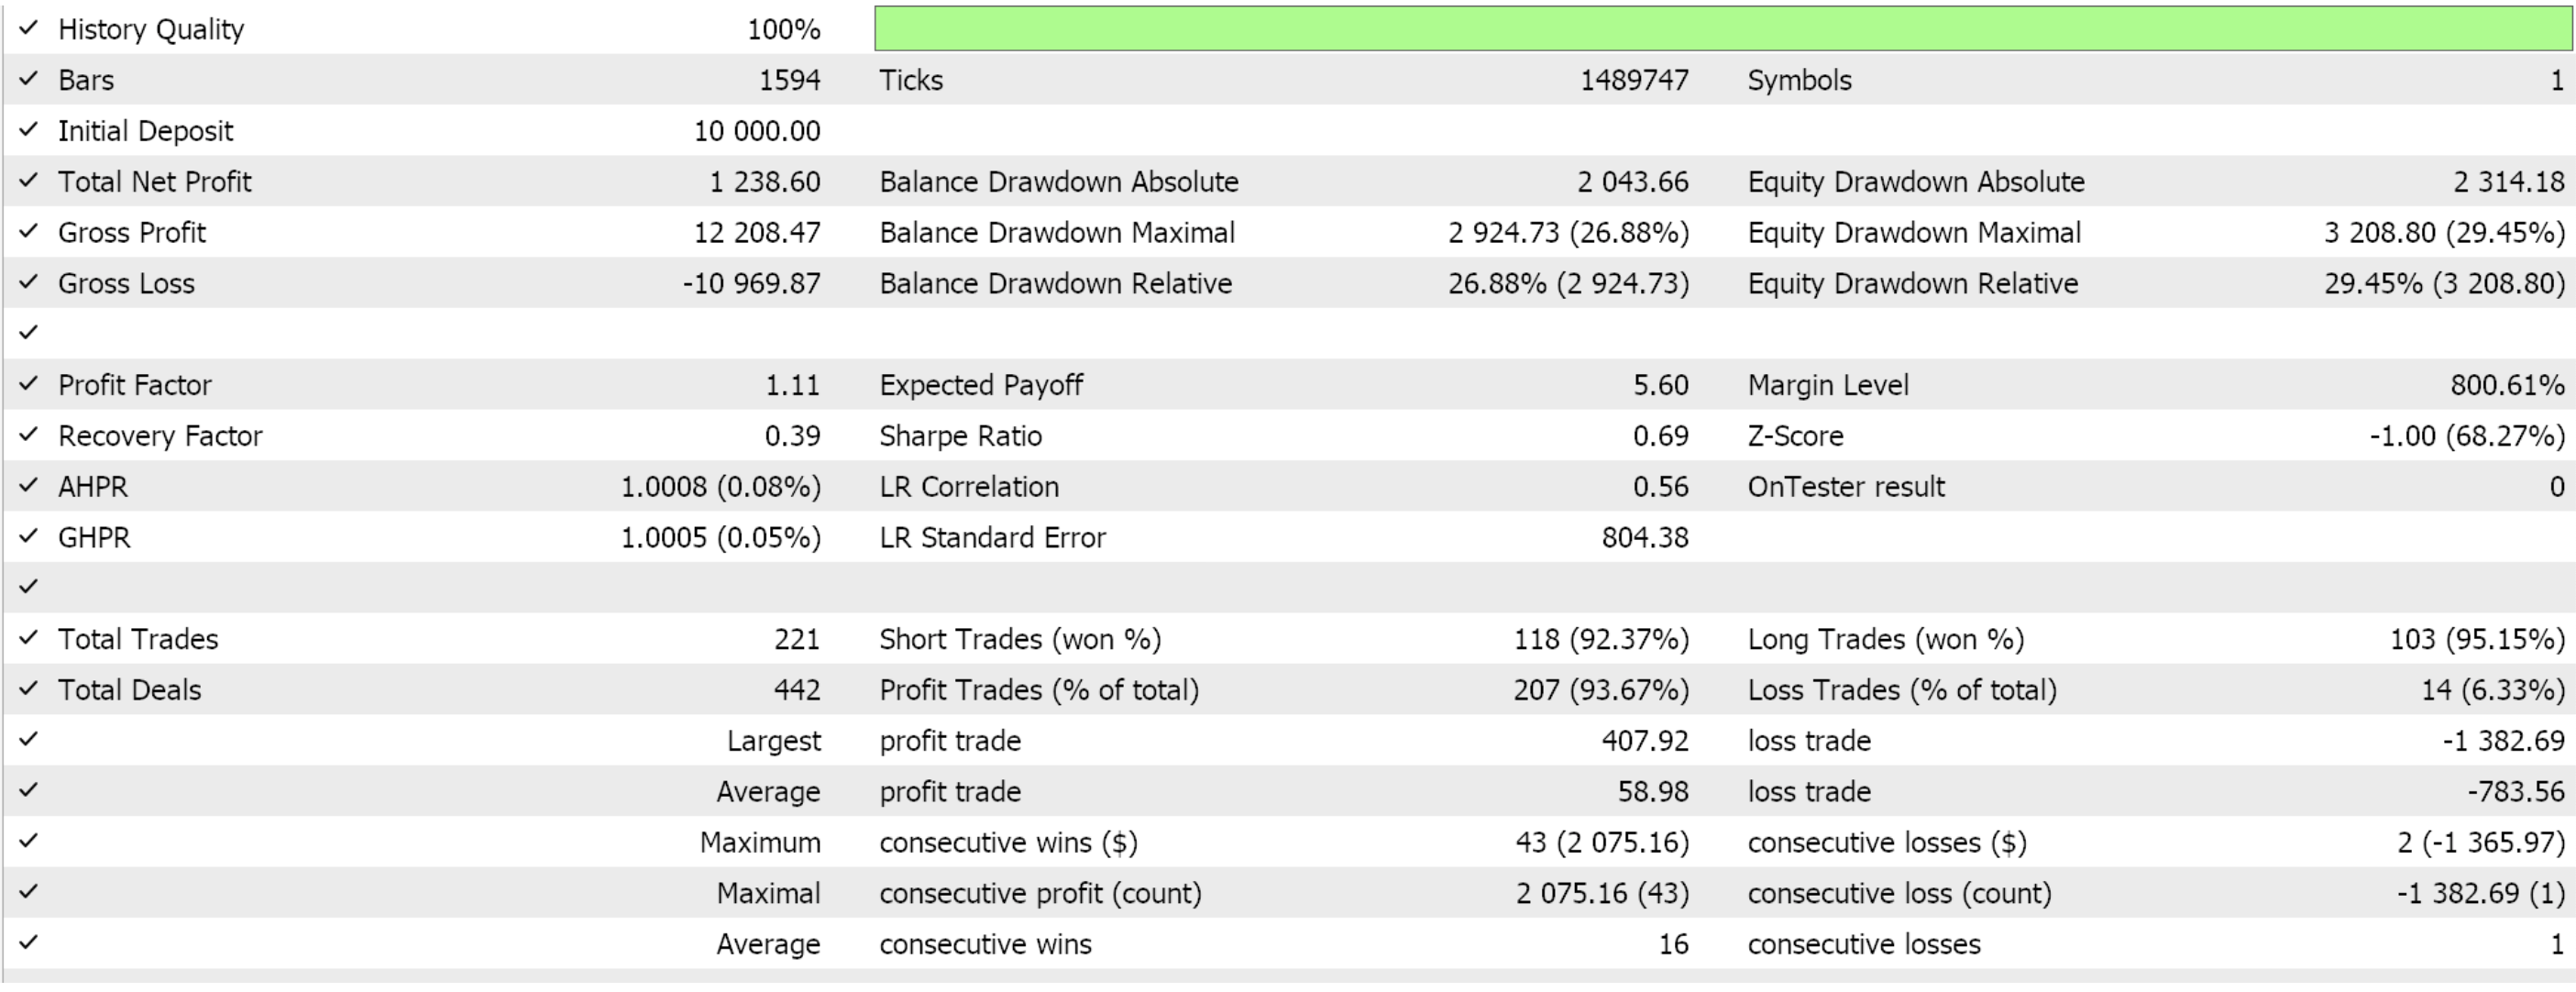
This pattern therefore serves a confirmation of key reversal zones. In these series whenever we have looked at patterns we have also considered the option of using not just a pattern as has been the case so far on all the 10 patterns above, but also using all patterns together.
Combining the Patterns
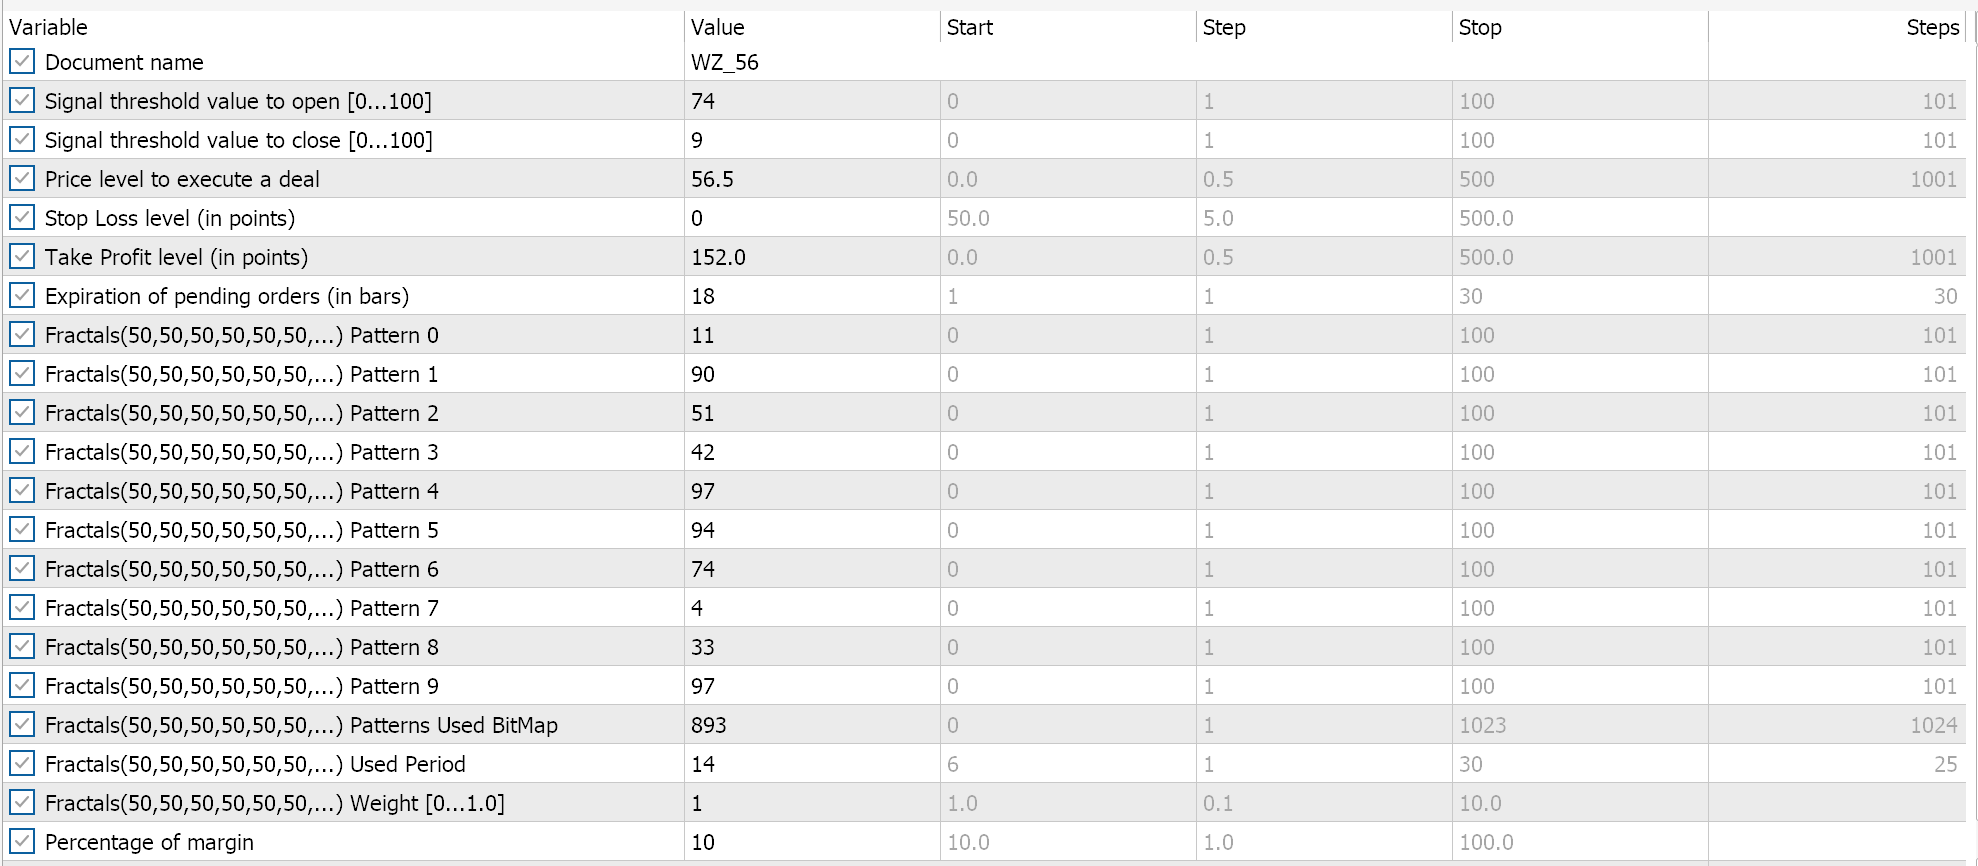
The attached code for all our 10 patterns is in the form of a custom signal class. We use this class in an MQL5 Wizard to assemble Expert Advisors. There are guides here and here on how to do this. The individual-pattern optimizations and test runs we have conducted above were based on assigning the input parameter maps-used a special index that bears the form 2 to the power of the pattern index. So with pattern 5 this was 2^5 which comes to 32, for 7 it was 128, and so on. When trading with multiple patterns, though, this input serves as a map rather than a pointer to a specific pattern. We have 10 patterns, so the maximum value of our parameter for maps-used is 2^10 which is 1024 minus one (since we start counting from zero).
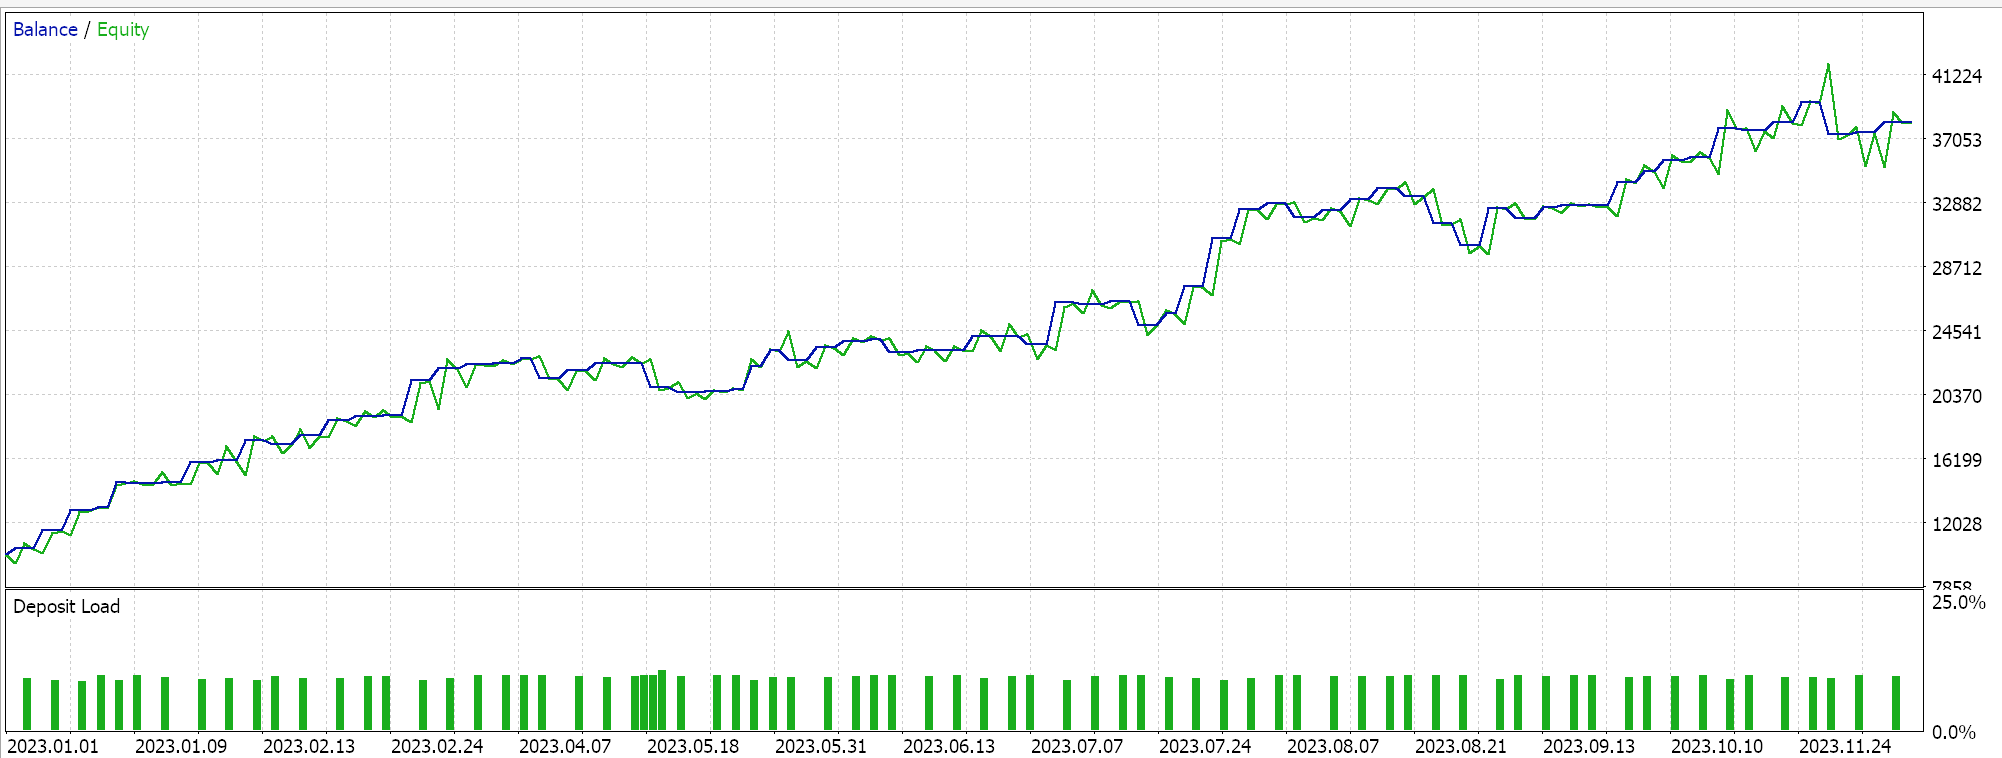
If we optimize for the best combination of patterns on standard opening and closing thresholds, our best input settings are as follows:
A test run on the training data gives us the following report:
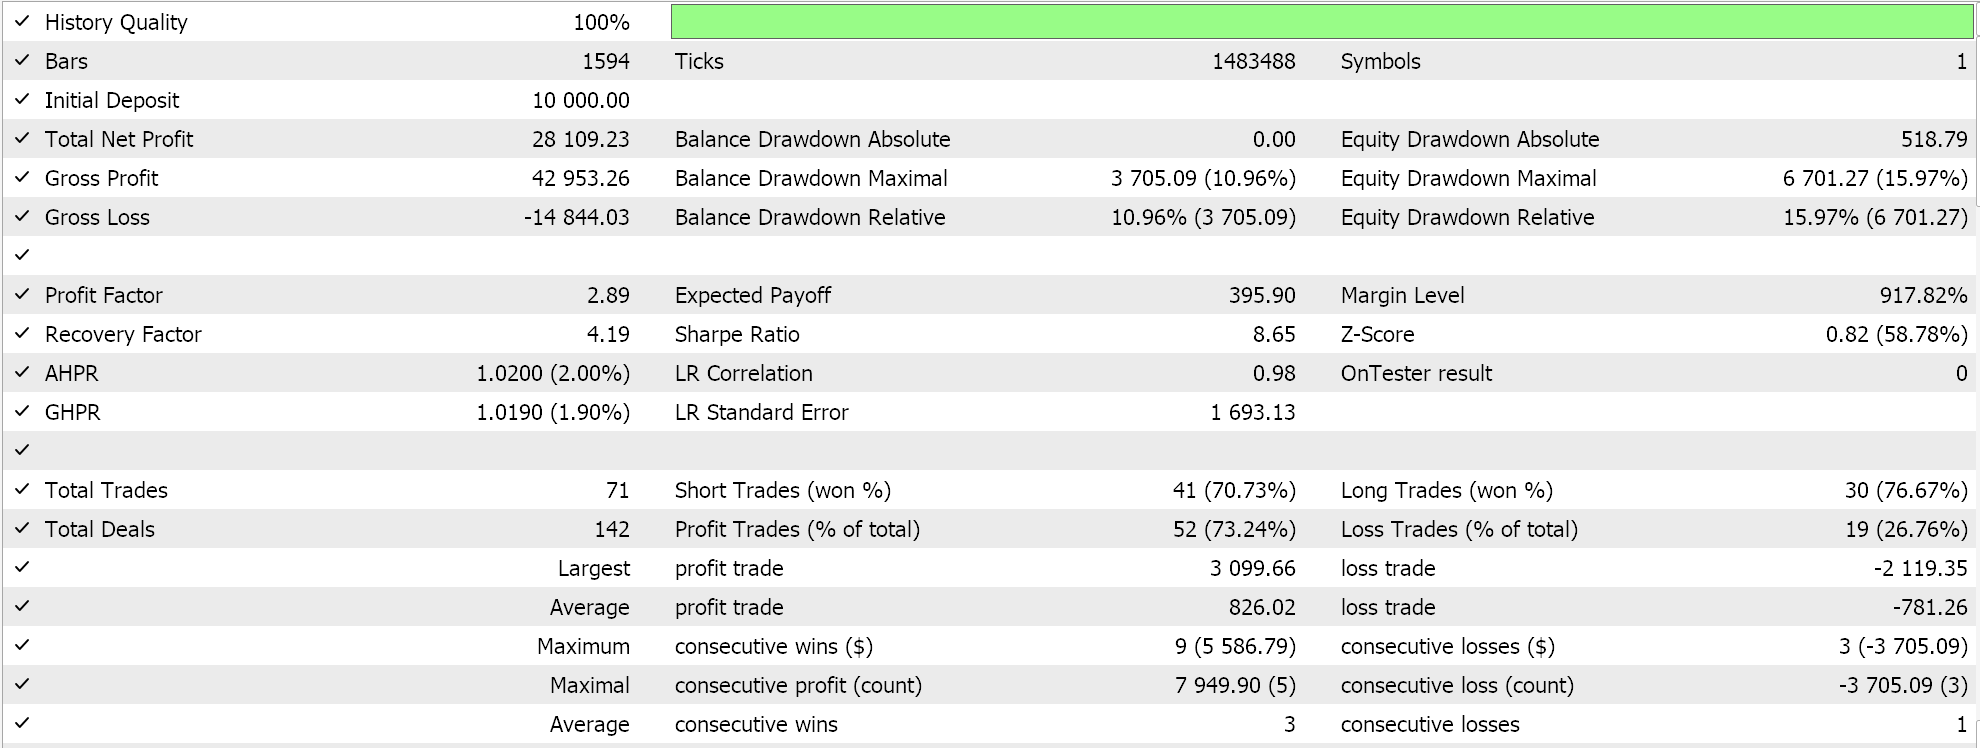
And a forward walk, to the subsequent year 2024, gives us the following results:
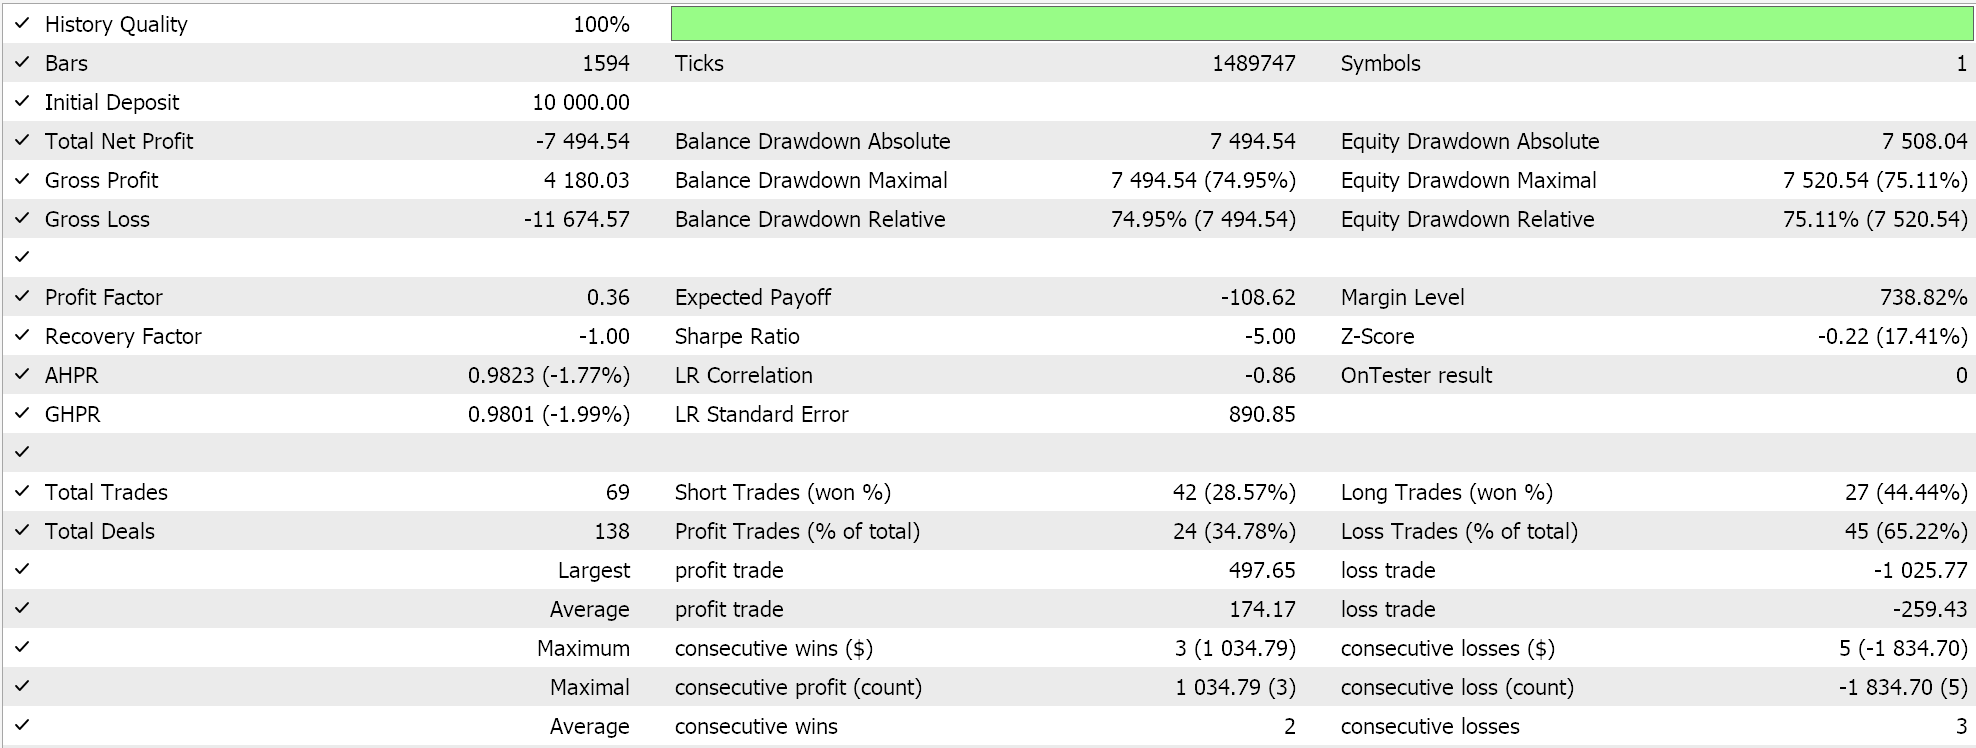
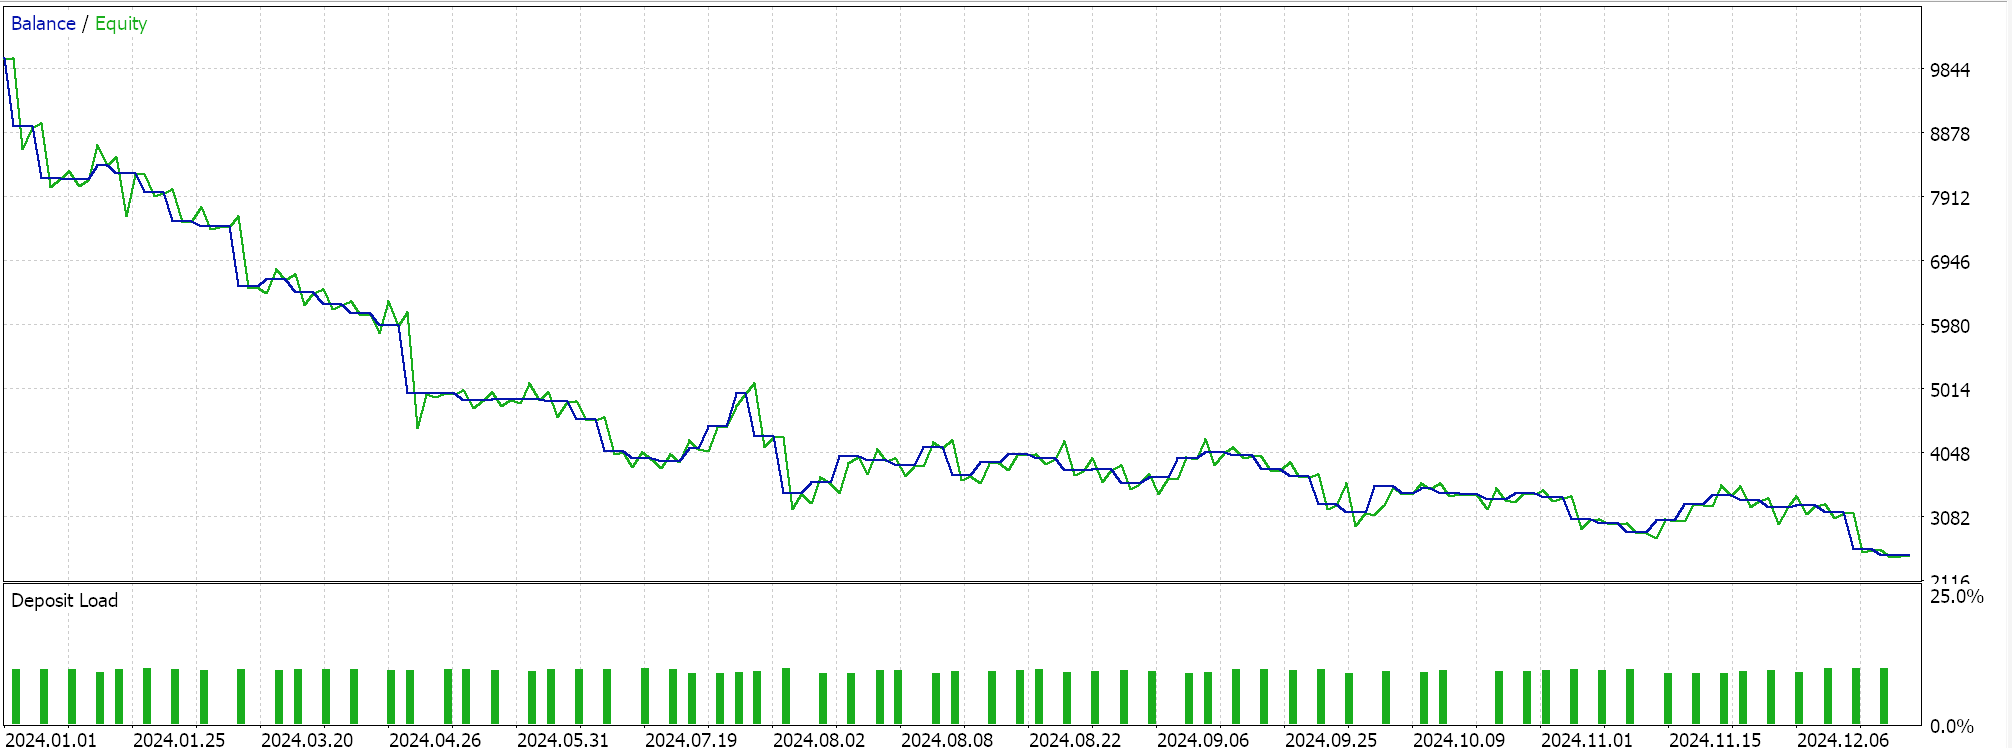
These results I think speak to what has been emphasized in previous articles, which is combination of patterns requires expert knowledge on the part of the trader. He needs to be very specific in combining patterns. He should not be seeking answers from optimization runs. We have individual patterns above that were able to walk forward. This was off of 1 year testing so longer test periods are certainly warranted and as always past performance does not indicate future results. However, this speaks to the importance in taking a focused approach when selecting patterns for a sign al as opposed to aver aging out.
Importance of Timeframes
Fractal Interpretation is highly subjective to the time frame being used. Higher time frames H4, Daily, and Weekly provide stronger and more reliable signals since they tend to filter out a lot of market noise. Fractals on these time frames often mark key support and resistance levels that institutions and long-term term traders do pay attention to. The signals generated form very slowly and this can be frustrating for many traders, but when they are formed, they are often high confidence setups.
On the flip side, lower time frames of M15, M20, M30 appear more frequently but can be less reliable due to short-term price fluctuations. They are best suited for scalping strategies where quick reaction is better rewarded. However, as a rule, they are more prone to false breakouts and require additional filters to improve accuracy.
There are also midrange time frames H1, H2, and these on paper should provide a compromise between the two. The reader is invited to explore the veracity of this; however, best practice indicates they work well when combined with fractals in higher time frames.
Conclusion
Fractals tend to be stalwarts in markets with high liquidity and strong institutional interest. Low-volume price spikes are bound to create false fractals that quickly get invalidated, which is why Volume analysis or footprint charts can be used to add confidence to fractal-based decisions.
With that said, we have considered 10 separate patterns of this very “pivotal” indicator and while it has major drawbacks on Smaller timeframes, when used patiently at the larger time frame it could yield interesting results as we have been able to walk forward from 1yrs testing on some of the patterns.
| File | Description |
|---|---|
| SignalWZ_56.mqh | Signal Class File |
| WZ_56.mq5 | Expert file showcasing included files |
 Cycles and Forex
 Introduction to MQL5 (Part 13): A Beginner's Guide to Building Custom Indicators (II)
 Multiple Symbol Analysis With Python And MQL5 (Part 3): Triangular Exchange Rates
 Artificial Algae Algorithm (AAA)
- Free trading apps
- Over 8,000 signals for copying
- Economic news for exploring financial markets
You agree to website policy and terms of use