Price Driven CGI Model: Theoretical Foundation

- Introduction
- Mathematical Aspect
- What do we need?
- Exporting price data from MetaTrader 5.
- Normalizing price data exported from MetaTrader 5
- Visualizing the idea.
- Significance of the Price Man project.
- Conclusion
Introduction
Studying various MQL5 community articles has sparked my creativity in using MQL5 for algorithmic trading systems. Combining MQL5 with Python, C++, and Java enables innovative financial solutions. This project involves creating a price-driven CGI character, visualizing market emotions like optimism and fear through CGI object size changes.
Behavioral Finance examines how psychological factors impact market behaviors. Key concepts include Prospect Theory, which notes investors' tendency to feel losses more intensely than gains. The project integrates MQL5 with Python and creative software for CGI animation, utilizing open-source programs to keep it simple and engaging. We will explore the potential of MetaTrader 5 price data, aiming to inspire data scientists and algorithmic traders.
Below is an animated CGI character, created with Inkscape and animated in Blender 3D, whose size changes in response to market data-driven algorithms.

Mathematical Aspect
Before delving deep in the topic, I have considered formulating the mathematical functions that guide us through the project. This will aid us with a calculated reference even when we start writing our algorithm. The factors that change in our project are the size of our sim object and price. Price change is the effector of the object size.
To relate price changes to the size of a CGI object, we use mathematical functions that map price movements to object scale.
Let's define variables useful for the project:
- Price Change (Δ𝑃): Change in asset price over time.
- Initial Size (𝑆0): Starting size of the CGI object.
- New Size (𝑆𝑡): Size of the CGI object at time 𝑡.
- Scaling Factor (𝛼): Controls sensitivity of size to price changes.
There are two possible mathematical relationships to lay for the project. These are linear relationship and exponential relationship. Each of these has got its advantages and suitable application.
- Linear relationship is simple and direct, suitable for small or moderate price changes.
- Exponential relationship captures significant changes more dramatically, thus suitable for complexity.
![]()
Exponential relationship:

By substituting the given values into the formula, we can calculate the size of the object whenever price changes.
What do we need?
At this stage where we are conceptualizing the idea, it is important to be familiar with tools that will make the project possible. I have listed the tools that are essentials for this project and description:
| Software Tool | Description |
|---|---|
| MetaTrader 5 | Powerful platform for trading, and obtaining price data, and it also comes with the Strategy Tester and a professional Meta Editor for writing programs required in this project. |
| Notepad++(Optional) | Another optional code editor for writing program of different syntax, it is open source, you can choose a different editor that suits from the internet. |
| Blender 3D (Optional, but recommended) | For 3D modelling, Animation and Simulation. Advantage it contains Blender Python which can handle pythons scripts that we shall use to drive our Price Man character. |
| Inkscape (Optional) | Powerful 2D Vector Image editor. Open-source software. |
Exporting price data from MetaTrader 5
It is possible to export data from MetaTrader 5 manually by pressing key combination Ctrl + U at the same time on Windows to bring the symbols list. Select the desired symbol from specification and highlight it, then go to bars tabs set the timeframe and the dates which you want data from and click the request button on the same window. Data of price will be listed from start to end according to the settings made. Below the window is an option for exporting data, and the format will be CSV. The data sheet can be read using Google Docs or an Excel software. Below is an image showing the process done on Volatility 75(1s) Index by Deriv.com website.

The data exported need further manipulation to make it suit our desired usage, for example we only need OPEN and CLOSE price to be used for keyframing the growth of our object. The method above has got limited customization to the data being exported. We only managed to set the timeframe and dates for the data, while everything else remained default. Some parts of the data are not necessary in our project, in the next segment will delve into setting up Pandas for normalizing the data file we exported using python.
Normalizing the Price data exported from Mt5
The problem presented above by manually exporting data can be addressed by developing a specialized script for the job. This script must be capable to focus on required data and represent it hastily when being used in other software programs. Scripts can be customized to include specific parameters and settings tailored to your needs, such as time frames, symbols, and data formats. Scripts can be designed to adapt to different data sets or conditions dynamically, providing more flexibility to the exported data. At this segment, we want to create a Python script for manipulating the exported CSV price data file and saving it in a specific location in the computer.
Make sure you install python in your computer as a priority because the processes below requires it installed. It is free to download from python.org website.
Installing Pandas:
Pandas, is a powerful open-source data analysis and manipulation library for Python. It provides easy-to-use data structures and data analysis tools that are essential for working with structured data, such as CSV files, Excel spreadsheets, databases, and more. I am using a Windows computer, but I will explain how to set up on other platforms.
We use Python's package manager, pip, to automatically install libraries, provided the computer is on a network with internet access.
- On Windows, using command prompt or powershell, run the command below.
pip install pandas
- On macOS, run the same command in the Terminal.
- Using Linux (Ubuntu\Debian) the command works is executed in its Terminal.
Python script for data manipulation:
Now, let's look at the program script for modifying our data. The program reads a CSV file exported from MetaTrader 5, which contains tab-separated columns. It identifies and normalizes the 'Open' and 'Close' prices found in columns '<OPEN>' and '<CLOSE>', respectively. After normalization, it saves these normalized prices to a new CSV file, making the data more suitable for further analysis, visualization, or integration into other applications in this case we are going to use Blender for 3D visualization tasks.
The mathematical formula governing the program is:

If both '<OPEN>' and '<CLOSE>' columns are found, the program proceeds to normalize these prices. Normalization involves finding the minimum (min_price) and maximum (max_price) values of both 'Open' and 'Close' prices across the entire dataset. Scaling the 'Open' and 'Close' prices to a normalized range between 0 and 1 using the above formula. This normalization step ensures that the prices are adjusted to a consistent scale, which can be useful for various analytical or visualization purposes.
After normalization, the program creates a new DataFrame (df[['Open_norm', 'Close_norm']]) containing only the normalized 'Open' and 'Close' prices. It then saves this normalized data to a new CSV file (normalized_data.csv) in the specified directory (r"C:\Users\path to where you want to save the file"\"). Finally, the program prints a message confirming where the normalized data CSV file has been saved (f"Normalized data saved to {output_csv_file_path}").
I have put together the code here, and you can refer to the summary and formula above to:
import pandas as pd

# Path to the CSV file exported from MetaTrader 5. Note that you can customize the paths to match your end
csv_file_path = r"C:\Users\path to the storage location of your CSV file\Volatility 75 (1s) Index_M1_202407050000_202407060000.csv"

# Read the CSV file into a DataFrame with tab delimiter
df = pd.read_csv(csv_file_path, delimiter='\t')

# Print the column names to debug
print("Column names in CSV:", df.columns)

# Check if 'OPEN' and 'CLOSE' columns exist
if '<OPEN>' in df.columns and '<CLOSE>' in df.columns:
    # Normalize the Open and Close prices
    min_price = min(df['<OPEN>'].min(), df['<CLOSE>'].min())
    max_price = max(df['<OPEN>'].max(), df['<CLOSE>'].max())

    df['Open_norm'] = (df['<OPEN>'] - min_price) / (max_price - min_price)
    df['Close_norm'] = (df['<CLOSE>'] - min_price) / (max_price - min_price)

    # Save the normalized data to a new CSV file
    output_csv_file_path = r"C:\Users\paths to where the normalized file will be saved\normalized_data.csv"
    df[['Open_norm', 'Close_norm']].to_csv(output_csv_file_path, index=False)

    print(f"Normalized data saved to {output_csv_file_path}")
else:
    print("'OPEN' and/or 'CLOSE' columns not found in CSV file. Available columns are:", df.columns)
To run the program, open the command prompt on Windows and make the sure it is open to the storage location where the script is saved. Run the command below.
python ModifyPriceData.py
Normalized Data:
Let's look at the presentation of data normalization as view in Excel.
Before Normalization:

After Normalizing:
The processed output file presented differently with fewer specified details according to the script we created.

Visualizing the idea:
I started by creating my character Price Man in Inkscape. I decided to use simple shape geometry, which makes it easy for calculations at the current stage of the project.

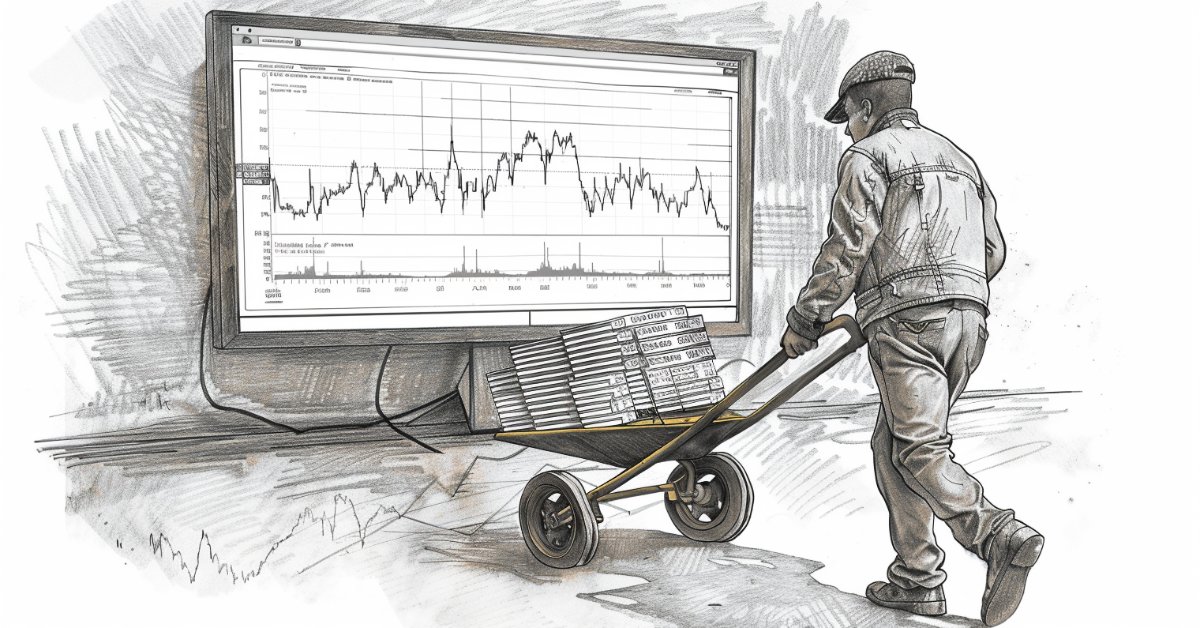
The future of MetaTrader 5 can have a panel with the character responding to price change in real time, as demonstrated in the imaginary image below.

Significance of the Price Man project
By linking market price changes to the size of CGI objects, we can create a visual representation of market emotions. This approach helps bridge the gap between abstract financial data and human behavior, making market movements more accessible and engaging for various audiences. I have outline practical applications of a successful development below and designated institutions:
- Educational Tools: Visualize market movements to teach financial concepts.
- Investor Tools: Help investors quickly gauge market sentiment.
- Entertainment and Media: Use visualizations in news programs or social media to engage audiences.
- Art and Creativity: Create dynamic digital art that evolves with market changes.
Conclusion
It is possible to develop data manipulation algorithm tools. Price data can be optimized for use in other projects that respond to price changes. Replay systems can be modeled to re-analyze past market behavior, which is useful for institutions studying financial markets. With the algorithm mentioned earlier, we were able to edit and perform mathematical calculations on over a thousand values, a task that is difficult to do manually. The same algorithm can be adapted for more complex price data performance based on the specific projects you are pursuing.
We will continue refining the Price Man concept and utilize collaborative software to bring the project to fruition. Our goal is to integrate the Price Man character panel into the MetaTrader 5 platform, making it responsive to real-time price fluctuations. This sets the stage for the next phase of development beyond our current progress. I have attached the files listed in the table below if you are keen to got through them to see how it works.
In the next article, we will utilize the Blender Python library to animate simulations for the Price Man CGI character using the normalized data. Familiarity with the software programs used is essential, along with the skill of exporting from one software and importing into another. Feel free to share additional ideas and contributions in the comments below.
| Attachment | Description |
|---|---|
| Volatility 75 (1s) Index_M1_202407050000_202407060000.csv | Price data file exported from MetaTrader 5. |
| Normalized_data.csv | The file with data intended for use in further exploration of the idea. |
| ModifyPriceData.py | Algorithm designed to normalize price data. |
| Price Man.png | The image file of our CGI model |
- Free trading apps
- Over 8,000 signals for copying
- Economic news for exploring financial markets
You agree to website policy and terms of use