
Example of new Indicator and Conditional LSTM
Introduction
In the dynamic world of financial markets, traders and analysts are always looking for new and creative ways to get an advantage over their competitors. This article examines a novel method of automated trading that blends deep learning's prediction skills with the strength of conventional technical analysis. We seek to develop a stable and flexible trading technique that can handle the intricacies of contemporary markets by fusing a complex Conditional Long Short-Term Memory (LSTM) neural network model with a proprietary technical indicator, the Volatility Adjusted Momentum (VAM).
Technical indicators have long been used by the financial industry to spot trends and possible trading opportunities. Despite their importance, these indicators frequently fall short of fully capturing the complexities of market dynamics, particularly during periods of extreme volatility or abrupt shift. However, deep learning architectures such as LSTMs, in particular, have demonstrated amazing potential in machine learning models for pattern recognition and prediction in complicated, time-dependent data. These models, however, don't always offer the interpretability and domain-specific knowledge that conventional technical analysis does.
Our strategy aims to close this gap by fusing the advantages of both approaches. This article presents a novel tool called the Volatility Adjusted Momentum (VAM) indicator, which attempts to measure market momentum while taking the underlying volatility into consideration. Compared to conventional momentum indicators, this offers a more detailed picture of market dynamics. VAM aims to deliver more dependable signals in a range of market scenarios, from calm to stormy, by accounting for volatility.
To enhance the VAM indicator, we utilize a Conditional LSTM model, which is a type of recurrent neural network that is tailored to process sequential data with extra contextual data. Because it is trained using historical price data and technical indicators, this model can identify intricate, non-linear market linkages that conventional analysis techniques could miss. Because of the 'conditional' feature of the LSTM, the model can take into account more market variables, which could result in forecasts that are more precise and context-aware.
The Expert Advisor (EA), a specially designed automatic trading system that combines the VAM indicator with forecasts from the Conditional LSTM model, is the brains behind our strategy. Using the signals from both components, this expert advisor (EA) is integrated into the well-known MetaTrader 5 platform to help traders make well-informed decisions. Additionally, it has dynamic risk management capabilities that modify take-profit and stop-loss levels in response to fluctuations in the market.
We will examine the theoretical underpinnings of the Conditional LSTM and VAM indicator models in this post, offering insights into their respective advantages and ways in which they work best together. We will go over each step of creating and putting into practice the EA, including setting up the data, training the model, and integrating it into the MetaTrader 5 environment. In addition, we will showcase the outcomes of comprehensive optimization and backtesting, contrasting the effectiveness of the VAM-only technique with the combined VAM and Conditional LSTM method.
We will talk about the difficulties and factors involved in fusing cutting-edge machine learning methods with conventional technical analysis as we investigate this novel trading strategy. We seek to offer a thorough overview of the practical elements of putting such a system into place, including everything from data quality and model interpretability to the computational demands of running complicated models in real-time trading situations.
Readers will have a thorough understanding of how cutting-edge machine learning techniques might be used to augment traditional technical analysis to potentially improve trade outcomes by the end of this essay. This investigation of VAM and Conditional LSTM in automated trading offers insightful information about the future of algorithmic trading, regardless of your background as a trader, data scientist, or researcher investigating the boundaries of quantitative finance.
Volatility Adjusted Momentum (VAM)
The core concept behind VAM is to account for market volatility when evaluating momentum. It calculates the difference between the current price and a past price (momentum) and then divides it by the product of volatility and the square root of the momentum period. This value, scaled by a factor, indicates the strength of the momentum adjusted for recent market volatility.
Deep Learning Model
The article utilizes a Conditional LSTM model, a type of recurrent neural network (RNN) suitable for financial time series data. This model takes historical price data and technical indicators (like MACD used here) as input and predicts future price movements. The advantage of Conditional LSTMs lies in their ability to capture complex relationships between various market factors.
The Expert Advisor (EA)
The creation of an EA that combines the predictions of the deep learning model with VAM is described in the article. Below is a summary of the main features:
- Initialization: The EA loads and configures the input and output parameters for the pre-trained ONNX deep learning model.
- Data Acquisition and Normalization: The EA collects MACD readings and previous price data. Prior to putting these variables into the deep learning model, it normalizes them.
- VAM Calculation: Using historical and current price data, the EA computes the VAM indicator.
- Trading Logic and Prediction: The EA pulls a price forecast from the deep learning model.
- The EA starts a buy trade if VAM is high and the prediction points to a price increase.
- In contrast, the EA opens a sell trade if VAM is low and the prediction shows a drop in price.
By dynamically determining stop-loss and take-profit levels based on Average True Range (ATR), the EA manages risk.
Results:
The article mentions backtesting results for the EA using the VAM with and without Conditional LSTM strategy.
Lets create a new indicator (VAM)
What if we create a new indicator, for example this one:
// Calcular Momentum
   double momentum = close_price - iClose(NULL, 0, momentum_period);

// Calcular Volatilidad
   double volatility = iMA(NULL, 0, volatility_period, 0, MODE_SMA, PRICE_CLOSE);

// Calcular VAM
   double vam =( momentum / (volatility * MathSqrt(momentum_period)))*10000;
We will use the Momentum and the Volatility, to create a new indicator, this indicator will be called VAM.
The momentum is divided by the product of the momentum period's square root and volatility.
For scaling purposes, the result is then multiplied by 10,000.
By accounting for volatility, the VAM indicator seeks to quantify momentum. It makes an attempt to equalize momentum across a range of market conditions by dividing momentum by volatility. The denominator's square root of the momentum period aids in standardizing the indicator throughout various time periods.
A positive VAM value indicates upward momentum, while a negative value indicates downward momentum. The magnitude of VAM represents the strength of the momentum, adjusted for recent market volatility.
This indicator can be used to identify potential trend reversals or to gauge the strength of current market trends while accounting for market volatility.
With only this Indicator, we can create an EA, and check if its profitable or not.
The strategy would be like this:
void OnTick()
  {
   int bars = iBars(NULL, 0);
   if(bars < MathMax(momentum_period, MathMax(volatility_period, (vam_period))))//, MathMax(ma_long_period, rsi_period)))))
      return;

   double close_price = iClose(NULL, 0, 0);

// Calcular Momentum
   double momentum = close_price - iClose(NULL, 0, momentum_period);

// Calcular Volatilidad
   double volatility = iMA(NULL, 0, volatility_period, 0, MODE_SMA, PRICE_CLOSE);

// Calcular VAM
   double vam =( momentum / (volatility * MathSqrt(momentum_period)))*10000;


   double atr = iATR(_Symbol,PERIOD_CURRENT,14)*_Point;
   double Bid = SymbolInfoDouble(_Symbol, SYMBOL_BID);
   double Ask = SymbolInfoDouble(_Symbol, SYMBOL_ASK);
   double slPriceBuy = NormalizeDouble(Bid - slmul*atr,_Digits);
   double tpPriceBuy = NormalizeDouble(Ask + tpmul*atr,_Digits);
   double slPriceSell = NormalizeDouble(Ask + slmul*atr,_Digits);
   double tpPriceSell = NormalizeDouble(Bid - tpmul*atr,_Digits);

// Señales
   if(vam > VAMTHRESH)// && ma_short > ma_long)// && rsi < 70 && ma_short > ma_long )
     {
      // Comprar
      trade.Buy(lot_size,_Symbol,   Ask, slPriceBuy, tpPriceBuy, " BUY EA ");
     }
   else
      if(vam < -VAMTHRESH)// && ma_short < ma_long)// rsi > 30 && ma_short < ma_long )
        {
         // Vender
         trade.Sell(lot_size,_Symbol,   Bid, slPriceSell, tpPriceSell, " SELL EA ");
        }
  }
The function iBars(NULL, 0) yields the total amount of bars that are accessible for the given symbol and timeframe.
bars int: The total number of bars, or the returned value, is stored in the bars variable.
MathMax: The maximum value of the supplied numbers is returned by this function. In his instance, nested is used to determine the maximum throughout multiple time periods.
The variables momentum_period, volatility_period, vam_period, ma_long_period, and rsi_period, which have been previously established, indicate the intervals of various indicators or computations.
If: The condition determines whether the total number of bars is fewer than the sum of the times allotted.
If the "if" condition is true (i.e., there are not enough bars), the function stops immediately, and the rest of the code is not executed.
VAM Results
Results are like this (after quick optimization, didn't finish it):


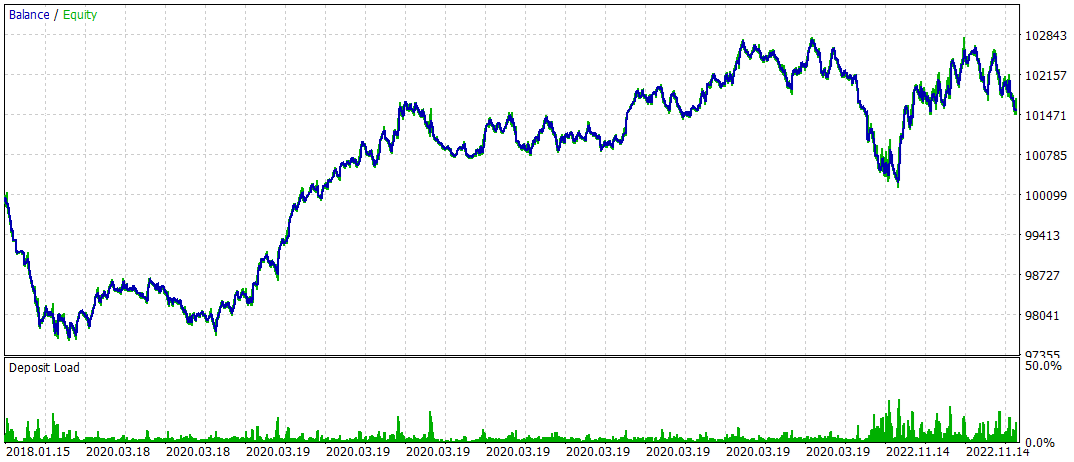
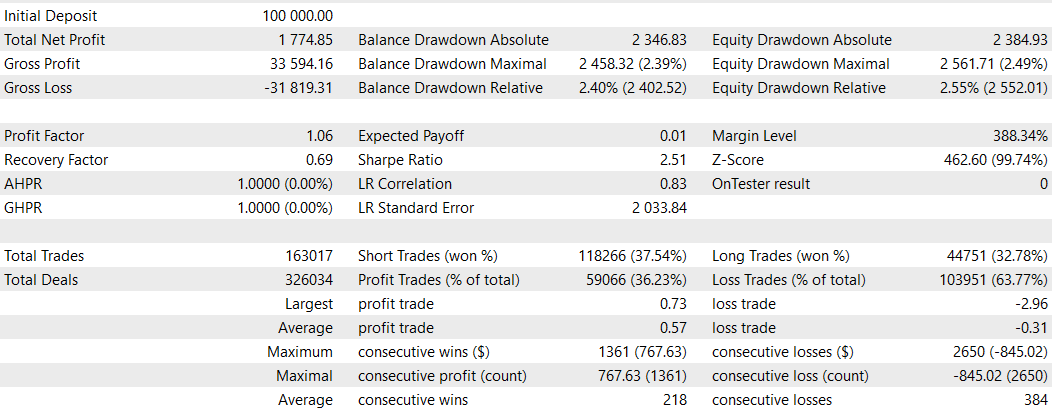
This seems good, for a simple strategy and a simple indicator.
Lets see what could we achieve if we used a Deep Learning model for this (but today we are going to use something different), we are going to make a deep learning model with some indicators, to see which fits better.
Deep Learning Models
We will export this model in ONNX but first we will compare which is better.
To do all this, we will use Google Colab (so we don't consume our PCs resources) with its Python script that is attached.
As this is a mql5 web, I will not explain the python code.
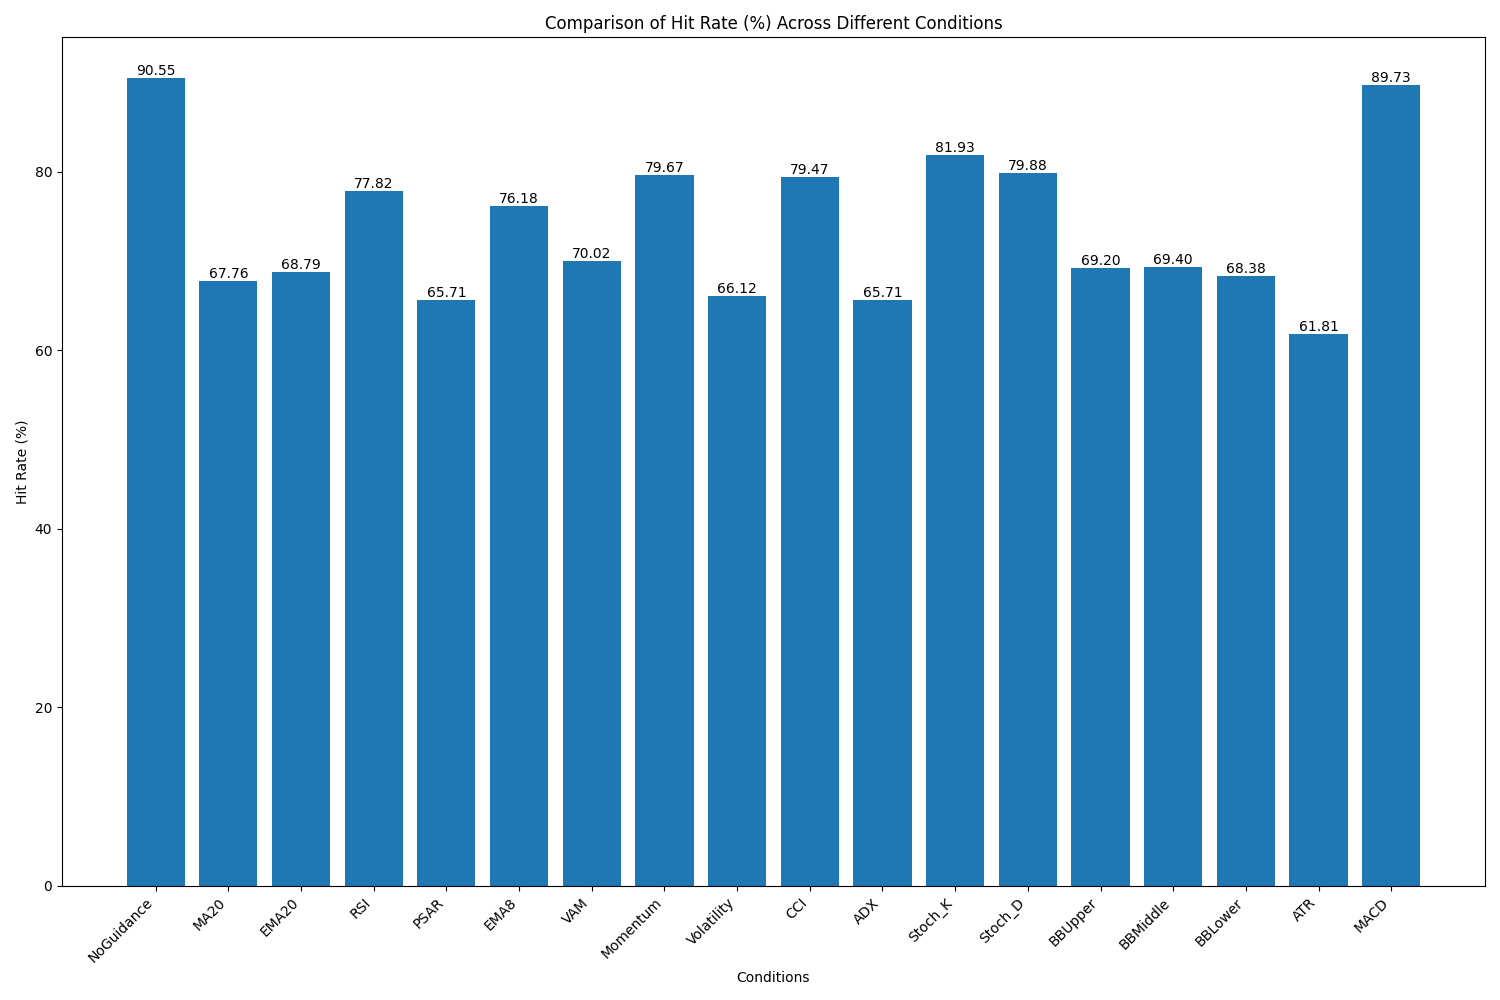
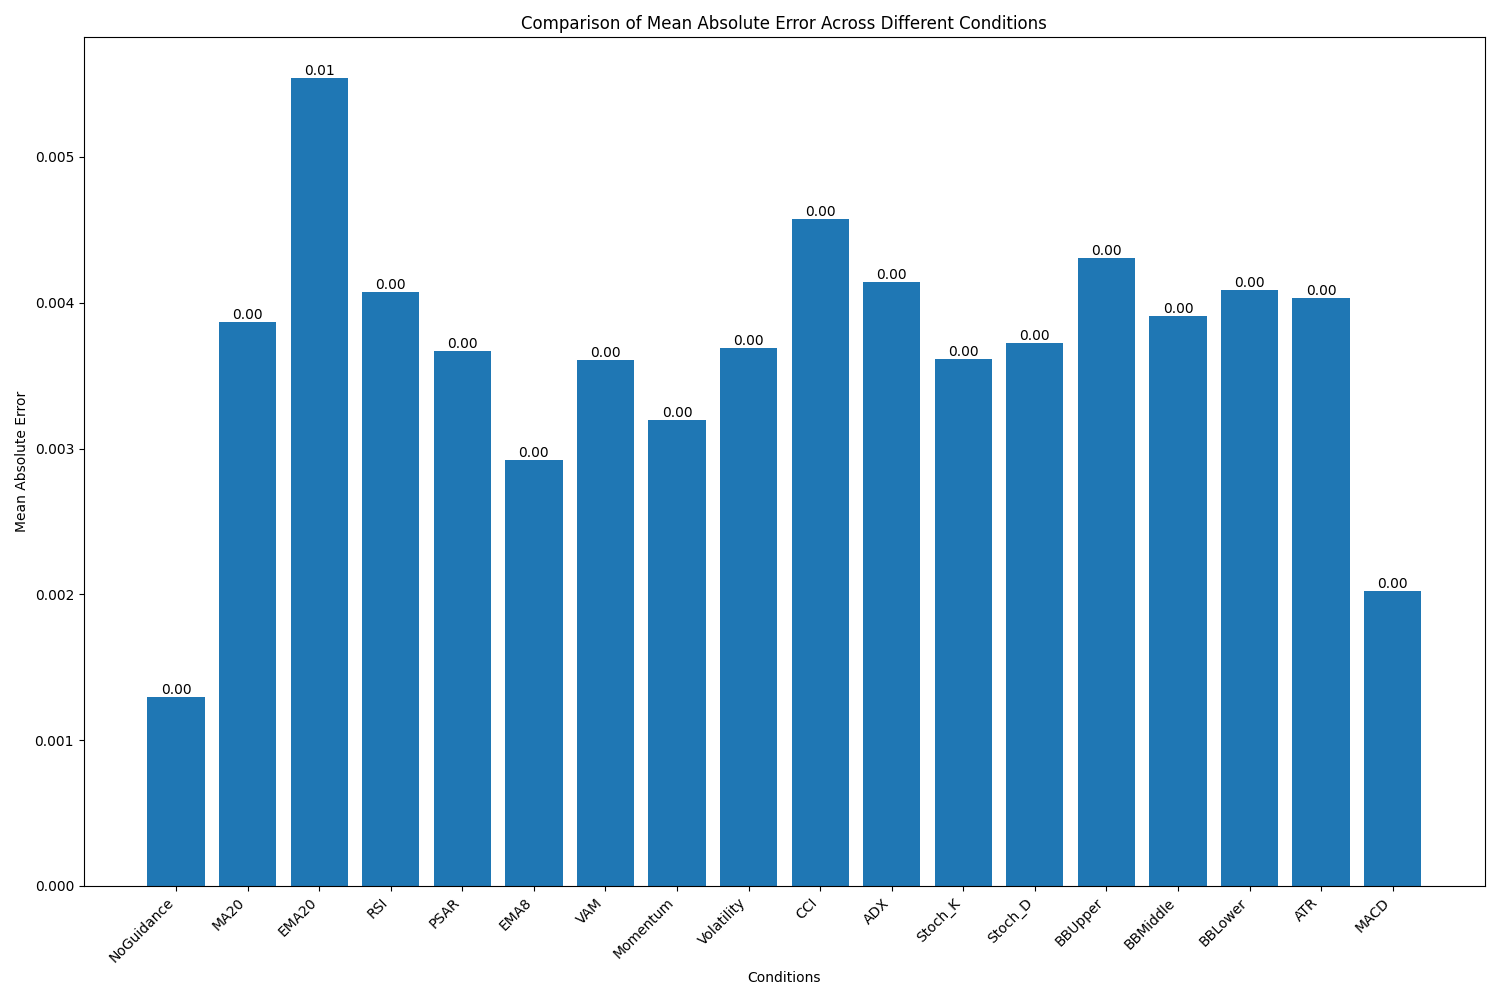
There is two py scripts, the first one is a py script with all indicators used, and the second one is the same script, but with only MACD indicator (because in the first script we supposed MACD has a good hit rate and R2, with low errors.
Graphic results from the first script are this:
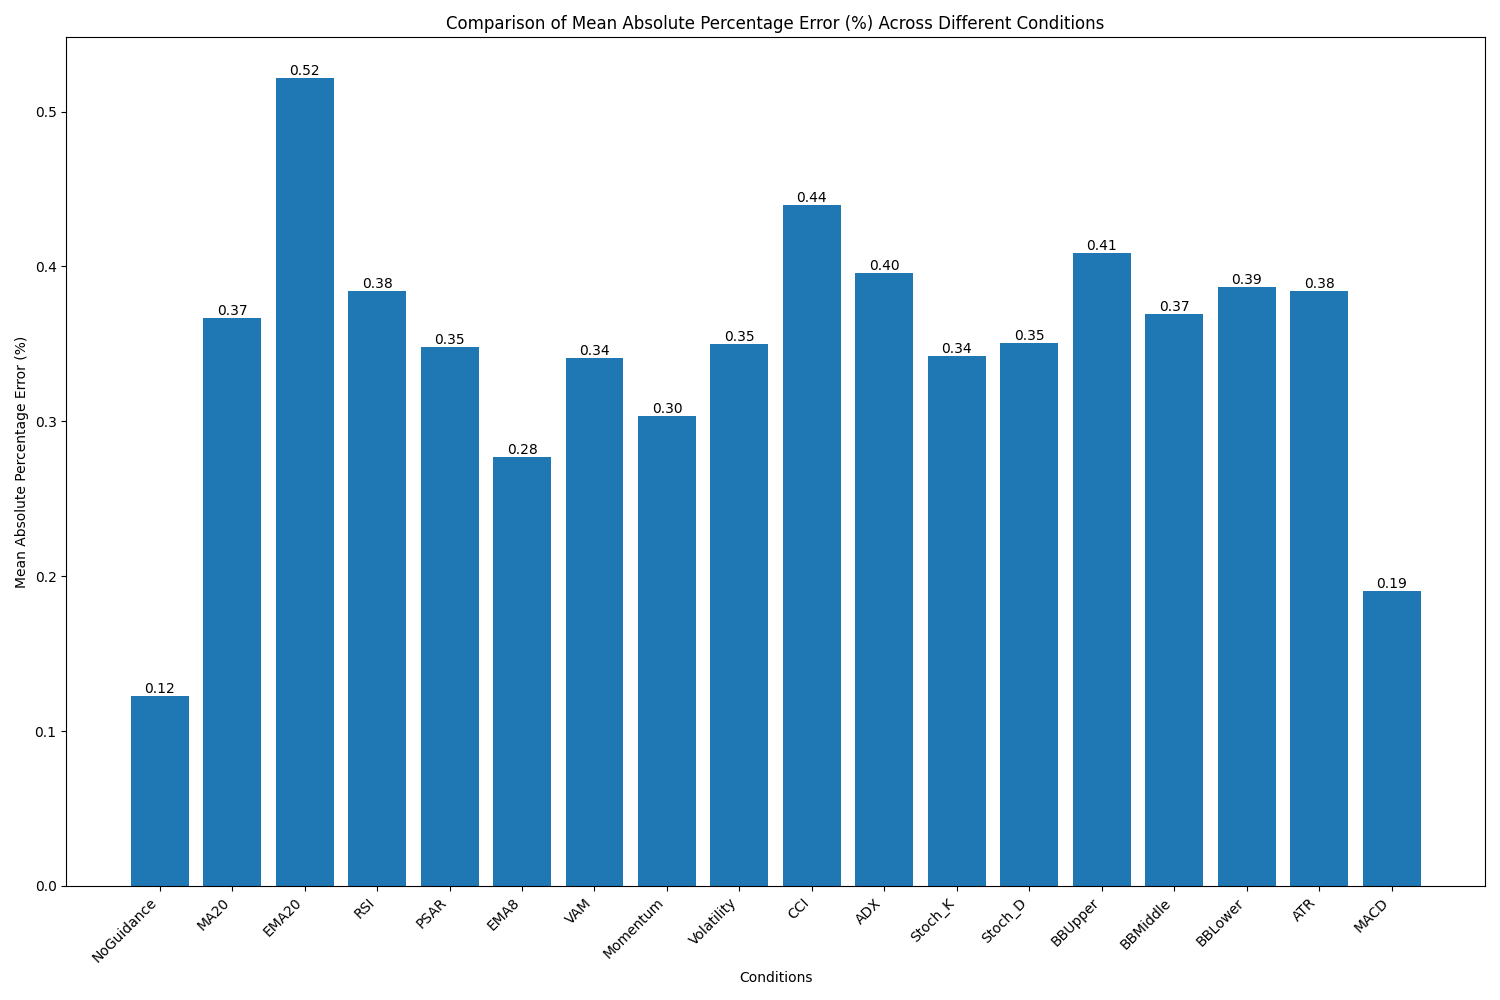
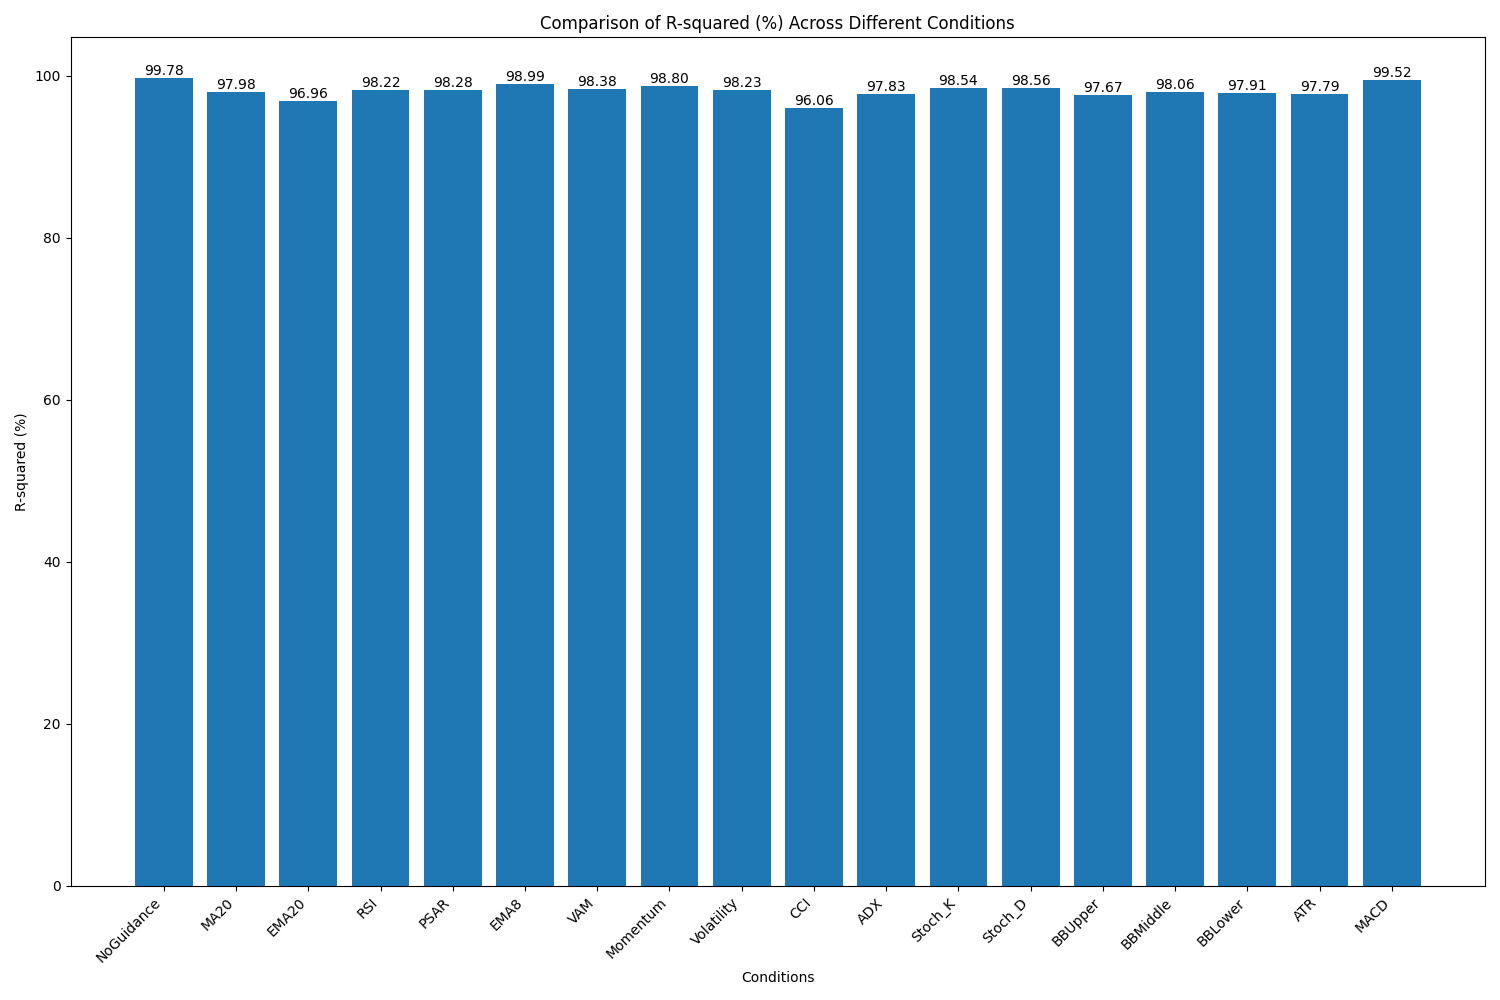
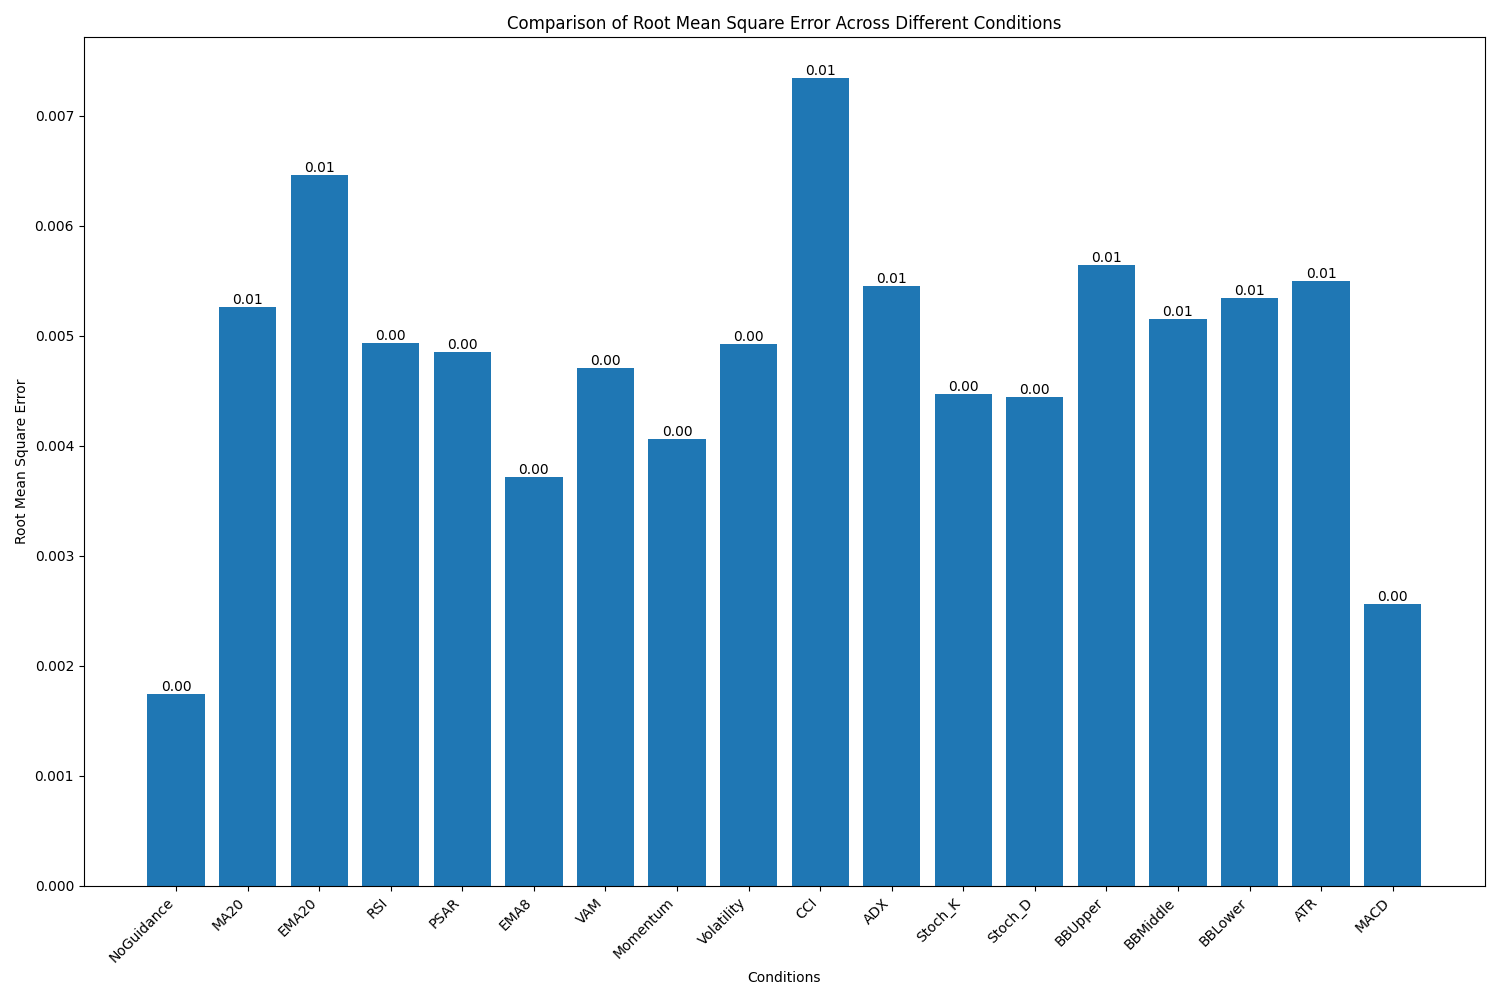
Once we decided to use MACD, we prepared the script and fit the dates for the first of January 2024 (so we can backtest the results in mql5 from 1/1/2024 onwards).
Results of the second script where this (very simmilar).
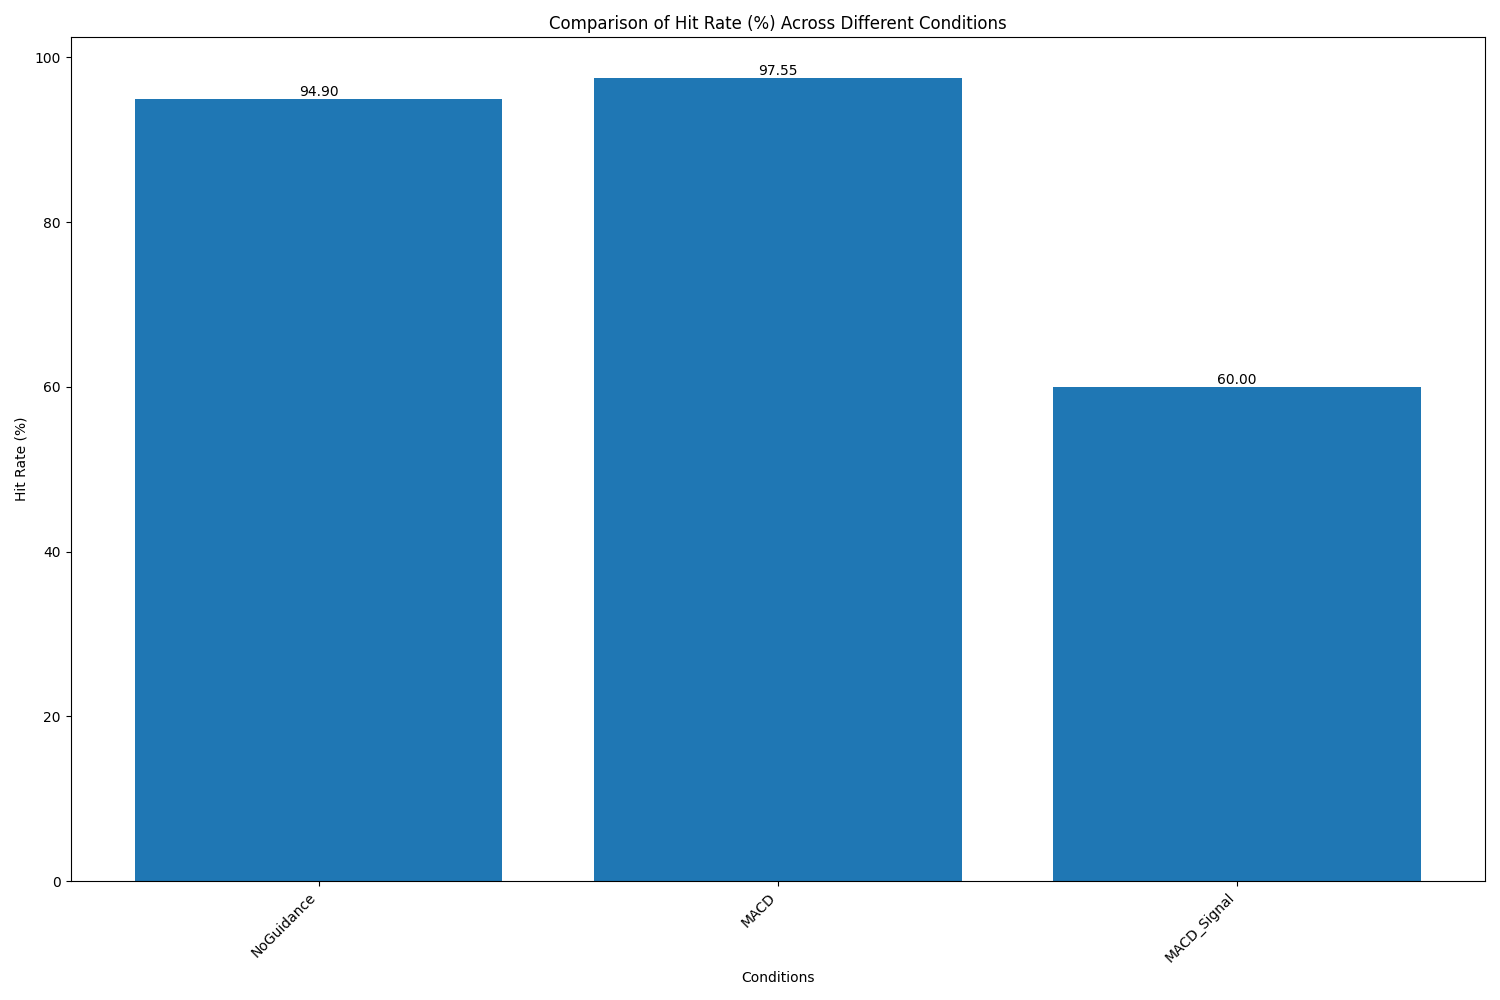
etc ... (you can make it yourself and check results with colab).
The python script is for Colab, you must first run the first cell, and when all the libraries are installed, run the second cell, accept it to save de models and graphs in your Drive, and just wait till its done.
Data is obtained out of mlq5, because MetaTrader is not installed in Colab (values should be similar).
As you can see in the second group of images, MACD model has a really good Hit rate, this is why we chose it.
Conditional LSTM
An enhanced version of the conventional Long Short-Term Memory neural network is called Conditional LSTM. By adding more contextual data or situations to the LSTM architecture's predictive process, it improves it. Because so many factors can affect price changes in the financial markets, it is especially interesting for financial market prediction.An effective instrument in the field of stock or forex prediction is a conditional logistic regression machine. It enables the model to take into account a variety of market indicators and outside variables in addition to past price data. This could include sentiment data, more general economic indicators, and technical indicators like RSI or moving averages. The model seeks to provide a more comprehensive picture of market dynamics by integrating these many inputs.
Contextual awareness is one of the main benefits of utilizing Conditional LSTM for financial prediction. Financial markets are intricate systems that are impacted by a wide range of variables. Because Conditional LSTM can combine several indicators, it may be able to reveal complex correlations between numerous market dynamics. Its ability to manage both static features and time-series data makes it a good fit for the financial markets, where past trends and present circumstances are equally important.
Furthermore, Conditional LSTMs are excellent at capturing long-term dependencies in time series data, just like conventional LSTMs. This is especially useful in the financial markets, where long-term patterns can emerge. The model can detect patterns that simpler models might overlook because of its capacity to retain pertinent information across extended sequences.
Nevertheless, there are certain difficulties in using Conditional LSTM for financial prediction. Although the model's greater complexity may have advantages, it also presents challenges. Overfitting becomes increasingly likely as training gets more complicated, particularly when working with smaller datasets. Higher computing costs result from this complexity, which may be a major factor in real-time trading applications.
Data quality and relevance become even more critical with Conditional LSTMs. The model requires not just price data, but also high-quality, relevant indicator data. Ensuring consistent and accurate data across all these dimensions can be challenging in the fast-moving and sometimes opaque world of financial markets.
It's also important to consider the fundamental nature of financial markets when evaluating the potential of Conditional LSTMs. Markets are influenced by unpredictable events and human behavior, which can limit the effectiveness of any predictive model, no matter how sophisticated. The model might excel at identifying patterns in historical data, but struggle when faced with unprecedented market conditions or major economic shocks.
Another issue with Conditional LSTMs, as with many deep learning models, is interpretability. Even while they might generate precise forecasts, it can be difficult to comprehend the reasoning behind them. The 'black box' aspect of this might cause issues in financial applications where explainability and openness are frequently essential.
Finally, even though Conditional LSTMs have intriguing opportunities for indicator-based stock and FX prediction, it is important to approach them thoughtfully. Their capacity to include intricate, multifaceted data may result in more precise and nuanced forecasts. They should, however, be utilized as a component of a more comprehensive, carefully thought-out analytical approach due to the difficulties presented by growing complexity, data requirements, and the intrinsic unpredictability of financial markets. a thorough understanding of the model's limits in practical situations and extensive backtesting. Applying such advanced techniques in the high-stakes realm of financial trading requires extensive backtesting and knowledge of the model's limitations in practical settings.
The model (as done in the py script), looks like this:
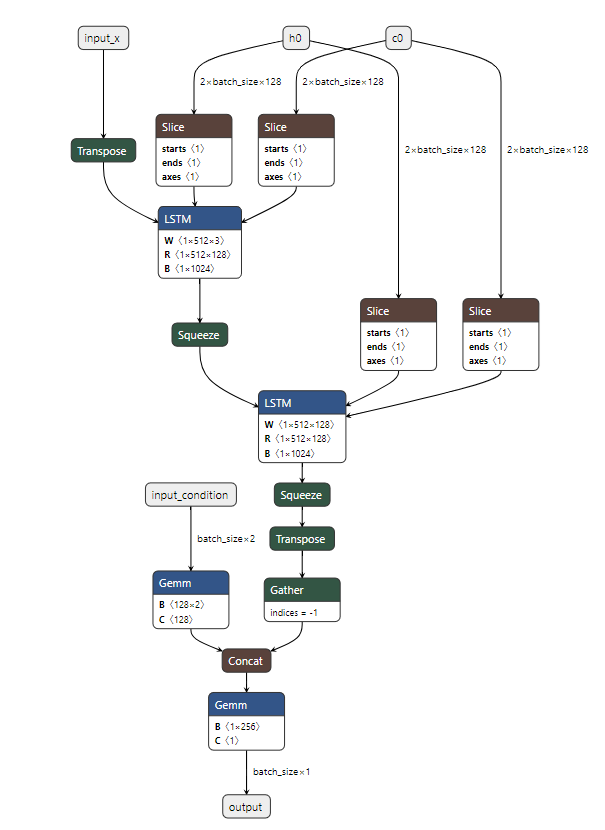
and its inputs and out puts should look like this:
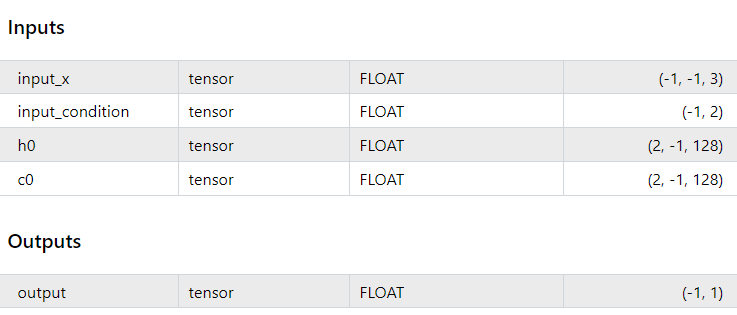
EA Code
This Expert Advisor (EA) core purpose is to automate trading decisions based on a combination of technical indicators and predictions from a deep learning (ONNX) model. The EA uses the Volatility Adjusted Momentum (VAM) indicator and MACD (Moving Average Convergence Divergence), along with price predictions made by a machine learning model. It executes trades depending on the combination of these elements.
The EA starts by defining several properties and libraries. The `CTrade` class is included for trade execution, and other headers for statistical functions and array management. Input parameters are defined for the VAM calculation and trade execution, such as `momentum_period`, `volatility_period`, and `vam_period`, which are used to control the logic for calculating momentum and volatility. Trading parameters like `lot_size`, and multipliers for stop loss (`slmul`) and take profit (`tpmul`) are defined here too, providing flexibility to the EA's behavior. Furthermore, constants defining the ONNX model parameters like `BATCH_SIZE`, `SEQUENCE_LENGTH`, and others are included to manage how data is passed to the deep learning model.
//+------------------------------------------------------------------+
//|                                                      VAM + DL(MACD) EA |
//|                                      Copyright 2024, Javier Santiago Gaston de Iriarte Cabrera |
//|                                       https://www.mql5.com/en/users/jsgaston/news |
//+------------------------------------------------------------------+
#property copyright "Javier Santiago Gaston de Iriarte Cabrera"
#property link      "https://www.mql5.com/en/users/jsgaston/news"
#property version   "1.01"


#include <Trade\Trade.mqh>
#include <Math\Stat\Math.mqh>
#include <Arrays\ArrayFloat.mqh>

CTrade trade;

// Inputs
input int momentum_period = 13;
input int volatility_period = 7;
input int vam_period = 9;
input double lot_size = 0.01;
input int slippage = 3;
input double VAMTHRESH = 9.0;
input int slmul = 2;
input int tpmul = 4;

// ONNX model parameters
#define BATCH_SIZE 1
#define SEQUENCE_LENGTH 30
#define INPUT_FEATURES 3
#define CONDITION_FEATURES 2
#define HIDDEN_DIM 128
#define NUM_LAYERS 2

float input_x[][SEQUENCE_LENGTH][INPUT_FEATURES];
float input_condition[][CONDITION_FEATURES];
float h0[][BATCH_SIZE][HIDDEN_DIM];
float c0[][BATCH_SIZE][HIDDEN_DIM];

#define PRICE_UP   0
#define PRICE_SAME 1
#define PRICE_DOWN 2

long ExtHandle = INVALID_HANDLE;
int ExtPredictedClass = -1;
datetime ExtNextBar = 0;
datetime ExtNextDay = 0;
float ExtMin = 0.0;
float ExtMax = 1.0;  // Initialize to 1.0 to prevent division by zero
float predicted_last;

#resource "/Files/stock_prediction_model_MACD.onnx" as uchar ExtModel[]
The initialization function `OnInit()` is crucial as it loads the ONNX model from a binary resource (`stock_prediction_model_MACD.onnx`), setting up the model's input and output shapes. The input to the ONNX model consists of historical price data, MACD values, and initialized hidden and cell states (`h0`, `c0`) for the recurrent layers of the model. If the model is loaded successfully, the function also initializes minimum and maximum price values (`ExtMin` and `ExtMax`), which will be used for normalizing the input data to the ONNX model. If any error occurs during model loading, it returns `INIT_FAILED`, effectively halting the EA’s operation.
//+------------------------------------------------------------------+
//| Expert initialization function                                   |
//+------------------------------------------------------------------+
int OnInit()
  {
   Print("BATCH_SIZE: ", BATCH_SIZE, ", CONDITION_FEATURES: ", CONDITION_FEATURES);
   ExtHandle = OnnxCreateFromBuffer(ExtModel,ONNX_DEFAULT);
   if(ExtHandle == INVALID_HANDLE)
     {
      Print("OnnxCreateFromBuffer error ", GetLastError());
      return(INIT_FAILED);
     }

// Set input shapes
   long input_shape[] = {BATCH_SIZE, SEQUENCE_LENGTH, INPUT_FEATURES};
   if(!OnnxSetInputShape(ExtHandle, ONNX_DEFAULT, input_shape))
     {
      Print("OnnxSetInputShape for input_x error ", GetLastError());
      return(INIT_FAILED);
     }

   long condition_shape[] = {BATCH_SIZE,CONDITION_FEATURES};
   if(!OnnxSetInputShape(ExtHandle, 1, condition_shape))
     {
      Print("OnnxSetInputShape for input_condition error ", GetLastError());
      return(INIT_FAILED);
     }

   long h0_shape[] = {NUM_LAYERS, BATCH_SIZE, HIDDEN_DIM};
   if(!OnnxSetInputShape(ExtHandle, 2, h0_shape))
     {
      Print("OnnxSetInputShape for h0 error ", GetLastError());
      return(INIT_FAILED);
     }

   long c0_shape[] = {NUM_LAYERS, BATCH_SIZE, HIDDEN_DIM};
   if(!OnnxSetInputShape(ExtHandle, 3, c0_shape))
     {
      Print("OnnxSetInputShape for c0 error ", GetLastError());
      return(INIT_FAILED);
     }


   const long output_shape[] = {1,1};
   if(!OnnxSetOutputShape(ExtHandle,0,output_shape))
     {
      Print("OnnxSetOutputShape error ",GetLastError());
      return(INIT_FAILED);
     }

// Initialize ExtMin and ExtMax
   GetMinMax();

   Print("Initializing EA with VAM and ONNX integration");
   return(INIT_SUCCEEDED);
  }
The `OnTick()` function is the core logic that runs on every price tick. It starts by checking if it’s a new day and updates the minimum and maximum prices accordingly using `GetMinMax()`. The next block ensures that the function only continues when a new price bar is available. The EA then updates the `ExtMin` and `ExtMax` variables to the most recent price values. The heart of this function is the combination of the VAM calculation and the ONNX prediction. VAM is calculated by taking the difference in price (momentum) and dividing it by the product of volatility and the square root of the `momentum_period`, scaled by 10,000. If the VAM exceeds a threshold (`VAMTHRESH`), it indicates a strong trend in the market, signaling a potential trade.
The EA then combines the prediction and VAM results. If VAM is high (greater than `VAMTHRESH`) and the ONNX model predicts a price increase, the EA opens a buy trade with a calculated stop loss and take profit based on the Average True Range (ATR). Similarly, if VAM is low (below negative `VAMTHRESH`) and the ONNX model predicts a price decrease, the EA opens a sell trade. These trades are executed using the `CTrade` class, which interacts with the MetaTrader 5 platform's trade functions.
In terms of risk management, the stop loss and take profit levels are dynamically calculated based on the ATR of the asset. This ensures that the strategy adjusts to the volatility of the market, providing more adaptable trade exits depending on current market conditions.void OnTick() { // Check for new day and update ExtMin and ExtMax if(TimeCurrent() >= ExtNextDay) { GetMinMax(); ExtNextDay = TimeCurrent() - TimeCurrent() % PeriodSeconds(PERIOD_D1) + PeriodSeconds(PERIOD_D1); } // Check for new bar if(TimeCurrent() < ExtNextBar) return; ExtNextBar = TimeCurrent() - TimeCurrent() % PeriodSeconds() + PeriodSeconds(); // Update ExtMin and ExtMax double close = iClose(_Symbol, _Period, 0); if(ExtMin > close) ExtMin = (float)close; if(ExtMax < close) ExtMax = (float)close; int bars = iBars(_Symbol, PERIOD_CURRENT); if(bars < MathMax(momentum_period, MathMax(volatility_period, MathMax(vam_period, SEQUENCE_LENGTH)))) return; // Calculate VAM double momentum = close - iClose(_Symbol, PERIOD_CURRENT, momentum_period); double volatility = iStdDev(_Symbol, PERIOD_CURRENT, volatility_period, 0, MODE_SMA, PRICE_CLOSE); double vam = (momentum / (volatility * MathSqrt(momentum_period))) * 10000; Print("VAM ", vam); // Get ONNX prediction int result=GetPrediction(); // Trading logic combining VAM and ONNX prediction double atr = iATR(_Symbol, PERIOD_CURRENT, 14)*_Point; double Bid = SymbolInfoDouble(_Symbol, SYMBOL_BID); double Ask = SymbolInfoDouble(_Symbol, SYMBOL_ASK); double slPriceBuy = NormalizeDouble(Bid - slmul * atr, _Digits); double tpPriceBuy = NormalizeDouble(Ask + tpmul * atr, _Digits); double slPriceSell = NormalizeDouble(Ask + slmul * atr, _Digits); double tpPriceSell = NormalizeDouble(Bid - tpmul * atr, _Digits); //Print(result); if(vam > VAMTHRESH && result == 0) { trade.Buy(lot_size, _Symbol, Ask, slPriceBuy, tpPriceBuy, "BUY VAM+ONNX"); } else if(vam < -VAMTHRESH && result == 2) { trade.Sell(lot_size, _Symbol, Bid, slPriceSell, tpPriceSell, "SELL VAM+ONNX"); } }
The ONNX model prediction is fetched by calling `GetPrediction()`. The input to the model is prepared by the `PrepareInputs()` function, which gathers the historical close prices and MACD data, normalizes them using the price range (`ExtMin` and `ExtMax`), and fills the input arrays expected by the model. It sets the data for the input price sequence (`input_x`) and MACD-based conditions (`input_condition`) while resetting the hidden states (`h0`, `c0`). Once the input is ready, the model is run by the `OnnxRun()` function, which computes the predicted price. The difference between the predicted price and the last predicted price is used to determine whether the model expects the price to move up, down, or remain the same. If the change in prediction is too small, the model suggests no movement (price stays the same).
void PrepareInputs()
  {
   ArrayResize(input_x, BATCH_SIZE);
   ArrayResize(input_condition, BATCH_SIZE);
   ArrayResize(h0, NUM_LAYERS);
   ArrayResize(c0, NUM_LAYERS);

   for(int i = 0; i < SEQUENCE_LENGTH; i++)
     {
      input_x[0][i][0] = (float)((iClose(_Symbol, PERIOD_CURRENT, i) - ExtMin) / (ExtMax - ExtMin));

      double macd_main[], macd_signal[];
      int macd_handle = iMACD(_Symbol, PERIOD_CURRENT, 12, 26, 9, PRICE_CLOSE);
      CopyBuffer(macd_handle, 0, i, 1, macd_main);
      CopyBuffer(macd_handle, 1, i, 1, macd_signal);
      input_x[0][i][1] = (float)((macd_main[0] - ExtMin) / (ExtMax - ExtMin));
      input_x[0][i][2] = (float)((macd_signal[0] - ExtMin) / (ExtMax - ExtMin));
     }

   double macd_main2[], macd_signal2[];
   int macd_handle2 = iMACD(_Symbol, PERIOD_CURRENT, 12, 26, 9, PRICE_CLOSE);
   CopyBuffer(macd_handle2, 0, 0, 1, macd_main2);
   CopyBuffer(macd_handle2, 1, 0, 1, macd_signal2);
   input_condition[0][0] = (float)macd_main2[0];
   input_condition[0][1] = (float)macd_signal2[0];

   ArrayInitialize(h0, 0.0f);
   ArrayInitialize(c0, 0.0f);
  }
//+------------------------------------------------------------------+
//| Get prediction from ONNX model                                   |
//+------------------------------------------------------------------+
int GetPrediction()
  {
   PrepareInputs();


   float output_data[];
   ArrayResize(output_data, 1);

// Run the ONNX model
   if(!OnnxRun(ExtHandle,
               ONNX_NO_CONVERSION,
               input_x,
               input_condition,
               h0,
               c0,
               output_data))
     {
      Print("OnnxRun error: ", GetLastError());
      return ExtPredictedClass = -1;
     }

   float predicted=output_data[0]*(ExtMax-ExtMin)+ExtMin;
   Print("Predicted last ", predicted_last);
   Print("Predicted ",predicted);
   float last_close = (float)iClose(_Symbol, PERIOD_CURRENT, 0);
   Print("last close ",last_close);
   float delta = predicted_last - predicted;
   predicted_last=predicted;
   Print("Delta ",delta);

   if(MathAbs(delta) <= 0.00001)
      ExtPredictedClass = PRICE_SAME;
   else
      if(delta < 0)
         ExtPredictedClass = PRICE_UP;
      else
         ExtPredictedClass = PRICE_DOWN;
   Print(ExtPredictedClass);

   return ExtPredictedClass;

  }
The `GetMinMax()` function is responsible for setting the minimum (`ExtMin`) and maximum (`ExtMax`) price values over the last day of data. These values are used to normalize the inputs before passing them to the ONNX model, ensuring that the model receives inputs in a consistent range. If the EA fails to retrieve the necessary price data, it defaults to a safe range to avoid division by zero.
void GetMinMax()
  {
   double close[];
   int copied = CopyClose(_Symbol, PERIOD_D1, 0, SEQUENCE_LENGTH, close);

   if(copied > 0)
     {
      ExtMin = (float)MathMin(close);
      ExtMax = (float)MathMax(close);
     }
   else
     {
      Print("Failed to copy price data. Error: ", GetLastError());
      ExtMin = 0;
      ExtMax = 1;  // Prevent division by zero
     }
  }
Finally, the EA includes a deinitialization function `OnDeinit()` that releases the ONNX model handle when the EA is removed, ensuring that memory is properly managed and avoiding resource leaks.
void OnDeinit(const int reason)
  {
   if(ExtHandle != INVALID_HANDLE)
     {
      OnnxRelease(ExtHandle);
      ExtHandle = INVALID_HANDLE;
     }
  }
In summary, this EA blends technical analysis (via VAM and MACD) with machine learning predictions from an ONNX model to make informed, automated trading decisions. The technical analysis helps spot trends, while the machine learning model forecasts price movement, resulting in a hybrid strategy.
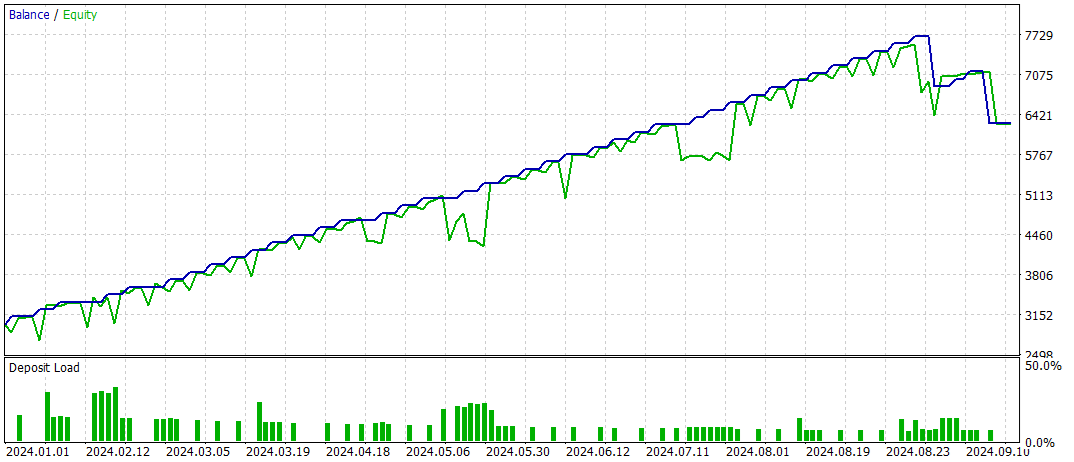
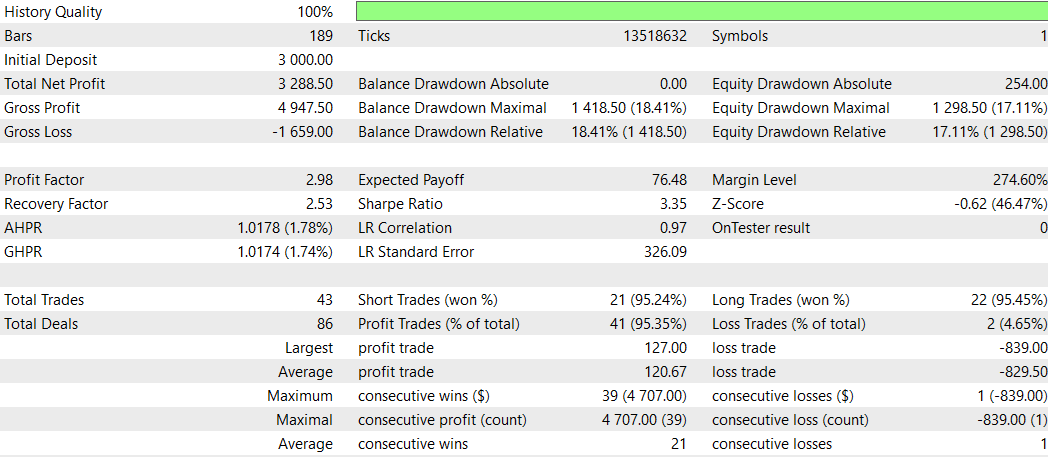
Results
After optimization 

Conclusion
This article examines the integration of deep learning, specifically Conditional LSTM models, with the Volatility Adjusted Momentum (VAM) indicator to enhance automated trading systems. By combining LSTM's predictive capabilities and VAM's volatility-sensitive momentum analysis, the strategy aims to capture complex market dynamics. Implemented on MetaTrader 5, this system generates trading signals and adapts risk management dynamically.
Backtesting shows improved outcomes when LSTM is combined with VAM. Despite challenges like overfitting and computational demands, the study suggests that integrating deep learning with technical analysis can significantly improve algorithmic trading strategies.
 Building A Candlestick Trend Constraint Model (Part 9): Multiple Strategies Expert Advisor (I)
 How to develop any type of Trailing Stop and connect it to an EA
 Creating an MQL5-Telegram Integrated Expert Advisor (Part 7): Command Analysis for Indicator Automation on Charts
 Multiple Symbol Analysis With Python And MQL5 (Part I): NASDAQ Integrated Circuit Makers
- Free trading apps
- Over 8,000 signals for copying
- Economic news for exploring financial markets
You agree to website policy and terms of use
double volatility = iStdDev(_Symbol, PERIOD_CURRENT, volatility_period, 0, MODE_SMA, PRICE_CLOSE);
Ok i will try it to make a new model but from some researchers that i saw it is good to make changes at least every 6 months. i will backtest firstly with different inputs on mt5 and onnx model i will let with that values that you placed. Entry is perfect but i saw today that tp and sl have to tune based broker. Thank you!
Hi, good q.
Its good to make a new model every 6 months (if you are using 1d time frame periods), what would be interesting, is to make a model with some kind of exponential or lineal weights (so last values had weight more ... I'm working on this, I will push an article about this), and in that case, yes, you should do models much more frequently. Yes 6 months has good results in day trading, but its not so different from 3 months. It's more interesting to give waits to last values, because one model usually has 10 thousand last candles ... I will work on this and push one article.
I see purpose if this EA is to open position based volatility and noises are needed now, if we use ma then we can see only trend.
Well, the purpose of this article is to see that we can also make conditional LSTM models with indicators that also give good result as shown ... the VAM is for you to see that an indicator is something not so difficult to create.
Hi Javier
Thanks for reply.
I found the problem. You have named "stock_prediction_model_MACD.onnx" in EA but zip files have it named as stock_prediction_model_MACD_Signal.onnx
I have also noticed inappropriate use of indicator handle (bug!!!) in the code. You have used
In MQL5, indicator values are derived using CopyBuffer and indicator handle, which you have used in
Can you please elaborate why handle was used differently with double variable to get the values in the first case?Regards and have nice weekend.
Hi Anil
atr * _Point() to use the value directly. Print atr without the point and it will give weird values.
Hi Javier
Thanks for reply.
I found the problem. You have named "stock_prediction_model_MACD.onnx" in EA but zip files have it named as stock_prediction_model_MACD_Signal.onnx
I have also noticed inappropriate use of indicator handle (bug!!!) in the code. You have used
In MQL5, indicator values are derived using CopyBuffer and indicator handle, which you have used in
Can you please elaborate why handle was used differently with double variable to get the values in the first case?Regards and have nice weekend.
You are completely right!
I made a mistake there, thanks for making that point.
You have to use copybuffer and handle.