
Price-Driven CGI Model: Advanced Data Post-Processing and Implementation
Contents:
- Introduction
- Setting up workflow
- Building a Price Data Export script program using MQL5
- Implementation of the scripts
- Data Post-Processing script using Python
- Implementation of refined data in Blender 3D
- Conclusion
Introduction:
Previously, in the Price Driven CGI Model project, we exported price data from MetaTrader 5. However, we lacked control over the data features, requiring us to build a data manipulation algorithm to modify or filter it with specific formulas to suit our intended usage. Despite this, we successfully launched the Price Man CGI character and have preserved it as an image.
By using MQL5, we can develop a script to perform customized exports, simplifying post-processing. In this article, we will build a program to export our price data and discuss the practical application of the post-processed data to bring our character to life.
By the end of this article, our objectives are:
- Build a custom program for exporting price data from MetaTrader 5.
- Normalize the price data for use in other software programs.
- Integrate the normalized price data with Blender 3D.
- Understand how the data is further handled using Python in Blender 3D.
If you read to the end, you will see the animated Linear Graph editor of Price Man, with plots made using post-processed price data from MetaTrader 5 for the Volatility 25 Index. Here is a preview of the graph editor:
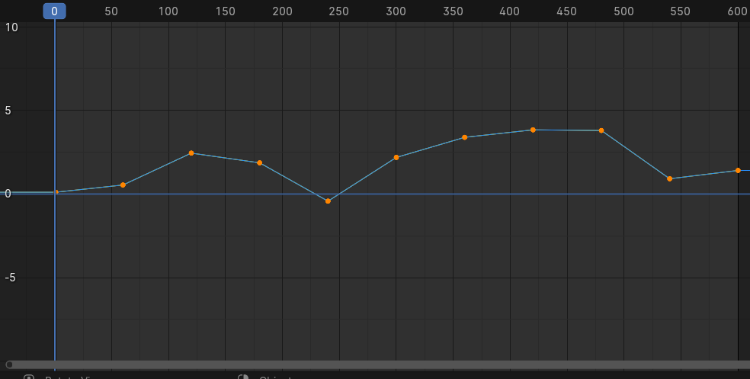
Graph Editor: Price Man linear animation with price data in Blender 3D
In this editor, you can see how the post-processed price data from MetaTrader 5 has been transformed into a visual representation. This allows us to analyze and manipulate the data more effectively, paving the way for further integration and application in Blender 3D using Python. Stay tuned as we delve deeper into these exciting possibilities!
This project requires three specific software programs: Python, Blender 3D, and especially MetaTrader 5, which includes MetaEditor for writing our MQL5 programs. I will provide a brief installation guide in the next segment. You might also consider using Inkscape for further exploration, as it was used last time to create our character.
Setting up Workflow:
Our project requires you to have the Price Man portable image file, which you can find in the attachments of the previous article. Here, I will show you how to import the file into Blender 3D. I have outlined the installation and import steps below:
- Install MetaTrader 5:
To install MetaTrader 5 on a Windows system, visit the official MetaTrader 5 website and download the MetaTrader 5 installer. Once the download is complete, locate the installer file and double-click it to run it. Follow the on-screen instructions to complete the installation, including accepting the license agreement and selecting the installation directory. After the installation is finished, launch MetaTrader 5 from the Start menu or desktop shortcut, and log in with your trading account credentials to start using the platform.
- Install the latest Python:
To install Python on a Windows system, visit the official Python website at python.org, and navigate to the "Downloads" section to check for the latest version suitable for Windows. Download the installer executable for your system (either 32-bit or 64-bit). Once the download is complete, run the installer, making sure to check the box that says, "Add Python to PATH," and then choose either the "Install Now" or "Customize Installation" option based on your needs. After the installation is finished, you can verify it by opening the Command Prompt and typing python --version to confirm that Python is installed correctly
- Install Blender 3D:
To install Blender 3D on a Windows system, visit the official Blender website at blender.org, and download the recommended Windows installer. Once downloaded, run the installer, follow the on-screen instructions to accept the license agreement, choose the installation location, and complete the installation. After installation, launch Blender from the desktop shortcut or Start menu. Ensure your system meets the requirements and that you have the latest graphics drivers installed for optimal performance.
- Importing CGI character to Blender 3D:
For easy use and rendering, we have decided to use a portable 2D image for simpler processing and calculations. In Blender 3D, you can set up preferences to allow importing images as planes, a plugin that facilitates handling images. This capability demonstrates the feasibility of developing scripts that integrate price data with graphic software.
Here’s how to import images as planes in Blender 3D:
-
Enable the Add-on:
- Open Blender.
- Go to Edit > Preferences.
- In the Preferences window, go to the Add-ons tab.
- Search for "Import-Export: Import Images as Planes."
- Check the box next to the add-on to enable it.
-
Import the Image as a Plane:
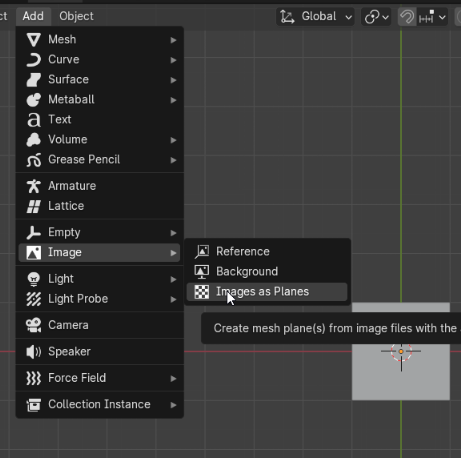
- In the 3D Viewport, press Shift + A to open the Add menu.
- Navigate to image and select Images as Planes.
- A file browser will appear, allowing you to select the desired image.
- Once the image is selected, it will be imported as a flat plane in the scene, aligned with the scene's grid.
-
Adjust the Image Plane:
- After importing, you can adjust the image plane’s position, scale, and material properties as needed.
- It's also essential to make Blender display the object's material; otherwise, you will only see a mesh
Here's the illustration for the importation of the file.
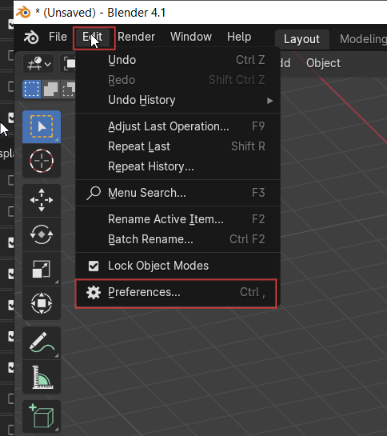
Blender 3D preferences
Building a Price Data Export script program using MQL5:
In the prior article, we explored how to manually export data from MetaTrader 5. However, the features of the data were not customizable. It would be highly beneficial to build a program that is fully optimizable for the specific tasks we need to accomplish. By defining the program logic, we can specify everything required to meet our desired results.
Program Expectations:
- It must be able to export price data and save it at a specified storage location.
- It must contain Open and Close Price for each bar.
- The time range for the bars must be customizable.
- The timeframe for the bars must be customizable.
With the above outline, we have a foundation for development. Now, let’s structure the code and discuss how to put everything together.
First, let’s start with our properties. I have added comments next to each line of code for clarity.
#property indicator_chart_window //So that the program works on the main chart and does not create another window.
#property copyright "Copyright 2024, Clemence Benjamin"
#property link      "https://www.mql5.com/en/users/billionaire2024/seller"
#property version   "1.0"
#property description "Price Data Exporter"
#property strict // #property strict: Enforces strict type-checking rules in the script to prevent potential coding errors.
#property script_show_inputs //#property script_show_inputs: Ensures that input variables are visible in the script's input dialog.
To make our program features more customizable, we have designed input logic that allows us to optimize the specialized values we need. Each line of code is followed by a comment explaining its function. By creating this special script, our goal is to filter the data to obtain only the specialized information required.
For example, we include a Timescale factor to facilitate a fast-forward replay. This allows us to visualize the effects of price changes on our CGI character in a shortened time frame. For instance, we can simulate a movement that might have taken place over 3 hours in just 36 seconds by applying the appropriate calculation logic.
input string ExportFileName = "PriceData.csv";       // Name of the file
input datetime StartTime = D'2023.01.01 00:00';       // Start time for data export
input datetime EndTime = D'2023.12.31 23:59';         // End time for data export
input ENUM_TIMEFRAMES TimeFrame = PERIOD_D1;          // Timeframe for data export
input double TimeScaleFactor = 60.0;                  // Timescale factor (e.g., 60 for 1 minute to 1 second)
The OnStart function is the default and main function of every script. In our program, it calls all the inputs under the Export Price Data function. This ensures that all specified settings and parameters are applied during the execution of the script.
void OnStart()
  {
   ExportPriceData(ExportFileName, StartTime, EndTime, TimeFrame, TimeScaleFactor);
  }
Finally, the Export Price Data function handles the entire export logic in the program. Below this code snippet, we will briefly explain each process, though more details are also provided in the comments within the program.
void ExportPriceData(string filename, datetime startTime, datetime endTime, ENUM_TIMEFRAMES timeframe, double timescale)
  {
   int handle = FileOpen(filename, FILE_WRITE|FILE_CSV, ',', CP_ACP);

   if(handle == INVALID_HANDLE)
     {
      Print("Error opening file: ", filename);
      return;
     }

   // Write the header
   FileWrite(handle, "Open", "Close", "Change", "Duration");

   // Get the total number of bars in the specified time frame
   int totalBars = iBars(_Symbol, timeframe);

   // Loop through the bars and collect data within the specified time range
   for(int i = totalBars - 1; i > 0; i--)
     {
      datetime time = iTime(_Symbol, timeframe, i);
      datetime nextTime = iTime(_Symbol, timeframe, i - 1); // Time of the next bar

      // Check if the bar's time is within the specified range
      if(time >= startTime && time <= endTime)
        {
         double open = iOpen(_Symbol, timeframe, i);
         double close = iClose(_Symbol, timeframe, i);
         double change = close - open;

         // Calculate duration in seconds and apply timescale factor
         double duration = (nextTime - time) / timescale;

         // Write data to file
         FileWrite(handle, open, close, change, duration);
        }
     }

   FileClose(handle);
   Print("Export completed. File: ", filename);
  }
As highlighted above in the code, here is what is going on:
FileOpen: Opens the file for writing in CSV format. It returns a file handle.
FileWrite: Writes data to the open file.
In this project, I proposed some mathematical operations for different columns as part of advanced post-processing. This approach ensures that our data is exported with a unique format, reducing the burden of normalization later in the process.
- I have put the specialized columns that handle the data and also included the simple math for calculating price changes. It can be a negative or a positive change.
Here's the formula:
Price Change = Close Price - Open Price
- Another calculation involves the Duration, which is given in seconds to speed up the replay of price changes that would normally take a long time. We are simply using a ration of 1 minute as to 1 second.
In this outlined explanation, note that the, "i" prefix before terms indicates that the function retrieves data related to technical indicators or market prices, according to MQL5 syntax.
- iBars: Retrieves the total number of bars in the specified timeframe.
- iTime: Returns the opening time of a specific bar.
- iOpen: Returns the opening price of a specific bar.
- iClose: Returns the closing price of a specific bar.
FileClose: Closes the file after writing is complete.
Print: Outputs a message to the terminal, indicating the status of the export process
The whole program put together is like this:
//+------------------------------------------------------------------+
//|                                                 CSV_Exporter.mq5 |
//|                                Copyright 2024, Clemence Benjamin |
//|                                             https://www.mql5.com |
//+------------------------------------------------------------------+

#property indicator_chart_window
#property copyright "Copyright 2024, Clemence Benjamin"
#property link      "https://www.mql5.com/en/users/billionaire2024/seller"
#property version   "1.0"
#property description "Price Data Exporter"
#property strict
#property script_show_inputs

// Input parameters
input string ExportFileName = "PriceData.csv";       // Name of the file
input datetime StartTime = D'2023.01.01 00:00';       // Start time for data export
input datetime EndTime = D'2023.12.31 23:59';         // End time for data export
input ENUM_TIMEFRAMES TimeFrame = PERIOD_D1;          // Timeframe for data export
input double TimeScaleFactor = 60.0;                  // Timescale factor (e.g., 60 for 1 minute to 1 second)

//+------------------------------------------------------------------+
//| Script program start function                                    |
//+------------------------------------------------------------------+
void OnStart()
  {
   string finalFileName = GenerateUniqueFileName(ExportFileName);
   ExportPriceData(finalFileName, StartTime, EndTime, TimeFrame, TimeScaleFactor);
  }
//+------------------------------------------------------------------+
//| Generate a unique file name if one already exists                |
//+------------------------------------------------------------------+
string GenerateUniqueFileName(string filename)
  {
   string name = filename;
   int counter = 1;

   while(FileIsExist(name))
     {
      name = StringFormat("%s_%d.csv", StringSubstr(filename, 0, StringFind(filename, ".csv")), counter);
      counter++;
     }

   return name;
  }
//+------------------------------------------------------------------+
//| Export price data to CSV file                                    |
//+------------------------------------------------------------------+
void ExportPriceData(string filename, datetime startTime, datetime endTime, ENUM_TIMEFRAMES timeframe, double timescale)
  {
   int handle = FileOpen(filename, FILE_WRITE|FILE_CSV, ',', CP_ACP);

   if(handle == INVALID_HANDLE)
     {
      Print("Error opening file: ", filename);
      return;
     }

   // Write the header
   FileWrite(handle, "Open", "Close", "Change", "Duration");

   // Get the total number of bars in the specified time frame
   int totalBars = iBars(_Symbol, timeframe);

   // Loop through the bars and collect data within the specified time range
   for(int i = totalBars - 1; i > 0; i--)
     {
      datetime time = iTime(_Symbol, timeframe, i);
      datetime nextTime = iTime(_Symbol, timeframe, i - 1); // Time of the next bar

      // Check if the bar's time is within the specified range
      if(time >= startTime && time <= endTime)
        {
         double open = iOpen(_Symbol, timeframe, i);
         double close = iClose(_Symbol, timeframe, i);
         double change = close - open;
         change = NormalizeDouble(change, 3);  // Round to 3 decimal places

         // Calculate duration in seconds and apply timescale factor
         double duration = (nextTime - time) / timescale;

         // Write data to file
         FileWrite(handle, open, close, change, duration);
        }
     }

   FileClose(handle);
   Print("Export completed. File: ", filename);
  }
//+------------------------------------------------------------------+
Implementation of the scripts:
Our program compiled successfully. Although we faced some challenges during the initial development, we resolved all issues and prepared an error-free version for easy understanding by readers. This means further adjustments and modifications for other projects can be made as needed.
The program profiling was very successful. Initially, the program created a Price Data file but later failed to create new files for additional data export attempts. We adjusted the code to ensure each new file had a unique figure extension to avoid overwriting the same file.
Let’s go through the images below to see how it unfolded.
For this project, I used the Volatility 25 Index, with price data from 31/07/24 00:00 hrs to 31/07/24 03:00 hrs
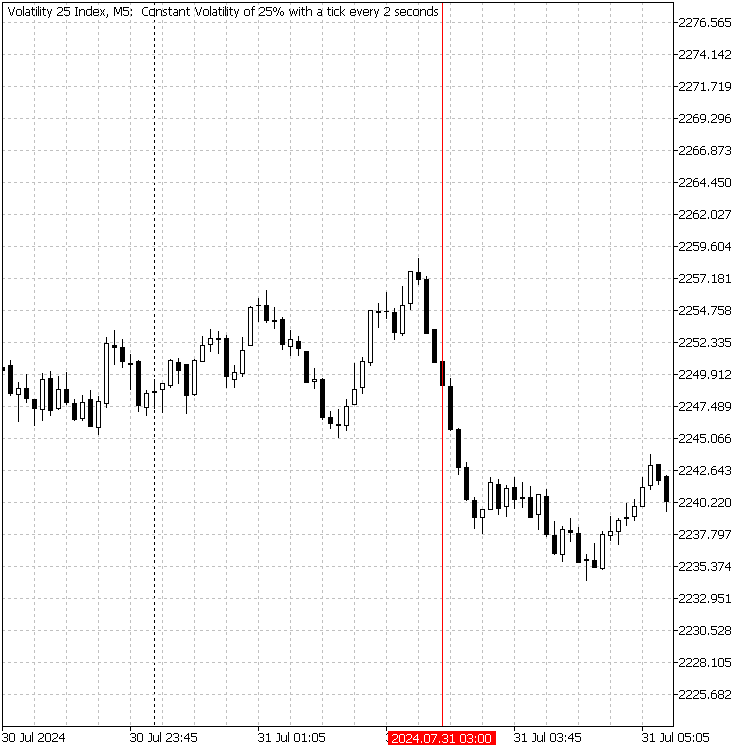
Volatility 25 Index
We proceeded to demonstrate how the script functions and is customized for the specific time range we wanted—just 3 hours from the start of the day.
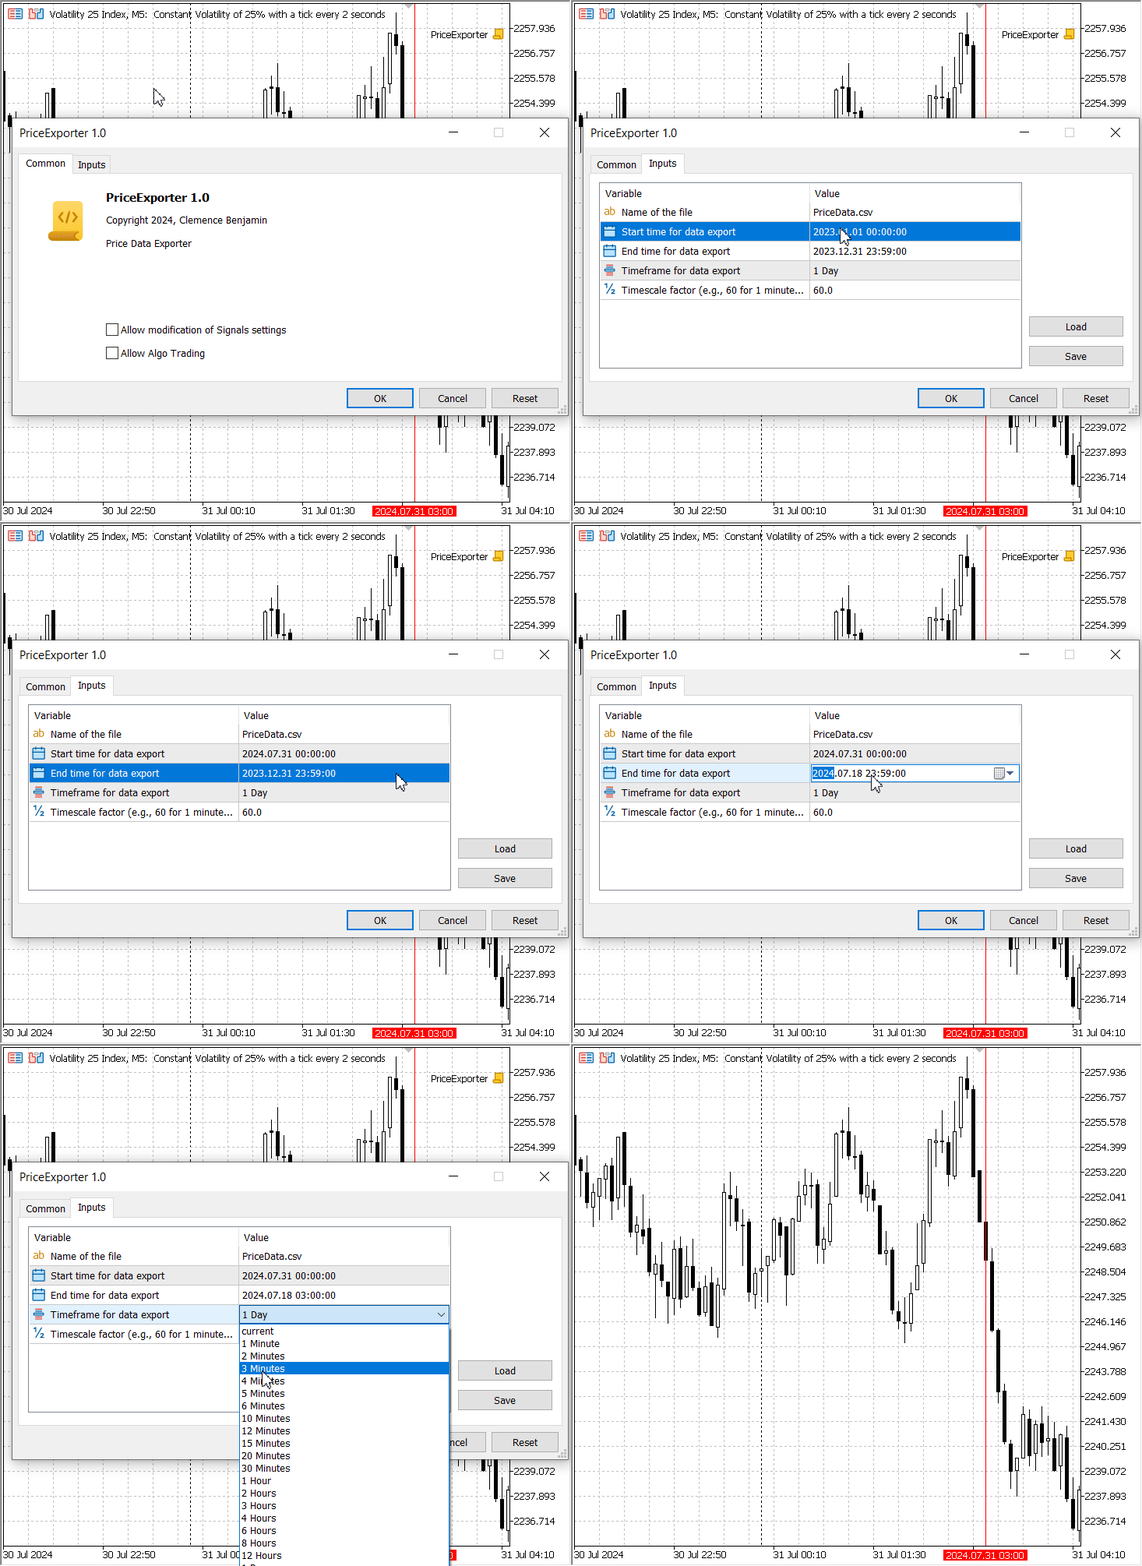
Volatility 25 Index: Exporting price data using the MQL5 scripts
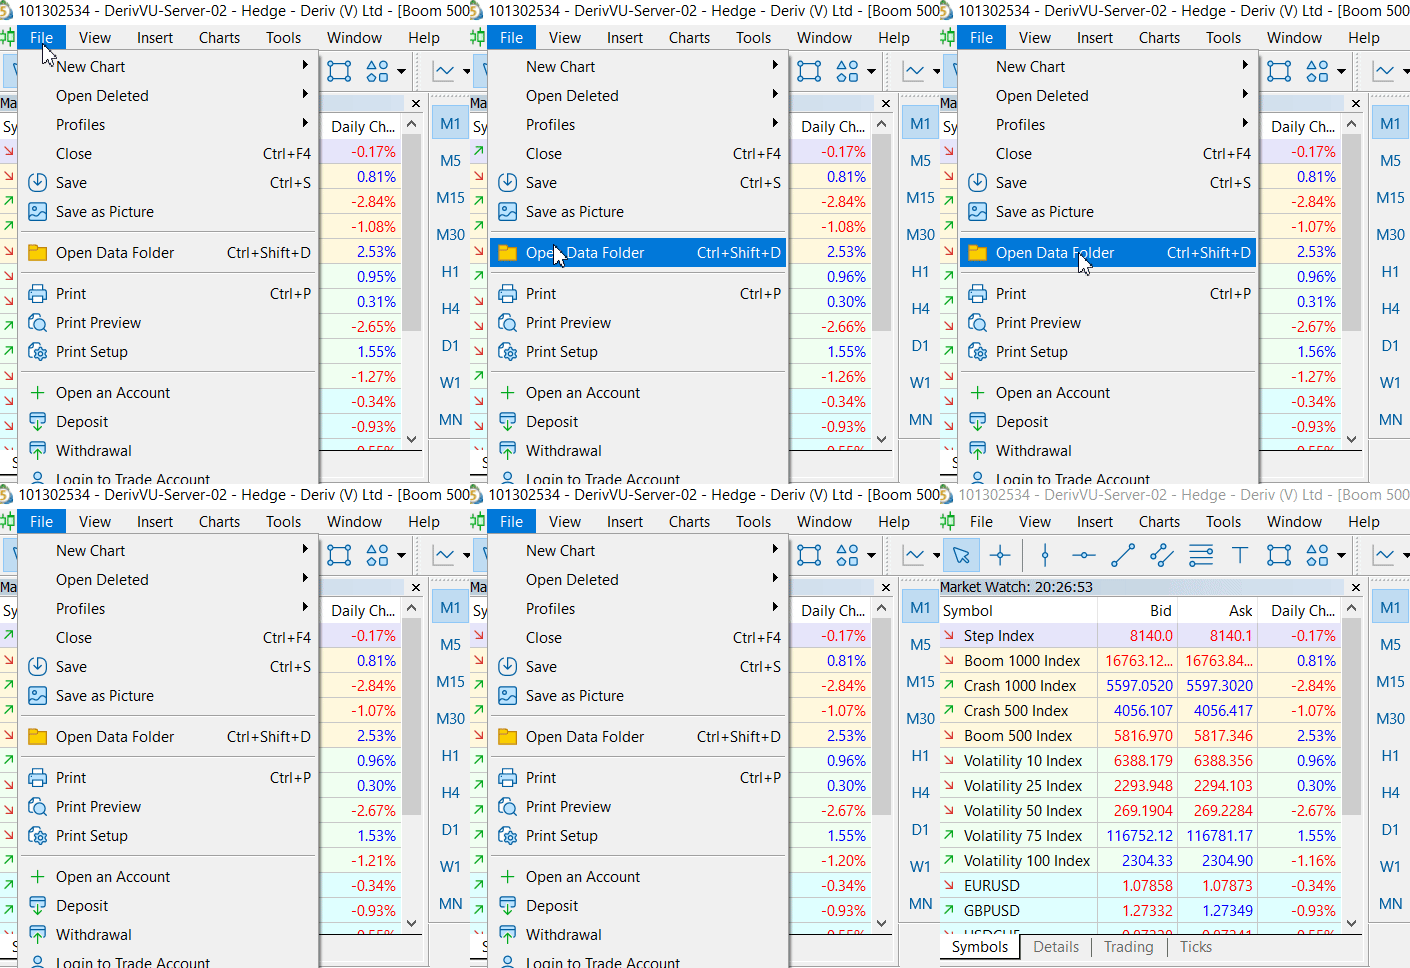
To navigate to the MQL5 data folder through MetaTrader 5 and locate the file's folder where the exported data is securely stored, follow these steps:
- Open MetaTrader 5:
- Launch the MetaTrader 5 application on your computer.
Access the Data Folder:
- In MetaTrader 5, click on File in the top menu.
- Select Open Data Folder from the dropdown menu. This will open the MQL5 data folder in your file explorer.
Locate the Files Folder:
- In the MQL5 data folder, open the Files folder. This is where your exported data files are securely stored.
. 
Accessing Exported Files
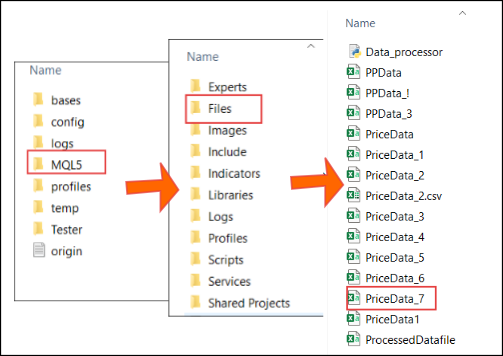
Accessing the exported files
Data Post-Processing script using Python:
To call for further fine-tuning of our data, we need to address the status of the Price Data_7 file based on the exportation that took place. Let's unfold the presentation of Price Data_7 according to the exportation:
Volatility 25 Index, M5: Raw data
Keys facts from the image:
- The data is comma separated as its format implies, CSV.
- It's quite challenging to easily analyze the data with an eye due to presentation.
- Its columns are not well aligned.
Now we can build our data normalization script in Python based on the above information.
Here is our clean code after fixing all errors. I will briefly explain it below. For more information about the Pandas library, please revisit the previous version of this article
import pandas as pd

def process_csv(input_file, output_file, encoding='utf-16'):
    # Define the column names (assuming the order in the CSV is consistent)
    column_names = ['Open', 'Close', 'Change', 'Duration']

    try:
        # Read the CSV file without headers using UTF-16 encoding
        df = pd.read_csv(input_file, header=None, names=column_names, encoding=encoding)

        # Strip leading/trailing whitespace from column data
        df = df.applymap(lambda x: x.strip() if isinstance(x, str) else x)

        # Remove any rows that are duplicates of the header (e.g., if it appears twice)
        df = df[df['Open'] != 'Open']

        # Display the processed data
        print("Processed Data:")
        print(df.head())

        # Save the processed data to a new CSV file with column names
        df.to_csv(output_file, index=False)
        print(f"Processed data saved to {output_file}")

    except UnicodeDecodeError as e:
        print(f"Error reading the file: {e}")
        print("Try using a different encoding like 'ISO-8859-1' or 'windows-1252'.")
    except pd.errors.EmptyDataError as e:
        print(f"No data: {e}")
    except Exception as e:
        print(f"An unexpected error occurred: {e}")

# Prompt the user for input and output file names and encoding
input_file = input("Enter the input CSV file name (e.g., 'PriceData.csv'): ")
output_file = input("Enter the desired output CSV file name (e.g., 'ProcessedPriceData.csv'): ")
encoding = input("Enter the file encoding (default is 'utf-16'): ") or 'utf-16'

# Call the function with the provided file names and encoding
process_csv(input_file, output_file, encoding)
This program is quite engaging as it prompts the user to input the file intended for post-processing and the desired output file name. It also asks for encoding, which is important when dealing with different data formats. In this case, we are using the default utf-16, but other examples include ISO-8859-1 and Windows-1252. Without proper consideration of encoding, you might encounter significant errors.
The two major processes that the program is performing are:
- Setting Column Names: The script defines a list called column_names, which specifies the expected column names in the CSV file: ['Open', 'Close', 'Change', 'Duration'].
- Cleaning the Data: The script uses apply map() to strip any leading or trailing whitespace from string data in the DataFrame. This ensures clean data. It then removes any rows where the 'Open' column has the value 'Open', which could indicate a repeated header row.
To run the program, I used Notepad++ as my editor and saved it with a unique name. For simplicity during the process, I ensured that the program was saved in the same folder as the CSV files. I then launched the Windows Command Prompt in that folder. This can be easily done using Notepad++; see the image below for reference
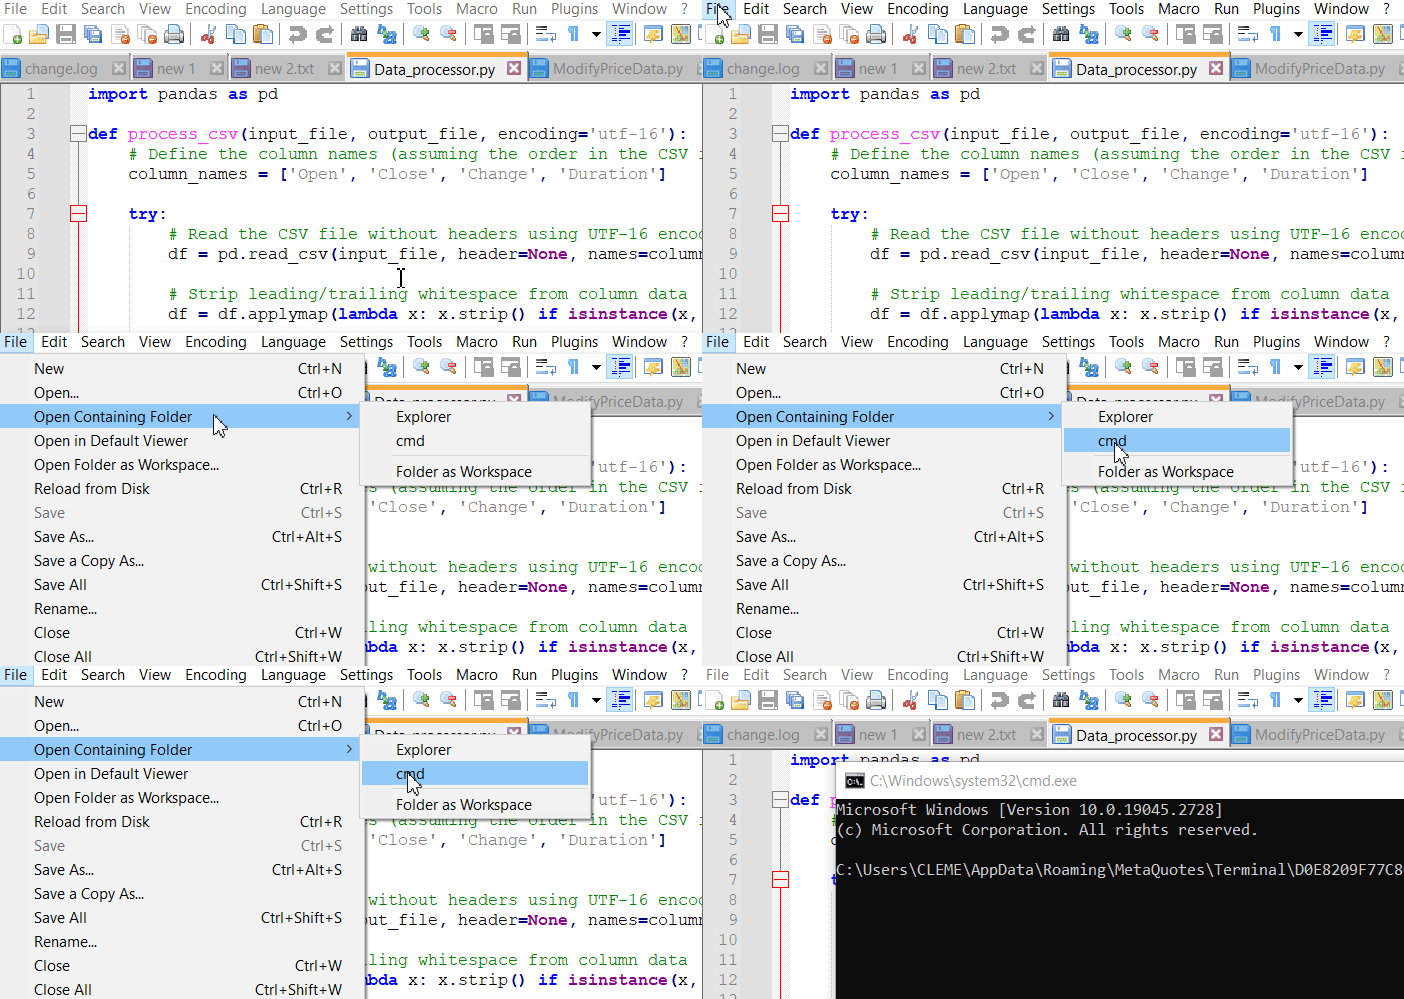
Launching Windows Command prompt from Notepad++
Assuming you have fulfilled the above steps, run the program by executing the following command in the Windows Command Prompt:
python Data_processor.py
This will launch your script, and you will be prompted to specify which file you want to process.
Here is how it appeared for me, with the text highlighted in the Windows Command Prompt

Running the program in Window Command prompt
After successful execution, we have our processed data ready and saved as ProcessedDataFile.csv according to this situation.
Here’s the final presentation of the data:
You can scroll upwards to compare the processed data with the raw data, and a significant difference can be noticed. The processed data has become more informative, allowing for easier analysis and conclusions about the market by examining the columns. We will use the values in the "Change" column as a reference for linear animation in Blender 3D. Explore further in the section below.
Implementation of refined data in Blender 3D:
As explained earlier, we imported our CGI character, Price Man, into Blender 3D. We also imported reference images to use while performing the animation. In animation, we use key frames to mark new values against time. In this case, we used twelve rows of data from the "Change" column. We key framed them as they are, without further processing the data to alter factors like scale. The graph editor in the animation software enables us to see the key points easily during playback. We set the animation to run at 12 frames per second. For further and detailed knowledge about Blender 3D, I recommend using YouTube tutorials.
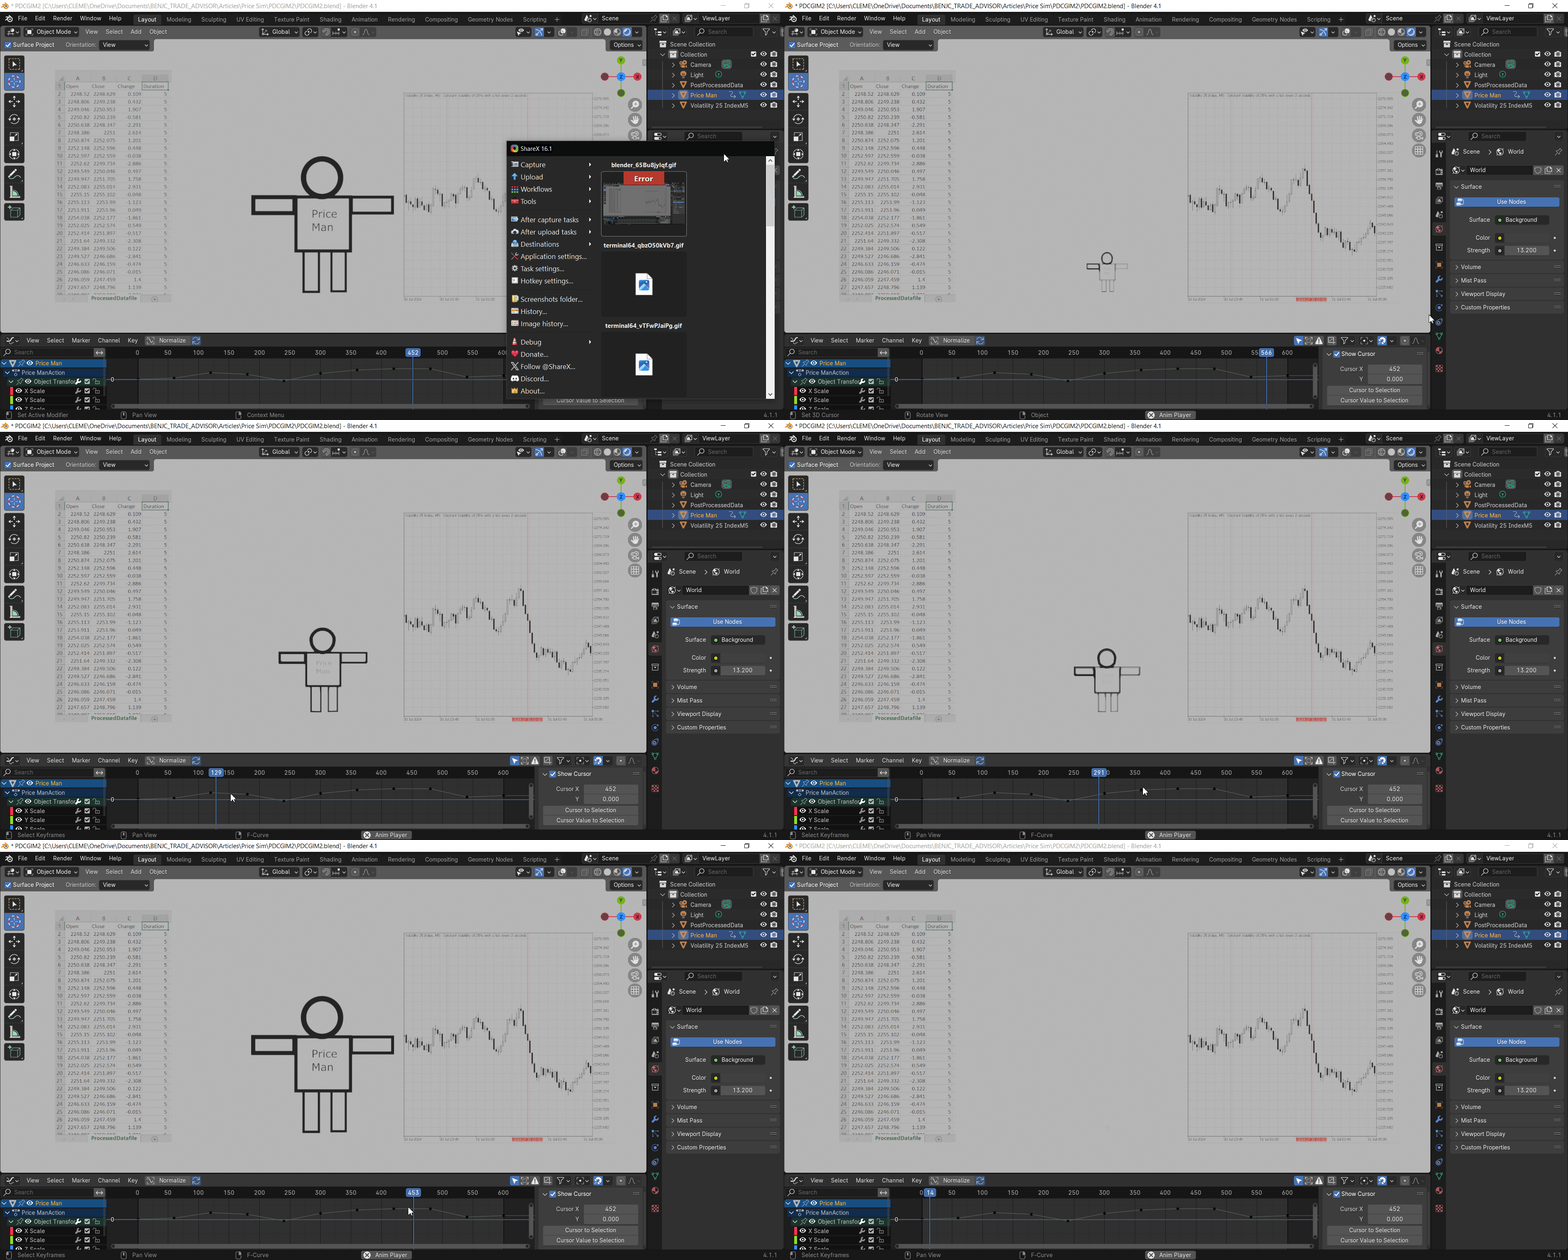
Blender 3D: Price Man Animated Simulation
Conclusion:
In this article, we have successfully explored the entire workflow of creating a Price Driven CGI Model by integrating price data from MetaTrader 5 with advanced post-processing techniques using Python, and then implementing this refined data within Blender 3D. By developing a custom MQL5 script to export price data, we gained greater control over our data manipulation, allowing for enhanced customization in our CGI model.
The implementation of a Python script further streamlined the normalization and processing of data, making it seamlessly compatible with Blender. Through manual adjustments and the use of Blender's image import features, we brought the Price Man character to life, showcasing the potential of merging financial data with artistic visualization.
This project not only demonstrates the innovative use of data-driven approaches in CGI, but also highlights the importance of integrating different software tools to optimize creativity and functionality. As we continue to explore these technologies, the possibilities for creating dynamic and compelling visual representations of data are virtually limitless.
Attached in the table are supporting files you can use for further research. Thank you, and happy developing!| File Name | Description |
|---|---|
| Price Exporter.mq5 | MQL5 script program for exporting customized price data. |
| Price Data_7.csv: | CSV file with raw exported price data from MetaTrader 5. |
| Data_processor.py, | Special data normalization software. |
| ProcessedDatafile.csv | Refined price data file. |
| PDCGIM2.zip | Contains the PDCGIM2.blend with the animation. |
 MQL5 Wizard Techniques you should know (Part 30): Spotlight on Batch-Normalization in Machine Learning
 Developing a Replay System (Part 43): Chart Trader Project (II)
 Neural networks made easy (Part 82): Ordinary Differential Equation models (NeuralODE)
 Integrating MQL5 with data processing packages (Part 1): Advanced Data analysis and Statistical Processing
- Free trading apps
- Over 8,000 signals for copying
- Economic news for exploring financial markets
You agree to website policy and terms of use