
S&P 500交易策略在MQL5中的实现(适合初学者)

引言
本文将讨论如何使用MQL5构建一个智能交易策略,用于交易标普500指数(S&P 500)。我们的讨论将展示如何利用MQL5的灵活性构建一个动态的EA,该EA依赖于人工智能和经典技术分析的结合。我们的观点是,仅依赖人工智能可能会导致不稳定的策略,但通过结合经过时间检验的技术分析原则来指导人工智能,我们可以实现更可靠的方法。这种混合策略旨在揭示MetaTrader 5终端上大量数据中隐藏的模式,利用人工智能、传统分析和MQL5语言的优势,提升交易表现和决策能力。
阅读本文后,您将获得以下内容:
- MQL5的良好编程原则
- 交易者如何轻松分析多个交易品种的大量数据集,使用MQL5 API中的线性代数命令。
- 揭示市场数据中不明显隐藏模式的技术。
历史:什么是标普500?
标普500指数于1957年推出,是反映美国经济整体表现的关键基准。多年来,许多公司被加入或移出该指数,反映了市场的动态性。指数成立以来,通用电气、摩根大通和高盛等公司一直保留在指数中。
标普500代表美国500家最大公司的平均价值。每家公司的价值根据其市值给予权重。因此,标普500也可以被视为全球500家最大上市公司按市值加权的指数。
如今,像特斯拉和英伟达这样的先锋公司重新定义了基准的基础。标普500的大部分权重现在由大型科技公司持有,包括谷歌、苹果和微软等巨头。这些科技巨头改变了指数的格局,反映了经济向技术和创新的转变。
我们的交易策略概述
我们可以在互联网上轻松获取指数中包含的公司列表。我们可以利用对指数构成的理解来帮助我们创建交易策略。我们将选择指数中的一些最大公司,并使用每家公司的价格作为输入,输入到一个AI模型中,该模型将基于我们样本中权重较大的公司来预测指数的收盘价。我们的目标是开发一个结合AI和经过时间检验的技术的策略。
我们的技术分析系统将采用趋势跟踪原则来生成交易信号。我们需要纳入几个关键指标:
- 商品通道指数(CCI)作为我们的成交量指标。我们只希望进入有成交量支持的交易。
- 相对强弱指数(RSI)和威廉百分比范围(WPR),用于衡量市场买卖压力。
- 移动平均线(MA)作为最终确认指标。
商品通道指数(CCI)围绕0波动。读数高于0表明成交量支持买入机会,而低于0则表明成交量支持卖出。我们需要与其他指标对齐以确认交易,从而提高找到高概率设置的机会。
因此,为了买入:
- CCI读数必须大于0。
- RSI读数必须大于50。
- WPR读数必须大于-50。
- MA必须低于收盘价。
反之,为了卖出:
- CCI读数必须小于0。
- RSI读数必须小于50。
- WPR读数必须小于-50。
- MA必须高于收盘价。
另一方面,为了构建我们的AI系统,我们首先需要获取12家大型市值股票的历史价格以及标普500的收盘价。这些将成为我们用于构建多线性回归模型以预测指数未来价格的训练数据。
从数据准备开始,我们将利用普通最小二乘法(OLS)回归来预测标普500的收盘价。
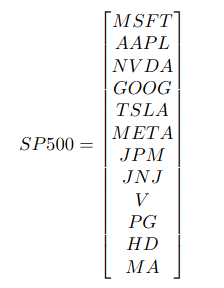
图1:我们的模型将标普500视为这些股票的集合输出。
一旦数据准备就绪,我们可以使用以下公式估计线性回归模型的参数。
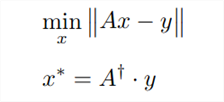
图2:上述公式展示了估计多线性回归模型参数的多种可能方法之一。
“Ax - y”被两条竖线包围,称为向量的L2范数,读作“ell 2”。日常生活中,当我们问一个物体“有多大”时,我们通常会提到它的大小或幅度。同样,当我们问一个向量“有多大”时,我们指的是它的范数。向量本质上是一组数字。虽然有不同类型的范数,但L1范数和L2范数是最常见的。今天,我们将专注于L2范数,它通过计算向量内所有值的平方和的平方根来得出。
在当前上下文中:
- 矩阵“A”代表输入数据,由12只不同股票的收盘价组成。
- 符号“x”表示我们多线性回归模型的系数值,每只股票对应一个系数。
- 乘积“Ax”代表我们基于训练数据对标普500指数未来价格的预测。
- 符号“y”表示我们在训练过程中试图预测的实际收盘价向量。
本质上,第一个方程告诉我们,我们正在寻找使“Ax - y”的L2范数最小化的“x”值。换句话说,我们正在寻找使预测误差最小化的“x”值,以便预测标普500的收盘价。
第二个方程揭示了,可以通过将“A”的伪逆矩阵乘以训练集的输出数据(y)来找到使误差最小化的“x”值。伪逆操作在MQL5中可以方便地实现。
我们可以在MQL5中用几行代码高效地找到伪逆解。
实现:标普500交易策略
让我们开始
首先,我们需要为EA定义输入参数。我们需要输入参数,以便用户可以更改技术指标的周期。
//+------------------------------------------------------------------+
//|                                            SP500 Strategy EA.mq5 |
//|                                  Copyright 2024, MetaQuotes Ltd. |
//|                                             https://www.mql5.com |
//+------------------------------------------------------------------+
#property copyright "Gamuchirai Zororo Ndawana"
#property link      "https://www.mql5.com"
#property version   "1.00"
/*
该应用程序的目标是实施一种交易策略,该策略基于标普500指数(SP500)中按比例持有较大权重的股票样本的表现以及经典的技术分析来交易标普500指数。

我们使用下面的证券:
1)Microsoft
2)Apple
3)Google
4)Meta
5)Visa
6)JPMorgan
7)Nvidia
8)Tesla
9)Johnsons N Johnsons
10)Home Depot
11)Proctor & Gamble
12)Master Card

一个仅仅依赖AI的策略是不可靠的。
我们希望使用一种结合了经过时间检验的交易策略的人工智能(AI)组合。

我们的AI将是一个线性系统,将每只股票的价格映射到指数的收盘价。
请记住,金融时间序列数据可能非常嘈杂。在这种情况下,使用更简单的模型可能会更有益。
我们将尝试使用普通最小二乘法找到线性系数。
我们将使用伪逆解来确定我们的模型参数。

我们的技术分析将基于趋势跟踪原则:
1)进入交易之前,我们必须观察到交易背后有不断增加的成交量。
2)我们希望有两个确认指标,即相对强弱指数(RSI)和威廉百分比范围(WPR),来确认趋势。
3)我们希望价格突破前一周的高点或低点。
4)我们希望价格在我们的移动平均线(MA)之上或之下,然后才会进行交易。

我们的目标是找到统计洞察力和经典技术分析的最佳组合,希望能够构建出一种具有优势的策略。

Gamuchirai Zororo Ndawana
Selebi Phikwe
Botswana
Monday 8 July 2024 21:03
*/
//Inputs
//How far ahead into the future should we forecast?
input int look_ahead = 10;
//Our moving average period
input int ma_period = 120;
//Our RSI period
input int rsi_period = 10;
//Our WPR period
input int wpr_period = 30;
//Our CCI period
input int cci_period = 40;
//How big should our lot sizes be?
int input  lot_multiple = 20;
接下来,我们需要导入交易库,以便管理我们的仓位。
//Libraries
//Trade class
#include <Trade/Trade.mqh>
CTrade Trade;
接着,我们需要定义在整个程序中使用的全局变量。
//Global variables
//Smallest lot size
double minimum_volume;
//Ask
double ask_price;
//Bid
double bid_price;
//How much data should we fetch?
int fetch = 20;
//Determine the starting date for our inputs
int inupt_start;
//Determine the starting date for our outputs
int output_start;
//Which symbols are we going to use to forecast the SP500 close?
string desired_symbols[] = {"MSFT","AAPL","NVDA","GOOG","TSLA","META","JPM","JNJ","V","PG","HD","MA"};
//Define our input matrix
matrix input_matrix = matrix::Ones(fetch,(ArraySize(desired_symbols))-1);
//Define our output matrix, our output matrix has one column
matrix output_matrix = matrix::Ones(fetch,1);
//A vector to store the initial values of each column
vector initiall_input_values = vector::Ones((ArraySize(desired_symbols)));
//A variable to store the initial value of the output
double initiall_output_value = 0.0;
//Defining the matrix that will store our model parameters
matrix b;
//Define our target symbol
string target_symbol = "US_500";
//A vector to temporarily store the historic closing price of each stock
vector symbol_history = vector::Zeros(fetch);
//A flag to let us know when our model is ready
bool model_initialized = false;
//A flag to let us know if the training process has started
bool model_being_trained = false;
//Our model's prediction
double model_forecast = 0;
//Handlers for our technical indicators
int cci_handler,rsi_handler,wpr_handler,ma_handler;
//Buffers for our technical indicator values
double cci_buffer[],rsi_buffer[],wpr_buffer[],ma_buffer[];
既然我们已经进展到这一步,就必须在初始化处理程序中设置我们的技术指标。
//+------------------------------------------------------------------+
//| Expert initialization function                                   |
//+------------------------------------------------------------------+
int OnInit()
  {
//---
//Let's setup our technical indicators
   rsi_handler = iRSI(target_symbol,PERIOD_CURRENT,rsi_period,PRICE_CLOSE);
   ma_handler = iMA(target_symbol,PERIOD_CURRENT,ma_period,0,MODE_EMA,PRICE_CLOSE);
   wpr_handler = iWPR(target_symbol,PERIOD_CURRENT,wpr_period);
   cci_handler = iCCI(target_symbol,PERIOD_CURRENT,cci_period,PRICE_CLOSE);
//Get market data
   minimum_volume = SymbolInfoDouble(_Symbol,SYMBOL_VOLUME_MIN);
//---
   return(INIT_SUCCEEDED);
  }
我们需要一些辅助函数。首先,我们定义一个用于初始化多线性回归模型的过程。我们的拟合过程从设置一个标志开始,以表明我们的模型正在接受训练。其他函数则负责执行诸如获取训练数据和拟合模型等任务。通过将代码分解为更小的函数,我们可以避免重复编写相同的代码行。
//+------------------------------------------------------------------+
//This function defines the procedure for fitting our model
void model_initialize(void)
  {
   /*
   我们的函数将按照以下步骤运行初始化过程:
   1)更新训练标志,以表明模型已经完成训练。
   2)获取必要的输入和输出数据。
   3)对数据进行预处理,包括归一化和缩放等操作。
   4)拟合模型。
   5)更新标志,以表明模型已经完成训练。
   从那以后,我们的应用程序将具备开始交易的能力。
   */
//First let us set our flag to denote that the model is being trained
   model_being_trained = true;
//Defining the input start time and the output start time
//Remember the input data should not contain the most recent bars
//The most recent bars must only be included in the output start time
//The input data should be older than the output data.
   inupt_start = 1+look_ahead;
   output_start = 1;
//Fetch the input data
   fetch_input_data(inupt_start,fetch);
//Fetch the output data
   fetch_output_data(output_start,fetch);
//Prepare the data
   prepare_data(0);
//Fit our model
   fit_linear_model();
//The model is ready
   model_ready();
  }
接下来,我们定义负责获取输入数据的函数。我们的输入矩阵将在第一列包含一列全为1的值,以表示截距点,或者当所有股票价格为零时标普500的平均收盘价。尽管在金融领域,这种情况毫无意义,因为如果所有股票价格都为零,标普500的收盘价也将为零。
撇开这一点不谈,我们获取输入数据的程序非常直接:
- 初始化一个全为1的输入矩阵。
- 重塑矩阵
- 从第二列开始填入每只股票的收盘价
- 确保第一列全为1。
//This function will get our input data ready
void fetch_input_data(int f_input_start,int f_fetch)
  {
   /*
       为了准备好输入数据,我们将遍历可用的符号,并将请求的数据量复制到全局作用域的输入矩阵中。
      我们的函数参数包括:
      1)f_input_start:这是我们获取输入数据的起始位置。对于当前数据,传递0并仅获取1条数据。
      2)f_fetch: 这是应该获取并复制到输入矩阵中的数据量。
   */
   Print("Preparing to fetch input data");
//Let's observe the original state of our input matrix
   Print("We will reset the input matrix before fetching the data we need: ");
   input_matrix = matrix::Ones(f_fetch,(ArraySize(desired_symbols))-1);
   Print(input_matrix);
//We need to reshape our matrix
   input_matrix.Reshape(f_fetch,13);
//Filling the input matrix
//Then we need to prepare our input matrix.
//The first column must be full of 1's because it represents the intercept.
//Therefore we will skip 0, and start filling input values from column 1. This is not a mistake.
   for(int i=1; i <= ArraySize(desired_symbols);i++)
     {
      //Copy the input data we need
      symbol_history.CopyRates(desired_symbols[i-1],PERIOD_CURRENT,COPY_RATES_CLOSE,f_input_start,f_fetch);
      //Insert the input data into our input matrix
      input_matrix.Col(symbol_history,i);
     }
//Ensure that the first column is full of ones for our intercept
   vector intercept = vector::Ones(f_fetch);
   input_matrix.Col(intercept,0);
//Let us see what our input matrix looks like now.
   Print("Final state of our input matrix: ");
   Print(input_matrix);
  }
我们获取输出数据的程序将与获取输入数据的程序大致相同。
//This function will get our output data ready
void fetch_output_data(int f_output_start, int f_fetch)
  {
   /*
       这个函数将获取用于训练我们模型的输出数据,并将其复制到我们全局定义的输出矩阵中。模型只有两个参数:
      1)f_output_start:我们应该从哪里开始复制输出数据
      2)f_fetch:需要复制的数据量
   */
   Print("Preparing to fetch output data");
//Let's observe the original state of our output matrix
   Print("Ressetting output matrix before fetching the data we need: ");
//Reset the output matrix
   output_matrix = matrix::Ones(f_fetch,1);
   Print(output_matrix);
//We need to reshape our matrix
   output_matrix.Reshape(f_fetch,1);
//Output data
//Copy the output data we need
   symbol_history.CopyRates(target_symbol,PERIOD_CURRENT,COPY_RATES_CLOSE,f_output_start,f_fetch);
//Insert the output data into our input matrix
   output_matrix.Col(symbol_history,0);
//Let us see what our input matrix looks like now.
   Print("Final state of our output matrix: ");
   Print(output_matrix);
  }
在拟合我们的模型之前,我们需要对数据进行标准化和缩放。这是很重要的一步,因为它能让我们的应用程序更容易地学习到变化率中隐藏的关系。
请注意,我们的拟合过程分为两个不同的阶段。在第一阶段,也就是模型首次被训练时,我们需要将用于缩放每一列的值存储在一个向量中。每一列都将被其第一个值除,这意味着每一列的第一个值将是1。
从那以后,如果我们观察到某一列中的任何值小于1,那么价格就下跌了;而大于1的值则表明价格上升了。如果我们观察到一个0.72的读数,那么价格就下跌了28%;如果我们观察到一个1.017的值,那么价格就上涨了1.7%。
我们只应该存储每一列的初始值一次,从那以后,所有未来的输入都应该被相同的量除,以确保一致性。
//This function will normalize our input data so that our model can learn better
//We will also scale our output so that it shows the growth in price
void prepare_data(int f_flag)
  {
   /*
      这个函数负责对我们的输入和输出进行归一化。
     我们首先需要存储每一列的初始值。
      然后我们将每一列都除以其第一个值,以便使每一列的第一个值为1。
     上述步骤仅在模型初始化时执行一次。所有后续的输入将直接除以该列的初始值。
   */

   Print("Normalizing and scaling the data");
//This part of the procedure should only be performed once
   if(f_flag == 0)
     {
      Print("Preparing to normalize the data for training the model");
      //Normalizing the inputs
      //Store the initial value of each column
      for(int i=0;i<ArraySize(desired_symbols);i++)
        {
         //First we store the initial value of each column
         initiall_input_values[i] = input_matrix[0][i+1];
         //Now temporarily copy the column, so that we can normalize the entire column at once
         vector temp_vector = input_matrix.Col(i+1);
         //Now divide that entire column by its initial value, if done correctly the first value of each column should be 1
         temp_vector = temp_vector / initiall_input_values[i];
         //Now reinsert the normalized column
         input_matrix.Col(temp_vector,i+1);
        }
      //Print the initial input values
      Print("Our initial input values for each column ");
      Print(initiall_input_values);

      //Scale the output
      //Store the initial output value
      initiall_output_value = output_matrix[0][0];
      //Make a temporary copy of the entire output column
      vector temp_vector_output = output_matrix.Col(0);
      //Divide the entire column by its initial value, so that the first value in the column is one
      //This means that any time the value is less than 1, price fell
      //And every time the value is greater than 1, price rose.
      //A value of 1.023... means price increased by 2.3%
      //A value of 0.8732.. would mean price fell by 22.67%
      temp_vector_output = temp_vector_output / initiall_output_value;
      //Reinsert the column back into the output matrix
      output_matrix.Col(temp_vector_output,0);
      //Shpw the scaled data
      Print("Data has been normlised and the output has been scaled:");
      Print("Input matrix: ");
      Print(input_matrix);
      Print("Output matrix: ");
      Print(output_matrix);
     }

//Normalize the data using the initial values we have allready calculated
   if(f_flag == 1)
     {
      //Divide each of the input values by its corresponding input value
      Print("Preparing to normalize the data for prediction");
      for(int i = 0; i < ArraySize(desired_symbols);i++)
        {
         input_matrix[0][i+1] = input_matrix[0][i+1]/initiall_input_values[i];
        }
      Print("Input data being used for prediction");
      Print(input_matrix);
     }
  }
接下来,我们需要定义一个函数,设置必要的标志条件,以便让我们的应用程序开始交易。
//This function will allow our program to switch states and begin forecasting and looking for trades
void model_ready(void)
  {
//Our model is ready.
//We need to switch these flags to give the system access to trading functionality
   Print("Giving the system permission to begin trading");
   model_initialized = true;
   model_being_trained = false;
  }
为了从我们的EA中获得预测,我们首先需要获取最新的可用数据,对数据进行预处理,然后使用线性回归方程从我们的模型中获得预测结果。
//This function will obtain a prediction from our model
double model_predict(void)
  {
//First we have to fetch current market data
   Print("Obtaining a forecast from our model");
   fetch_input_data(0,1);
//Now we need to normalize our data using the values we calculated when we initialized the model
   prepare_data(1);
//Now we can return our model's forecast
   return((b[0][0] +
           (b[1][0]*input_matrix[0][0]) +
           (b[2][0]*input_matrix[0][1]) +
           (b[3][0]*input_matrix[0][2]) +
           (b[4][0]*input_matrix[0][3]) +
           (b[5][0]*input_matrix[0][4]) +
           (b[6][0]*input_matrix[0][5]) +
           (b[7][0]*input_matrix[0][6]) +
           (b[8][0]*input_matrix[0][7]) +
           (b[9][0]*input_matrix[0][8]) +
           (b[10][0]*input_matrix[0][9]) +
           (b[11][0]*input_matrix[0][10])+
           (b[12][0]*input_matrix[0][11])));
  }
我们需要实现一个用于拟合线性模型的过程,使用我们在上面定义和解释的方程。请注意,我们的MQL5 API为我们提供了执行线性代数命令的灵活性和易用性,我们可以轻松地将操作链式组合在一起,从而使我们的产品性能更高。
这一点尤其重要,如果你想在市场上销售你的产品,尽量避免使用for循环,而改用向量运算,因为向量运算比循环更快。最终用户将体验到一个响应迅速且不卡顿的应用程序,他们会因此而享受使用体验。
//This function will fit our linear model using the pseudo inverse solution
void fit_linear_model(void)
  {
   /*
      伪逆解通过最小化误差(残差平方和,RSS)来找到一组值,将我们的训练数据输入映射到输出。
     这些系数值可以通过线性代数轻松估算,但这些系数仅能最小化我们在训练数据上的误差,而不是在未见过的数据上!
   */
   Print("Attempting to find OLS solutions.");
//Now we can estimate our model parameters
   b = input_matrix.PInv().MatMul(output_matrix);
//Let's see our model parameters
   Print("Our model parameters ");
   Print(b);
  }
继续进行下去,我们需要一个负责更新我们的技术指标并获取当前市场数据的函数。
//Update our technical indicator values
void update_technical_indicators()
  {
//Get market data
   ask_price = SymbolInfoDouble(_Symbol,SYMBOL_ASK);
   bid_price = SymbolInfoDouble(_Symbol,SYMBOL_BID);
//Copy indicator buffers
   CopyBuffer(rsi_handler,0,0,10,rsi_buffer);
   CopyBuffer(cci_handler,0,0,10,cci_buffer);
   CopyBuffer(wpr_handler,0,0,10,wpr_buffer);
   CopyBuffer(ma_handler,0,0,10,ma_buffer);
//Set the arrays as series
   ArraySetAsSeries(rsi_buffer,true);
   ArraySetAsSeries(cci_buffer,true);
   ArraySetAsSeries(wpr_buffer,true);
   ArraySetAsSeries(ma_buffer,true);
  }
接下来,我们将编写一个为我们执行交易设置的函数。我们的函数只有在两个系统都对齐的情况下才能执行交易。
//Let's try find an entry signal
void find_entry(void)
  {
//Our sell setup
   if(bearish_sentiment())
     {
      Trade.Sell(minimum_volume * lot_multiple,_Symbol,bid_price);
     }
//Our buy setup
   else
      if(bullish_sentiment())
        {
         Trade.Buy(minimum_volume * lot_multiple,_Symbol,ask_price);
        }
  }
这之所以能够实现,是因为我们有根据上述描述定义看跌情绪的函数。
//This function tells us if all our tools align for a sell setup
bool bearish_sentiment(void)
  {
   /*
      For a sell setup, we want the following conditions to be satisfied:
      1) CCI reading should be less than 0
      2) RSI reading should be less than 50
      3) WPR reading should be less than -50
      4) Our model forecast should be less than 1
      5) MA reading should be below the moving average
   */
   return((iClose(target_symbol,PERIOD_CURRENT,0) < ma_buffer[0]) &&
          (cci_buffer[0] < 0) &&
          (rsi_buffer[0] < 50) &&
          (wpr_buffer[0] < -50) &&
          (model_forecast < 1));
  }
同样地,这对我们定义看涨情绪的函数也是一样的。
//This function tells us if all our tools align for a buy setup
bool bullish_sentiment(void)
  {
   /*
      For a sell setup, we want the following conditions to be satisfied:
      1) CCI reading should be greater than 0
      2) RSI reading should be greater than 50
      3) WPR reading should be greater than -50
      4) Our model forecast should be greater than 1
      5) MA reading should be above the moving average
   */
   return((iClose(target_symbol,PERIOD_CURRENT,0) > ma_buffer[0]) &&
          (cci_buffer[0] > 0) &&
          (rsi_buffer[0] > 50) &&
          (wpr_buffer[0] > -50) &&
          (model_forecast > 1));
  }
最后,我们需要一个辅助函数来更新我们的止损和止盈值。
//+----------------------------------------------------------------------+
//|This function is responsible for calculating our SL & TP values       |
//+----------------------------------------------------------------------+
void update_stoploss(void)
  {

//First we iterate over the total number of open positions
   for(int i = PositionsTotal() -1; i >= 0; i--)
     {

      //Then we fetch the name of the symbol of the open position
      string symbol = PositionGetSymbol(i);

      //Before going any furhter we need to ensure that the symbol of the position matches the symbol we're trading
      if(_Symbol == symbol)
        {
         //Now we get information about the position
         ulong ticket = PositionGetInteger(POSITION_TICKET); //Position Ticket
         double position_price = PositionGetDouble(POSITION_PRICE_OPEN); //Position Open Price
         long type = PositionGetInteger(POSITION_TYPE); //Position Type
         double current_stop_loss = PositionGetDouble(POSITION_SL); //Current Stop loss value

         //If the position is a buy
         if(type == POSITION_TYPE_BUY)
           {

            //The new stop loss value is just the ask price minus the ATR stop we calculated above
            double atr_stop_loss = NormalizeDouble(ask_price - ((min_distance * sl_width)/2),_Digits);
            //The new take profit is just the ask price plus the ATR stop we calculated above
            double atr_take_profit = NormalizeDouble(ask_price + (min_distance * sl_width),_Digits);

            //If our current stop loss is less than our calculated ATR stop loss
            //Or if our current stop loss is 0 then we will modify the stop loss and take profit
            if((current_stop_loss < atr_stop_loss) || (current_stop_loss == 0))
              {
               Trade.PositionModify(ticket,atr_stop_loss,atr_take_profit);
              }
           }

         //If the position is a sell
         else
            if(type == POSITION_TYPE_SELL)
              {
               //The new stop loss value is just the ask price minus the ATR stop we calculated above
               double atr_stop_loss = NormalizeDouble(bid_price + ((min_distance * sl_width)/2),_Digits);
               //The new take profit is just the ask price plus the ATR stop we calculated above
               double atr_take_profit = NormalizeDouble(bid_price - (min_distance * sl_width),_Digits);

               //If our current stop loss is greater than our calculated ATR stop loss
               //Or if our current stop loss is 0 then we will modify the stop loss and take profit
               if((current_stop_loss > atr_stop_loss) || (current_stop_loss == 0))
                 {
                  Trade.PositionModify(ticket,atr_stop_loss,atr_take_profit);
                 }
              }
        }
     }
我们所有的辅助函数都将在适当的时候由OnTick事件处理器调用,该处理器负责在价格发生变化时控制我们终端内的事件流程。
void OnTick()
  {
//Our model must be initialized before we can begin trading.
   switch(model_initialized)
     {
      //Our model is ready
      case(true):
         //Update the technical indicator values
         update_technical_indicators();
         //If we have no open positions, let's make a forecast using our model
         if(PositionsTotal() == 0)
           {
            //Let's obtain a prediction from our model
            model_forecast = model_predict();
            //Now that we have sentiment from our model let's try find an entry
            find_entry();
            Comment("Model forecast: ",model_forecast);
           }

         //If we have an open position, we need to manage it
         if(PositionsTotal() > 0)
           {
            //Update our stop loss
            update_stoploss();
           }
         break;

      //Default case
      //Our model is not yet ready.
      default:
         //If our model is not being trained, train it.
         if(!model_being_trained)
           {
            Print("Our model is not ready. Starting the training procedure");
            model_initialize();
           }
         break;
     }

  }

图3:运行我们的程序
限制
我们选择的AI建模方法存在一些限制,让我们来重点介绍其中一些重要的限制:
1.1相关输入
相关输入所导致的问题并非线性模型独有,这一问题影响着许多机器学习模型。在我们的输入矩阵中,有些股票属于同一行业,它们的价格往往同时上涨或下跌。这使得我们的模型难以区分每只股票对标普500指数表现的影响,因为股票价格的波动可能会相互掩盖。
1.2非线性目标函数
金融数据集本身具有噪声,通常更适合使用简单的模型,例如多线性回归。然而,在大多数现实情况中,实际被近似的函数几乎从不是线性的。因此,真实函数与线性之间的差距越大,模型的准确性就越会表现出较大的方差。
1.3直接建模方法的限制
最后,如果我们把标普500中列出的每一只股票都包含在我们的模型中,我们将得到一个包含500个参数的模型。优化这样一个模型将需要大量的计算资源,而且解释其结果也会面临挑战。在这种情况下,直接建模方法并不优雅;随着我们未来添加更多股票,需要优化的参数数量可能会迅速变得难以管理。
结论
在本文中,我们展示了如何轻松地开始构建结合技术分析的AI模型,以做出明智的交易决策。随着我们转向更高级的模型,今天涵盖的大部分步骤将保持不变。这应该给初学者带来信心,让他们知道自己已经完成了一个从头到尾的机器学习项目,并且希望理解了每个决策背后的逻辑。
我们的整个应用程序使用原生的MQL5代码,并利用每个MetaTrader 5安装中都有的标准技术指标。我们希望这篇文章能激发你进一步探索现有工具的可能性,并继续在掌握MQL5的道路上不断进步。
本文由MetaQuotes Ltd译自英文
原文地址: https://www.mql5.com/en/articles/14815