
初心者のためのMQL5によるSP500取引戦略

はじめに
この記事では、MQL5を使用してスタンダード&プアーズ500(S&P 500)指数を取引するためのインテリジェントな戦略を構築する方法を解説します。MQL5の柔軟性を活かし、人工知能(AI)とテクニカル分析を組み合わせたダイナミックなエキスパートアドバイザー(EA)の構築方法を紹介します。私たちの理論的根拠は、AIだけに頼ると戦略が不安定になる可能性があるという点です。しかし、テクニカル分析の実績ある原則でAIを誘導することで、より信頼性の高いアプローチを実現できます。このハイブリッド戦略は、MetaTrader 5端末で利用可能な膨大なデータの中に隠れたパターンを発見し、AI、伝統的な分析、MQL5言語の強みを活かして取引パフォーマンスと意思決定を強化することを目指しています。
この記事を読むことで、次の内容を習得できます。
- MQL5の優れたプログラミング原則
- MQL5 APIの線形代数コマンドを使ってトレーダーが複数の銘柄から同時に大規模なデータセットを簡単に分析する方法
- 市場データからすぐにはわからない隠れたパターンを発見するテクニック
履歴:スタンダード・アンド・プアーズ500種指数とは?
1957年に導入されたS&P500は、米国経済の幅広いパフォーマンスを反映する重要なベンチマークです。市場のダイナミックな性質を反映し、多くの企業がインデックスに加わったり外されたりしてきました。ゼネラル・エレクトリック、J.P.モルガン、ゴールドマン・サックスなど、創設以来そのポジションを維持している企業も存在します。
S&P500は、米国の大企業500社の平均値を表しており、その価値は時価総額に基づいて加重されています。これにより、S&P500は世界最大の株式公開企業500社の時価総額加重指数ともいえます。
最近では、テスラやNvidiaなどの先駆的企業がベンチマークを再定義し、グーグル、アップル、マイクロソフトなどの大手テクノロジー企業が指数の大半を占めるようになっています。これらのハイテク企業は、経済のテクノロジーとイノベーションへのシフトを反映し、インデックスの風景を一変させました。
取引戦略の概要
インデックスに含まれる企業のリストはインターネットで容易に入手可能です。インデックスの構成を理解することで、取引戦略の立案に役立てることができます。例えば、インデックス内で最大の企業を数社選び、その株価をAIモデルへの入力として使用し、これらの企業が指数に与える影響を基に終値を予測します。この戦略では、AIと信頼性の高いテクニカル分析を組み合わせてより安定した結果を目指します。
私たちのテクニカル分析システムは、トレンドフォローの原則に基づき、売買シグナルを生成します。以下の重要な指標を取り入れる必要があります。
- コモディティチャネルインデックス(Commodity Channel Index: CCI):出来高指標として使用し、出来高に裏打ちされた取引にのみエントリします。
- 相対力指数(Relative Strength Index: RSI)とウィリアムズ・パーセンテージ・レン(Williams Percent Range: WPR):市場の買い圧力や売り圧力を測ります。
- 移動平均線(MA):最終的な確認指標とします。
CCIは0を基準として展開され、0を上回ると買いシグナル、0を下回ると売りシグナルとなります。取引の確認には他の指標との整合性が重要で、これにより高確率のセットアップを見つけやすくなります。
買いエントリには次の条件が必要です。
- CCI値が0より大きい
- RSI値が50より大きい
- WPR値が-50より大きい
- MAが終値より小さい
逆に、売りエントリには以下の条件が必要です。
- CCI値が0より小さい
- RSI値が50より小さい
- WPR値が-50より小さい
- MAが終値より大きい
一方、AIシステムを構築するためには、まずS&P500に含まれる時価総額上位12銘柄の過去の株価データとS&P500の終値データを取得します。これらのデータは、指数の将来価格を予測するための重回帰モデルを構築するために使用され、訓練データとなります。
そこから、AIシステムは、通常の最小二乗回帰を用いてS&P500の終値を予測します。

図1:モデルはS&P500をこれらの銘柄の集合体の出力と見なす
データの準備が整ったら、次の式を用いて線形回帰モデルのパラメータを推定します。
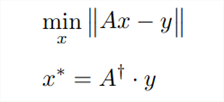
図2:重回帰モデルのパラメータを推定する多くの可能な方法の1つを示す式
2本の縦線で囲まれた「Ax - y」という表現は、ベクトルのL2ノルムとして知られており、「エル2」と発音されます。日常会話では、物理的な物体について「どのくらい大きいか」と尋ねるとき、そのサイズや大きさについて話します。同様に、あるベクトルがどのくらいの大きさかを問うときは、そのノルムを参照します。ベクトルは基本的に数値のリストです。規範にはさまざまな種類がありますが、L1ノルムとL2ノルムが最も一般的です。ここではL2ノルムに注目します。L2ノルムはベクトル内の値の二乗和の平方根として計算されます。
この文脈では
- 行列Aは12銘柄の終値で構成される入力データを表します。
- 記号xは重回帰モデルの係数を示し、1銘柄につき1つの係数を示します。
- 積Axは、学習データに基づくS&P500指数の将来価格の予測を表します。
- yは、訓練中に予測しようとした実際の終値のベクトルを象徴しています。
要するに、最初の式は、Ax - yのL2ノルムを最小にするxの値を探していることを示しています。言い換えれば、S&P500の終値を予測する際に、予測誤差を最小化するxの値を求めているのです。
2つ目の式は、誤差を最小にするxの値は、Aの擬似逆行列を訓練セットの出力データ (y) に掛けることで得られることを示しています。擬似逆行列の計算は、MQL5で効率的に実装できます。
MQL5では、わずか数行のコードで擬似逆解を効率的に求めることが可能です。
実装:SP500取引戦略
はじめに
まず、EAの入力を定義する必要があります。これには、テクニカル指標の期間を調整するための入力パラメータが含まれます。
//+------------------------------------------------------------------+
//|                                            SP500 Strategy EA.mq5 |
//|                                  Copyright 2024, MetaQuotes Ltd. |
//|                                             https://www.mql5.com |
//+------------------------------------------------------------------+
#property copyright "Gamuchirai Zororo Ndawana"
#property link      "https://www.mql5.com"
#property version   "1.00"
/*
The goal of this application is to implement a strategy to trade the SP500 based
on the performance of a sample of stocks that hold proportionally large weights in the index and classical technical analysis.

We will use the following stocks:
1)Microsoft
2)Apple
3)Google
4)Meta
5)Visa
6)JPMorgan
7)Nvidia
8)Tesla
9)Johnsons N Johnsons
10)Home Depot
11)Proctor & Gamble
12)Master Card

A strategy that relies solely on AI  may prove to be unstable.
We want to use a combination of AI guided by trading strategies that have been trusted over time.

Our AI will be a linear system mapping the price of each stock to the closing price of the index.
Recall that financial time series data can be very noisy. Using simpler models may be beneficial.
We will attempt to find linear coefficients using ordinary least squares.
We will use the pseudo inverse solution to find our model parameters.

Our technical analysis will be based on trend following principles:
1)We must observe increasing volume backing a trade before we enter.
2)We want 2 confirmation indicators, RSI and WPR, confirming the trend.
3)We want price to break above the previous week high or low.
4)We want price above or below our MA before we trade.

Our goal is to find an optimal combination of statistical insight,
and classical technical analysis to hopefully build a strategy with an edge.

Gamuchirai Zororo Ndawana
Selebi Phikwe
Botswana
Monday 8 July 2024 21:03
*/
//Inputs
//How far ahead into the future should we forecast?
input int look_ahead = 10;
//Our moving average period
input int ma_period = 120;
//Our RSI period
input int rsi_period = 10;
//Our WPR period
input int wpr_period = 30;
//Our CCI period
input int cci_period = 40;
//How big should our lot sizes be?
int input  lot_multiple = 20;
次に、ポジションを管理できるように、取引ライブラリをインポートします。
//Libraries
//Trade class
#include <Trade/Trade.mqh>
CTrade Trade;
次に、プログラム全体で使用するグローバル変数を定義します。
//Global variables
//Smallest lot size
double minimum_volume;
//Ask
double ask_price;
//Bid
double bid_price;
//How much data should we fetch?
int fetch = 20;
//Determine the starting date for our inputs
int inupt_start;
//Determine the starting date for our outputs
int output_start;
//Which symbols are we going to use to forecast the SP500 close?
string desired_symbols[] = {"MSFT","AAPL","NVDA","GOOG","TSLA","META","JPM","JNJ","V","PG","HD","MA"};
//Define our input matrix
matrix input_matrix = matrix::Ones(fetch,(ArraySize(desired_symbols))-1);
//Define our output matrix, our output matrix has one column
matrix output_matrix = matrix::Ones(fetch,1);
//A vector to store the initial values of each column
vector initiall_input_values = vector::Ones((ArraySize(desired_symbols)));
//A variable to store the initial value of the output
double initiall_output_value = 0.0;
//Defining the matrix that will store our model parameters
matrix b;
//Define our target symbol
string target_symbol = "US_500";
//A vector to temporarily store the historic closing price of each stock
vector symbol_history = vector::Zeros(fetch);
//A flag to let us know when our model is ready
bool model_initialized = false;
//A flag to let us know if the training process has started
bool model_being_trained = false;
//Our model's prediction
double model_forecast = 0;
//Handlers for our technical indicators
int cci_handler,rsi_handler,wpr_handler,ma_handler;
//Buffers for our technical indicator values
double cci_buffer[],rsi_buffer[],wpr_buffer[],ma_buffer[];
ここまで来たら、初期化ハンドラでテクニカル指標を設定します。
//+------------------------------------------------------------------+
//| Expert initialization function                                   |
//+------------------------------------------------------------------+
int OnInit()
  {
//---
//Let's setup our technical indicators
   rsi_handler = iRSI(target_symbol,PERIOD_CURRENT,rsi_period,PRICE_CLOSE);
   ma_handler = iMA(target_symbol,PERIOD_CURRENT,ma_period,0,MODE_EMA,PRICE_CLOSE);
   wpr_handler = iWPR(target_symbol,PERIOD_CURRENT,wpr_period);
   cci_handler = iCCI(target_symbol,PERIOD_CURRENT,cci_period,PRICE_CLOSE);
//Get market data
   minimum_volume = SymbolInfoDouble(_Symbol,SYMBOL_VOLUME_MIN);
//---
   return(INIT_SUCCEEDED);
  }
ヘルパー関数が必要です。最初に、重回帰モデルを初期化する手順を定義します。このフィッティング手順ではまず、モデルが訓練中であることを示すフラグを設定します。その他の関数は、訓練データの取得やモデルのフィッティングなどのタスクを処理します。コードを小さな関数に分割することで、同じ行を何度も書くことを避けることができます。
//+------------------------------------------------------------------+
//This function defines the procedure for fitting our model
void model_initialize(void)
  {
   /*
   Our function will run the initialization procedure as follows:
   1)Update the training flag to show that the model has been trained
   2)Fetch the necessary input and output data
   3)Preprocess the data, normalization and scaling etc.
   4)Fit the model
   5)Update the flags to show that the model has been trained.
   From there our application will have the ability to begin trading.
   */
//First let us set our flag to denote that the model is being trained
   model_being_trained = true;
//Defining the input start time and the output start time
//Remember the input data should not contain the most recent bars
//The most recent bars must only be included in the output start time
//The input data should be older than the output data.
   inupt_start = 1+look_ahead;
   output_start = 1;
//Fetch the input data
   fetch_input_data(inupt_start,fetch);
//Fetch the output data
   fetch_output_data(output_start,fetch);
//Prepare the data
   prepare_data(0);
//Fit our model
   fit_linear_model();
//The model is ready
   model_ready();
  }
次に、入力データの取得を担当する関数を定義します。入力行列の最初の列には、インターセプトポイントまたはすべての株価がゼロのときのS&P 500の終値平均を表す1の列が含まれます。このシナリオは金融の世界では意味をなしません。もしすべての株価が0であれば、S&P500の終値も0になってしまうからです。
それはさておき、入力データを取得する手順は簡単です。
- 入力行列を 1 で初期化します。
- マトリックスを変形します。
- 各銘柄の終値を2列目から記入します。
- 最初の列が1で埋まっていることを確認します。
//This function will get our input data ready
void fetch_input_data(int f_input_start,int f_fetch)
  {
   /*
      To get the input data ready we will to cycle through the symbols available and copy the requested
      amount of data to the globally scoped input matrix.
      Our function parameters are:
      1)f_input_start: this is where we should get our input data, for the current data pass 0 and only fetch 1.
      2)f_fetch: this is how much data should be fetched and copied into the input matrix.
   */
   Print("Preparing to fetch input data");
//Let's observe the original state of our input matrix
   Print("We will reset the input matrix before fetching the data we need: ");
   input_matrix = matrix::Ones(f_fetch,(ArraySize(desired_symbols))-1);
   Print(input_matrix);
//We need to reshape our matrix
   input_matrix.Reshape(f_fetch,13);
//Filling the input matrix
//Then we need to prepare our input matrix.
//The first column must be full of 1's because it represents the intercept.
//Therefore we will skip 0, and start filling input values from column 1. This is not a mistake.
   for(int i=1; i <= ArraySize(desired_symbols);i++)
     {
      //Copy the input data we need
      symbol_history.CopyRates(desired_symbols[i-1],PERIOD_CURRENT,COPY_RATES_CLOSE,f_input_start,f_fetch);
      //Insert the input data into our input matrix
      input_matrix.Col(symbol_history,i);
     }
//Ensure that the first column is full of ones for our intercept
   vector intercept = vector::Ones(f_fetch);
   input_matrix.Col(intercept,0);
//Let us see what our input matrix looks like now.
   Print("Final state of our input matrix: ");
   Print(input_matrix);
  }
出力データを取得する手順は、入力データを取得する手順とほぼ同じです。
//This function will get our output data ready
void fetch_output_data(int f_output_start, int f_fetch)
  {
   /*
      This function will fetch our output data for training our model and copy it into
      our globally defined output matrix. The model has only 2 parameters:
      1)f_output_start: where should we start copying our output data
      2)f_fetch: amount of data to copy
   */
   Print("Preparing to fetch output data");
//Let's observe the original state of our output matrix
   Print("Ressetting output matrix before fetching the data we need: ");
//Reset the output matrix
   output_matrix = matrix::Ones(f_fetch,1);
   Print(output_matrix);
//We need to reshape our matrix
   output_matrix.Reshape(f_fetch,1);
//Output data
//Copy the output data we need
   symbol_history.CopyRates(target_symbol,PERIOD_CURRENT,COPY_RATES_CLOSE,f_output_start,f_fetch);
//Insert the output data into our input matrix
   output_matrix.Col(symbol_history,0);
//Let us see what our input matrix looks like now.
   Print("Final state of our output matrix: ");
   Print(output_matrix);
  }
モデルを当てはめる前に、データを標準化し、スケーリングする必要があります。これは重要なステップで、変化率に隠された関係をアプリケーションで学習しやすくするためです。
フィッティング手順には2つの異なる段階があります。モデルが初めて訓練されるフェーズ1では、各列のスケーリングに使用した値をベクトルに格納する必要があります。各列はその中の最初の値で分割されます。つまり、すべての列の最初の値は1になります。
それ以降、その列で1より小さい値が観測された場合、価格は下落し、1より大きい値は価格が上昇したことを示します。0.72の数値が観測された場合、価格は28%下落し、1.017の数値が観測された場合、価格は1.7%上昇したことになります。
各列の初期値は一度だけ保存し、それ以降は一貫性を確保するために、将来の入力はすべて同じ値で割らなければなりません。
//This function will normalize our input data so that our model can learn better
//We will also scale our output so that it shows the growth in price
void prepare_data(int f_flag)
  {
   /*
      This function is responsible for normalizing our inputs and outputs.
      We want to first store the initial value of each column.
      Then we will divide each column by its first value, so that the first value in each column is one.
      The above steps are performed only once, when the model is initialized. All subsequent inputs will
      simply be divided by the initial values of that column.
   */

   Print("Normalizing and scaling the data");
//This part of the procedure should only be performed once
   if(f_flag == 0)
     {
      Print("Preparing to normalize the data for training the model");
      //Normalizing the inputs
      //Store the initial value of each column
      for(int i=0;i<ArraySize(desired_symbols);i++)
        {
         //First we store the initial value of each column
         initiall_input_values[i] = input_matrix[0][i+1];
         //Now temporarily copy the column, so that we can normalize the entire column at once
         vector temp_vector = input_matrix.Col(i+1);
         //Now divide that entire column by its initial value, if done correctly the first value of each column should be 1
         temp_vector = temp_vector / initiall_input_values[i];
         //Now reinsert the normalized column
         input_matrix.Col(temp_vector,i+1);
        }
      //Print the initial input values
      Print("Our initial input values for each column ");
      Print(initiall_input_values);

      //Scale the output
      //Store the initial output value
      initiall_output_value = output_matrix[0][0];
      //Make a temporary copy of the entire output column
      vector temp_vector_output = output_matrix.Col(0);
      //Divide the entire column by its initial value, so that the first value in the column is one
      //This means that any time the value is less than 1, price fell
      //And every time the value is greater than 1, price rose.
      //A value of 1.023... means price increased by 2.3%
      //A value of 0.8732.. would mean price fell by 22.67%
      temp_vector_output = temp_vector_output / initiall_output_value;
      //Reinsert the column back into the output matrix
      output_matrix.Col(temp_vector_output,0);
      //Shpw the scaled data
      Print("Data has been normlised and the output has been scaled:");
      Print("Input matrix: ");
      Print(input_matrix);
      Print("Output matrix: ");
      Print(output_matrix);
     }

//Normalize the data using the initial values we have allready calculated
   if(f_flag == 1)
     {
      //Divide each of the input values by its corresponding input value
      Print("Preparing to normalize the data for prediction");
      for(int i = 0; i < ArraySize(desired_symbols);i++)
        {
         input_matrix[0][i+1] = input_matrix[0][i+1]/initiall_input_values[i];
        }
      Print("Input data being used for prediction");
      Print(input_matrix);
     }
  }
次に、アプリケーションが取引を開始するために必要なフラグ条件を設定する関数を定義します。
//This function will allow our program to switch states and begin forecasting and looking for trades
void model_ready(void)
  {
//Our model is ready.
//We need to switch these flags to give the system access to trading functionality
   Print("Giving the system permission to begin trading");
   model_initialized = true;
   model_being_trained = false;
  }
EAから予測を得るには、まず利用可能な最新のデータを取得し、データを前処理した後、線形回帰式を使用してモデルから予測を得る必要があります。
//This function will obtain a prediction from our model
double model_predict(void)
  {
//First we have to fetch current market data
   Print("Obtaining a forecast from our model");
   fetch_input_data(0,1);
//Now we need to normalize our data using the values we calculated when we initialized the model
   prepare_data(1);
//Now we can return our model's forecast
   return((b[0][0] +
           (b[1][0]*input_matrix[0][0]) +
           (b[2][0]*input_matrix[0][1]) +
           (b[3][0]*input_matrix[0][2]) +
           (b[4][0]*input_matrix[0][3]) +
           (b[5][0]*input_matrix[0][4]) +
           (b[6][0]*input_matrix[0][5]) +
           (b[7][0]*input_matrix[0][6]) +
           (b[8][0]*input_matrix[0][7]) +
           (b[9][0]*input_matrix[0][8]) +
           (b[10][0]*input_matrix[0][9]) +
           (b[11][0]*input_matrix[0][10])+
           (b[12][0]*input_matrix[0][11])));
  }
上記で定義・説明した方程式を使って線形モデルをフィッティングする手順を実装します。MQL5 APIにより、柔軟かつ使いやすい方法で線形代数コマンドを実行できる柔軟性が実現され、操作を簡単に連鎖させることができるため、製品のパフォーマンスが向上します。
これは、マーケットで製品を販売したい場合は特に重要です。ベクトル演算はループよりも高速であるため、可能な限りforループの代わりにベクトル演算を使用するべきです。エンドユーザーは、遅延のない非常に反応の良いアプリケーションを体験し、ユーザー体験を楽しむことができます。
//This function will fit our linear model using the pseudo inverse solution
void fit_linear_model(void)
  {
   /*
      The pseudo inverse solution finds a list of values that maps our training data inputs to the output by minimizing the error, RSS.
      These coefficient values can easily be estimated using linear algebra, however these coefficients minimize our error on training data
      and on not unseen data!
   */
   Print("Attempting to find OLS solutions.");
//Now we can estimate our model parameters
   b = input_matrix.PInv().MatMul(output_matrix);
//Let's see our model parameters
   Print("Our model parameters ");
   Print(b);
  }
続いて、テクニカル指標を更新し、現在の市場データを取得する関数が必要です。
//Update our technical indicator values
void update_technical_indicators()
  {
//Get market data
   ask_price = SymbolInfoDouble(_Symbol,SYMBOL_ASK);
   bid_price = SymbolInfoDouble(_Symbol,SYMBOL_BID);
//Copy indicator buffers
   CopyBuffer(rsi_handler,0,0,10,rsi_buffer);
   CopyBuffer(cci_handler,0,0,10,cci_buffer);
   CopyBuffer(wpr_handler,0,0,10,wpr_buffer);
   CopyBuffer(ma_handler,0,0,10,ma_buffer);
//Set the arrays as series
   ArraySetAsSeries(rsi_buffer,true);
   ArraySetAsSeries(cci_buffer,true);
   ArraySetAsSeries(wpr_buffer,true);
   ArraySetAsSeries(ma_buffer,true);
  }
次に、取引のセットアップを実行してくれる関数を書きます。この関数は、両者のシステムが整合している場合にのみ取引を執行することができます。
//Let's try find an entry signal
void find_entry(void)
  {
//Our sell setup
   if(bearish_sentiment())
     {
      Trade.Sell(minimum_volume * lot_multiple,_Symbol,bid_price);
     }
//Our buy setup
   else
      if(bullish_sentiment())
        {
         Trade.Buy(minimum_volume * lot_multiple,_Symbol,ask_price);
        }
  }
これが可能なのは、上記の説明に従って弱気のセンチメントを定義する関数があるからです。
//This function tells us if all our tools align for a sell setup
bool bearish_sentiment(void)
  {
   /*
      For a sell setup, we want the following conditions to be satisfied:
      1) CCI reading should be less than 0
      2) RSI reading should be less than 50
      3) WPR reading should be less than -50
      4) Our model forecast should be less than 1
      5) MA reading should be below the moving average
   */
   return((iClose(target_symbol,PERIOD_CURRENT,0) < ma_buffer[0]) &&
          (cci_buffer[0] < 0) &&
          (rsi_buffer[0] < 50) &&
          (wpr_buffer[0] < -50) &&
          (model_forecast < 1));
  }
強気心理を定義する関数についても同様です。
//This function tells us if all our tools align for a buy setup
bool bullish_sentiment(void)
  {
   /*
      For a sell setup, we want the following conditions to be satisfied:
      1) CCI reading should be greater than 0
      2) RSI reading should be greater than 50
      3) WPR reading should be greater than -50
      4) Our model forecast should be greater than 1
      5) MA reading should be above the moving average
   */
   return((iClose(target_symbol,PERIOD_CURRENT,0) > ma_buffer[0]) &&
          (cci_buffer[0] > 0) &&
          (rsi_buffer[0] > 50) &&
          (wpr_buffer[0] > -50) &&
          (model_forecast > 1));
  }
最後に、ストップロスとテイクプロフィットの値を更新するヘルパー関数が必要です。
//+----------------------------------------------------------------------+
//|This function is responsible for calculating our SL & TP values       |
//+----------------------------------------------------------------------+
void update_stoploss(void)
  {

//First we iterate over the total number of open positions
   for(int i = PositionsTotal() -1; i >= 0; i--)
     {

      //Then we fetch the name of the symbol of the open position
      string symbol = PositionGetSymbol(i);

      //Before going any furhter we need to ensure that the symbol of the position matches the symbol we're trading
      if(_Symbol == symbol)
        {
         //Now we get information about the position
         ulong ticket = PositionGetInteger(POSITION_TICKET); //Position Ticket
         double position_price = PositionGetDouble(POSITION_PRICE_OPEN); //Position Open Price
         long type = PositionGetInteger(POSITION_TYPE); //Position Type
         double current_stop_loss = PositionGetDouble(POSITION_SL); //Current Stop loss value

         //If the position is a buy
         if(type == POSITION_TYPE_BUY)
           {

            //The new stop loss value is just the ask price minus the ATR stop we calculated above
            double atr_stop_loss = NormalizeDouble(ask_price - ((min_distance * sl_width)/2),_Digits);
            //The new take profit is just the ask price plus the ATR stop we calculated above
            double atr_take_profit = NormalizeDouble(ask_price + (min_distance * sl_width),_Digits);

            //If our current stop loss is less than our calculated ATR stop loss
            //Or if our current stop loss is 0 then we will modify the stop loss and take profit
            if((current_stop_loss < atr_stop_loss) || (current_stop_loss == 0))
              {
               Trade.PositionModify(ticket,atr_stop_loss,atr_take_profit);
              }
           }

         //If the position is a sell
         else
            if(type == POSITION_TYPE_SELL)
              {
               //The new stop loss value is just the ask price minus the ATR stop we calculated above
               double atr_stop_loss = NormalizeDouble(bid_price + ((min_distance * sl_width)/2),_Digits);
               //The new take profit is just the ask price plus the ATR stop we calculated above
               double atr_take_profit = NormalizeDouble(bid_price - (min_distance * sl_width),_Digits);

               //If our current stop loss is greater than our calculated ATR stop loss
               //Or if our current stop loss is 0 then we will modify the stop loss and take profit
               if((current_stop_loss > atr_stop_loss) || (current_stop_loss == 0))
                 {
                  Trade.PositionModify(ticket,atr_stop_loss,atr_take_profit);
                 }
              }
        }
     }
すべてのヘルパー関数は、価格が変化するたびに端末内のイベントの流れを制御するOnTickハンドラによって適切なタイミングで呼び出されます。
void OnTick()
  {
//Our model must be initialized before we can begin trading.
   switch(model_initialized)
     {
      //Our model is ready
      case(true):
         //Update the technical indicator values
         update_technical_indicators();
         //If we have no open positions, let's make a forecast using our model
         if(PositionsTotal() == 0)
           {
            //Let's obtain a prediction from our model
            model_forecast = model_predict();
            //Now that we have sentiment from our model let's try find an entry
            find_entry();
            Comment("Model forecast: ",model_forecast);
           }

         //If we have an open position, we need to manage it
         if(PositionsTotal() > 0)
           {
            //Update our stop loss
            update_stoploss();
           }
         break;

      //Default case
      //Our model is not yet ready.
      default:
         //If our model is not being trained, train it.
         if(!model_being_trained)
           {
            Print("Our model is not ready. Starting the training procedure");
            model_initialize();
           }
         break;
     }

  }

図3:アプリケーションの動作
制限事項
ここで選択したAIモデルのアプローチには、いくつかの制限があります。
1.1 相関入力
相関のある入力が引き起こす問題は、線形モデルに特有のものではなく、さまざまな機械学習モデルに影響を与えます。同じ業界に属する株式が入力行列に含まれている場合、それらの株価は同時に上昇や下降する傾向があり、株価の動きが互いを覆い隠してしまうことがあります。そのため、各株式がインデックスのパフォーマンスに与える影響をモデル内で分離することが困難になります。
1.2 非線形目的関数
金融データセットはノイズが多く、重回帰モデルなどの単純なモデルには適している場合が多いです。しかし、現実のケースでは、モデルが近似しようとする関数が線形であることはほとんどありません。真の関数が直線性から逸脱するほど、モデルの精度にばらつきが生じやすくなります。
1.3 直接モデリングアプローチの限界
最後に、S&P500に上場しているすべての銘柄をモデルに含めると、500のパラメータを持つモデルになります。このようなモデルの最適化には膨大な計算リソースが必要で、その結果を解釈することも困難です。直接モデリングのアプローチは、このような状況では適切に拡張できません。さらに多くの株式を追加すると、最適化すべきパラメータが増えすぎて管理が難しくなる可能性があります。
結論
この記事では、テクニカル分析を統合したAIモデルを構築し、情報に基づいた取引判断をおこなう方法がいかに簡単であるかを示しました。より高度なモデルに進化させる場合でも、今日取り上げたステップの多くは変わりません。初心者は、機械学習プロジェクトを最初から最後までやり遂げ、各決断の背後にある理論を理解することで、自信を深めることができるでしょう。
アプリケーション全体は、ネイティブのMQL5コードを利用し、MetaTrader 5のすべてのインストールで利用可能な標準テクニカル指標を活用しています。この記事が、読者が既存のツールでさらなる可能性を追求し、MQL5をマスターするために前進し続けるきっかけになることを願っています。
MetaQuotes Ltdにより英語から翻訳されました。
元の記事: https://www.mql5.com/en/articles/14815
 エラー 146 (「トレードコンテキスト ビジー」) と、その対処方法
- 無料取引アプリ
- 8千を超えるシグナルをコピー
- 金融ニュースで金融マーケットを探索