
SP500 Trading Strategy in MQL5 For Beginners

Introduction
This article will discuss how we can build an intelligent trading strategy to trade the Standard & Poor’s 500 (S&P 500) Index using MQL5. Our discussion will demonstrate how to take advantage of the flexibility of MQL5 to build a dynamic Expert Advisor that relies on a combination of Artificial Intelligence and technical analysis. Our rationale is that relying solely on AI can lead to unstable strategies; however, by guiding AI with the time proven principles of technical analysis, we can achieve a more reliable approach. This hybrid strategy aims to uncover patterns hidden within the vast amounts of data available on our MetaTrader 5 terminals, leveraging the strengths of both AI, traditional analysis and the MQL5 language to enhance trading performance and decision-making.
After reading this article, you will gain:
- Good programming principles for MQL5
- Insights into how traders can easily analyze large datasets from multiple symbols simultaneously using linear algebra commands in the MQL5 API.
- Techniques for uncovering hidden patterns in market data that are not immediately apparent.
History: What Is The Standard & Poor's 500?
The S&P 500, introduced in 1957, is a crucial benchmark that reflects the broad performance of the US economy. Over the years, numerous companies have been added to and removed from the index, reflecting the dynamic nature of the market. Among the longest-standing members, General Electric, J.P. Morgan, and Goldman Sachs have maintained their positions in the index since its inception.
The S&P 500 represents the average value of the 500 largest companies in the United States of America. The value of each company is given a weight based on its market capitalization. Therefore, the S&P 500 can also be considered as a market-capitalization weighted index of the 500 largest publicly traded companies in the world.
These days, trailblazing companies like Tesla and Nvidia have redefined the benchmark from its foundation. The S&P 500 now sees most of its weight held by large technology companies, including Google, Apple, and Microsoft, among the aforementioned giants. These tech titans have transformed the landscape of the index, reflecting the shift in the economy towards technology and innovation.
Overview of Our Trading Strategy
A list of the companies included in the index is easily accessible on the internet. We can leverage our understanding of how the index is composed to help us create a trading strategy. We shall select a handful of the largest companies in the index and use the respective price of each company as an input to an AI model that will predict the closing price of the index based on our sample of companies that hold proportionally large weights. Our desire is to develop a strategy that blends AI with trusted, time-proven techniques.
Our technical analysis system will employ trend-following principles to generate trading signals. We need to incorporate several key indicators:
- The Commodity Channel Index (CCI) as our volume indicator. We only want to enter trades that are backed by volume.
- The Relative Strength Index (RSI) and the Williams Percent Range (WPR) to gauge buying or selling pressure in the market.
- A Moving Average (MA) as our final confirmation indicator.
The Commodity Channel Index (CCI) revolves around 0. A reading above 0 suggests strong volume for a buying opportunity, while a reading below 0 indicates supportive volume for selling. We require alignment with other indicators for trade confirmation, improving our chances of finding high-probability setups.
Therefore, in order for us to buy:
- CCI reading must be greater than 0.
- RSI reading must be greater than 50.
- WPR reading must be greater than -50.
- MA must be beneath the closing price.
And conversely for us to sell:
- CCI reading must be less than 0.
- RSI reading must be less than 50.
- WPR reading must be less than -50.
- MA must be above the closing price.
On the other hand, to build our AI system, we need to first fetch the historical prices of 12 large market cap stocks included in the S&P 500 and the closing prices of the S&P 500. This will be our training data that we use to build our multiple linear regression model to forecast future prices of the index.
From there the AI system will utilize ordinary least squares regression to forecast the closing value of the S&P 500.

Fig 1: Our model will view the S&P500 as the output of a collection of these stocks.
Once we have the data ready, we can estimate model parameters for our linear regression model using the following formula.
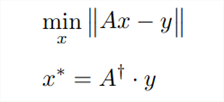
Fig 2:The above equation demonstrates one of many possible ways to estimate the parameters of a multiple linear regression model.
The expression "Ax - y" surrounded by two vertical lines is known as the L2 norm of a vector, pronounced "ell 2." In everyday language, when we ask, "how big is it?" about physical objects, we talk about their size or magnitude. Similarly, when we ask "how big" a vector is, we refer to its norm. A vector is essentially a list of numbers. While there are different types of norms, the L1 norm and L2 norm are the most common. Today, we'll focus on the L2 norm, which is calculated as the square root of the sum of the squared values within the vector.
In this context:
- The matrix "A" represents the input data, consisting of the closing values of 12 different stocks.
- The symbol "x" denotes the coefficient values for our multiple linear regression model, with one coefficient per stock.
- The product "Ax" represents our predictions for the future price of the S&P 500 index based on our training data.
- The notation "y" symbolizes the vector of actual closing prices we aimed to predict during training.
In essence, the first equation tells us that we are looking for values of x that minimize the L2 norm of Ax - y. In other words, we are seeking the values of x that minimize our prediction error when forecasting the closing price of the S&P 500.
The second equation reveals that the values of x that achieve the minimum error may be found by multiplying the pseudo-inverse of A by the output data (y) from our training set. The pseudo-inverse operation is conveniently implemented in MQL5.
We can efficiently find the pseudo-inverse solution in MQL5 with just a few lines of code.
Implementation: SP500 Trading Strategy
Getting Started
We first need to define inputs for our Expert Advisor. We need inputs to allow the user to change the periods of our technical indicators.
//+------------------------------------------------------------------+
//|                                            SP500 Strategy EA.mq5 |
//|                                  Copyright 2024, MetaQuotes Ltd. |
//|                                             https://www.mql5.com |
//+------------------------------------------------------------------+
#property copyright "Gamuchirai Zororo Ndawana"
#property link      "https://www.mql5.com"
#property version   "1.00"
/*
The goal of this application is to implement a strategy to trade the SP500 based
on the performance of a sample of stocks that hold proportionally large weights in the index and classical technical analysis.

We will use the following stocks:
1)Microsoft
2)Apple
3)Google
4)Meta
5)Visa
6)JPMorgan
7)Nvidia
8)Tesla
9)Johnsons N Johnsons
10)Home Depot
11)Proctor & Gamble
12)Master Card

A strategy that relies solely on AI  may prove to be unstable.
We want to use a combination of AI guided by trading strategies that have been trusted over time.

Our AI will be a linear system mapping the price of each stock to the closing price of the index.
Recall that financial time series data can be very noisy. Using simpler models may be beneficial.
We will attempt to find linear coefficients using ordinary least squares.
We will use the pseudo inverse solution to find our model parameters.

Our technical analysis will be based on trend following principles:
1)We must observe increasing volume backing a trade before we enter.
2)We want 2 confirmation indicators, RSI and WPR, confirming the trend.
3)We want price to break above the previous week high or low.
4)We want price above or below our MA before we trade.

Our goal is to find an optimal combination of statistical insight,
and classical technical analysis to hopefully build a strategy with an edge.

Gamuchirai Zororo Ndawana
Selebi Phikwe
Botswana
Monday 8 July 2024 21:03
*/
//Inputs
//How far ahead into the future should we forecast?
input int look_ahead = 10;
//Our moving average period
input int ma_period = 120;
//Our RSI period
input int rsi_period = 10;
//Our WPR period
input int wpr_period = 30;
//Our CCI period
input int cci_period = 40;
//How big should our lot sizes be?
int input  lot_multiple = 20;
Next we need to import our trade library so we can manage our positions.
//Libraries
//Trade class
#include <Trade/Trade.mqh>
CTrade Trade;
Moving on, we need to define global variables that are used throughout our program.
//Global variables
//Smallest lot size
double minimum_volume;
//Ask
double ask_price;
//Bid
double bid_price;
//How much data should we fetch?
int fetch = 20;
//Determine the starting date for our inputs
int inupt_start;
//Determine the starting date for our outputs
int output_start;
//Which symbols are we going to use to forecast the SP500 close?
string desired_symbols[] = {"MSFT","AAPL","NVDA","GOOG","TSLA","META","JPM","JNJ","V","PG","HD","MA"};
//Define our input matrix
matrix input_matrix = matrix::Ones(fetch,(ArraySize(desired_symbols))-1);
//Define our output matrix, our output matrix has one column
matrix output_matrix = matrix::Ones(fetch,1);
//A vector to store the initial values of each column
vector initiall_input_values = vector::Ones((ArraySize(desired_symbols)));
//A variable to store the initial value of the output
double initiall_output_value = 0.0;
//Defining the matrix that will store our model parameters
matrix b;
//Define our target symbol
string target_symbol = "US_500";
//A vector to temporarily store the historic closing price of each stock
vector symbol_history = vector::Zeros(fetch);
//A flag to let us know when our model is ready
bool model_initialized = false;
//A flag to let us know if the training process has started
bool model_being_trained = false;
//Our model's prediction
double model_forecast = 0;
//Handlers for our technical indicators
int cci_handler,rsi_handler,wpr_handler,ma_handler;
//Buffers for our technical indicator values
double cci_buffer[],rsi_buffer[],wpr_buffer[],ma_buffer[];
Now that we have come this far, we must set up our technical indicators in the initialization handler.
//+------------------------------------------------------------------+
//| Expert initialization function                                   |
//+------------------------------------------------------------------+
int OnInit()
  {
//---
//Let's setup our technical indicators
   rsi_handler = iRSI(target_symbol,PERIOD_CURRENT,rsi_period,PRICE_CLOSE);
   ma_handler = iMA(target_symbol,PERIOD_CURRENT,ma_period,0,MODE_EMA,PRICE_CLOSE);
   wpr_handler = iWPR(target_symbol,PERIOD_CURRENT,wpr_period);
   cci_handler = iCCI(target_symbol,PERIOD_CURRENT,cci_period,PRICE_CLOSE);
//Get market data
   minimum_volume = SymbolInfoDouble(_Symbol,SYMBOL_VOLUME_MIN);
//---
   return(INIT_SUCCEEDED);
  }
We require helper functions. Initially, we define a procedure to initialize our multiple linear regression model. Our fitting procedure begins by setting a flag to indicate that our model is undergoing training. Additional functions handle tasks such as retrieving training data and fitting the model. By breaking our code into smaller functions, we will avoid writing the same lines of code multiple times.
//+------------------------------------------------------------------+
//This function defines the procedure for fitting our model
void model_initialize(void)
  {
   /*
   Our function will run the initialization procedure as follows:
   1)Update the training flag to show that the model has been trained
   2)Fetch the necessary input and output data
   3)Preprocess the data, normalization and scaling etc.
   4)Fit the model
   5)Update the flags to show that the model has been trained.
   From there our application will have the ability to begin trading.
   */
//First let us set our flag to denote that the model is being trained
   model_being_trained = true;
//Defining the input start time and the output start time
//Remember the input data should not contain the most recent bars
//The most recent bars must only be included in the output start time
//The input data should be older than the output data.
   inupt_start = 1+look_ahead;
   output_start = 1;
//Fetch the input data
   fetch_input_data(inupt_start,fetch);
//Fetch the output data
   fetch_output_data(output_start,fetch);
//Prepare the data
   prepare_data(0);
//Fit our model
   fit_linear_model();
//The model is ready
   model_ready();
  }
Now, we proceed to define the function responsible for fetching our input data. Our input matrix will include a column of ones in the first column to represent the intercept point or the average closing price of the S&P 500 when all stock values are zero. Although this scenario doesn't make sense in the financial world since if all stock values were 0, the S&P 500 close price would also be 0.
That aside our procedure for fetching input data is straightforward:
- Initialize the input matrix full of ones.
- Reshape the matrix
- Fill in the close value of each stock, starting from the second column
- Ensure that the first column is full of ones.
//This function will get our input data ready
void fetch_input_data(int f_input_start,int f_fetch)
  {
   /*
      To get the input data ready we will to cycle through the symbols available and copy the requested
      amount of data to the globally scoped input matrix.
      Our function parameters are:
      1)f_input_start: this is where we should get our input data, for the current data pass 0 and only fetch 1.
      2)f_fetch: this is how much data should be fetched and copied into the input matrix.
   */
   Print("Preparing to fetch input data");
//Let's observe the original state of our input matrix
   Print("We will reset the input matrix before fetching the data we need: ");
   input_matrix = matrix::Ones(f_fetch,(ArraySize(desired_symbols))-1);
   Print(input_matrix);
//We need to reshape our matrix
   input_matrix.Reshape(f_fetch,13);
//Filling the input matrix
//Then we need to prepare our input matrix.
//The first column must be full of 1's because it represents the intercept.
//Therefore we will skip 0, and start filling input values from column 1. This is not a mistake.
   for(int i=1; i <= ArraySize(desired_symbols);i++)
     {
      //Copy the input data we need
      symbol_history.CopyRates(desired_symbols[i-1],PERIOD_CURRENT,COPY_RATES_CLOSE,f_input_start,f_fetch);
      //Insert the input data into our input matrix
      input_matrix.Col(symbol_history,i);
     }
//Ensure that the first column is full of ones for our intercept
   vector intercept = vector::Ones(f_fetch);
   input_matrix.Col(intercept,0);
//Let us see what our input matrix looks like now.
   Print("Final state of our input matrix: ");
   Print(input_matrix);
  }
Our procedure for fetching output data will be more or less the same as what we did for fetching our input data.
//This function will get our output data ready
void fetch_output_data(int f_output_start, int f_fetch)
  {
   /*
      This function will fetch our output data for training our model and copy it into
      our globally defined output matrix. The model has only 2 parameters:
      1)f_output_start: where should we start copying our output data
      2)f_fetch: amount of data to copy
   */
   Print("Preparing to fetch output data");
//Let's observe the original state of our output matrix
   Print("Ressetting output matrix before fetching the data we need: ");
//Reset the output matrix
   output_matrix = matrix::Ones(f_fetch,1);
   Print(output_matrix);
//We need to reshape our matrix
   output_matrix.Reshape(f_fetch,1);
//Output data
//Copy the output data we need
   symbol_history.CopyRates(target_symbol,PERIOD_CURRENT,COPY_RATES_CLOSE,f_output_start,f_fetch);
//Insert the output data into our input matrix
   output_matrix.Col(symbol_history,0);
//Let us see what our input matrix looks like now.
   Print("Final state of our output matrix: ");
   Print(output_matrix);
  }
Before fitting our model, we need to standardize and scale our data. This is an important step because it makes the hidden relationships in the rates of change easier for our application to learn.
Note that our fitting procedure has 2 distinct phases, in phase 1 when the model is being trained for the first time, we need to store the values we used to scale each column in a vector. Each column will be divided by the first value in it, meaning that the first value in every column will be one.
From then on, if we observe any value less than one in that column, then price fell, and values greater than one indicate that price increased. If we observe a reading of 0.72, then price fell by 28% and if we observe a value of 1.017, then price increased by 1.7%.
We should only store the initial value of each column once, from then onward all future inputs should be divided by the same amount to ensure consistency.
//This function will normalize our input data so that our model can learn better
//We will also scale our output so that it shows the growth in price
void prepare_data(int f_flag)
  {
   /*
      This function is responsible for normalizing our inputs and outputs.
      We want to first store the initial value of each column.
      Then we will divide each column by its first value, so that the first value in each column is one.
      The above steps are performed only once, when the model is initialized. All subsequent inputs will
      simply be divided by the initial values of that column.
   */

   Print("Normalizing and scaling the data");
//This part of the procedure should only be performed once
   if(f_flag == 0)
     {
      Print("Preparing to normalize the data for training the model");
      //Normalizing the inputs
      //Store the initial value of each column
      for(int i=0;i<ArraySize(desired_symbols);i++)
        {
         //First we store the initial value of each column
         initiall_input_values[i] = input_matrix[0][i+1];
         //Now temporarily copy the column, so that we can normalize the entire column at once
         vector temp_vector = input_matrix.Col(i+1);
         //Now divide that entire column by its initial value, if done correctly the first value of each column should be 1
         temp_vector = temp_vector / initiall_input_values[i];
         //Now reinsert the normalized column
         input_matrix.Col(temp_vector,i+1);
        }
      //Print the initial input values
      Print("Our initial input values for each column ");
      Print(initiall_input_values);

      //Scale the output
      //Store the initial output value
      initiall_output_value = output_matrix[0][0];
      //Make a temporary copy of the entire output column
      vector temp_vector_output = output_matrix.Col(0);
      //Divide the entire column by its initial value, so that the first value in the column is one
      //This means that any time the value is less than 1, price fell
      //And every time the value is greater than 1, price rose.
      //A value of 1.023... means price increased by 2.3%
      //A value of 0.8732.. would mean price fell by 22.67%
      temp_vector_output = temp_vector_output / initiall_output_value;
      //Reinsert the column back into the output matrix
      output_matrix.Col(temp_vector_output,0);
      //Shpw the scaled data
      Print("Data has been normlised and the output has been scaled:");
      Print("Input matrix: ");
      Print(input_matrix);
      Print("Output matrix: ");
      Print(output_matrix);
     }

//Normalize the data using the initial values we have allready calculated
   if(f_flag == 1)
     {
      //Divide each of the input values by its corresponding input value
      Print("Preparing to normalize the data for prediction");
      for(int i = 0; i < ArraySize(desired_symbols);i++)
        {
         input_matrix[0][i+1] = input_matrix[0][i+1]/initiall_input_values[i];
        }
      Print("Input data being used for prediction");
      Print(input_matrix);
     }
  }
Next, we need to define a function that will set the necessary flag conditions to allow our application to begin trading.
//This function will allow our program to switch states and begin forecasting and looking for trades
void model_ready(void)
  {
//Our model is ready.
//We need to switch these flags to give the system access to trading functionality
   Print("Giving the system permission to begin trading");
   model_initialized = true;
   model_being_trained = false;
  }
For us to obtain a prediction from our Expert Advisor, we must first fetch the most recent data we have available, preprocess the data then use the linear regression equation to obtain a forecast from our model.
//This function will obtain a prediction from our model
double model_predict(void)
  {
//First we have to fetch current market data
   Print("Obtaining a forecast from our model");
   fetch_input_data(0,1);
//Now we need to normalize our data using the values we calculated when we initialized the model
   prepare_data(1);
//Now we can return our model's forecast
   return((b[0][0] +
           (b[1][0]*input_matrix[0][0]) +
           (b[2][0]*input_matrix[0][1]) +
           (b[3][0]*input_matrix[0][2]) +
           (b[4][0]*input_matrix[0][3]) +
           (b[5][0]*input_matrix[0][4]) +
           (b[6][0]*input_matrix[0][5]) +
           (b[7][0]*input_matrix[0][6]) +
           (b[8][0]*input_matrix[0][7]) +
           (b[9][0]*input_matrix[0][8]) +
           (b[10][0]*input_matrix[0][9]) +
           (b[11][0]*input_matrix[0][10])+
           (b[12][0]*input_matrix[0][11])));
  }
We need to implement a procedure for fitting our linear model using the equations we defined and explained above. Notice that our MQL5 API allows us the flexibility to perform our linear algebra commands in a flexible and easy to use manner, we can easily chain operations together, making our products highly performant.
This is especially important if you wish to sell your products in the marketplace, avoid using for loops whenever we can perform vector operations instead because vector operations are faster than loops. Your end users will experience a very responsive application that doesn't lag, and they will enjoy their user experience.
//This function will fit our linear model using the pseudo inverse solution
void fit_linear_model(void)
  {
   /*
      The pseudo inverse solution finds a list of values that maps our training data inputs to the output by minimizing the error, RSS.
      These coefficient values can easily be estimated using linear algebra, however these coefficients minimize our error on training data
      and on not unseen data!
   */
   Print("Attempting to find OLS solutions.");
//Now we can estimate our model parameters
   b = input_matrix.PInv().MatMul(output_matrix);
//Let's see our model parameters
   Print("Our model parameters ");
   Print(b);
  }
Progressing on, we need a function responsible for updating our technical indicators and fetching current market data.
//Update our technical indicator values
void update_technical_indicators()
  {
//Get market data
   ask_price = SymbolInfoDouble(_Symbol,SYMBOL_ASK);
   bid_price = SymbolInfoDouble(_Symbol,SYMBOL_BID);
//Copy indicator buffers
   CopyBuffer(rsi_handler,0,0,10,rsi_buffer);
   CopyBuffer(cci_handler,0,0,10,cci_buffer);
   CopyBuffer(wpr_handler,0,0,10,wpr_buffer);
   CopyBuffer(ma_handler,0,0,10,ma_buffer);
//Set the arrays as series
   ArraySetAsSeries(rsi_buffer,true);
   ArraySetAsSeries(cci_buffer,true);
   ArraySetAsSeries(wpr_buffer,true);
   ArraySetAsSeries(ma_buffer,true);
  }
Then, we shall write a function that will execute our trade setups for us. Our function will only be able to execute trades if both our systems are aligned.
//Let's try find an entry signal
void find_entry(void)
  {
//Our sell setup
   if(bearish_sentiment())
     {
      Trade.Sell(minimum_volume * lot_multiple,_Symbol,bid_price);
     }
//Our buy setup
   else
      if(bullish_sentiment())
        {
         Trade.Buy(minimum_volume * lot_multiple,_Symbol,ask_price);
        }
  }
This is made possible because we have functions that define bearish sentiment according to our descriptions above.
//This function tells us if all our tools align for a sell setup
bool bearish_sentiment(void)
  {
   /*
      For a sell setup, we want the following conditions to be satisfied:
      1) CCI reading should be less than 0
      2) RSI reading should be less than 50
      3) WPR reading should be less than -50
      4) Our model forecast should be less than 1
      5) MA reading should be below the moving average
   */
   return((iClose(target_symbol,PERIOD_CURRENT,0) < ma_buffer[0]) &&
          (cci_buffer[0] < 0) &&
          (rsi_buffer[0] < 50) &&
          (wpr_buffer[0] < -50) &&
          (model_forecast < 1));
  }
And the same is true for our function defining bullish sentiment.
//This function tells us if all our tools align for a buy setup
bool bullish_sentiment(void)
  {
   /*
      For a sell setup, we want the following conditions to be satisfied:
      1) CCI reading should be greater than 0
      2) RSI reading should be greater than 50
      3) WPR reading should be greater than -50
      4) Our model forecast should be greater than 1
      5) MA reading should be above the moving average
   */
   return((iClose(target_symbol,PERIOD_CURRENT,0) > ma_buffer[0]) &&
          (cci_buffer[0] > 0) &&
          (rsi_buffer[0] > 50) &&
          (wpr_buffer[0] > -50) &&
          (model_forecast > 1));
  }
Finally, we require a helper function to update our stop loss and take profit values.
//+----------------------------------------------------------------------+
//|This function is responsible for calculating our SL & TP values       |
//+----------------------------------------------------------------------+
void update_stoploss(void)
  {

//First we iterate over the total number of open positions
   for(int i = PositionsTotal() -1; i >= 0; i--)
     {

      //Then we fetch the name of the symbol of the open position
      string symbol = PositionGetSymbol(i);

      //Before going any furhter we need to ensure that the symbol of the position matches the symbol we're trading
      if(_Symbol == symbol)
        {
         //Now we get information about the position
         ulong ticket = PositionGetInteger(POSITION_TICKET); //Position Ticket
         double position_price = PositionGetDouble(POSITION_PRICE_OPEN); //Position Open Price
         long type = PositionGetInteger(POSITION_TYPE); //Position Type
         double current_stop_loss = PositionGetDouble(POSITION_SL); //Current Stop loss value

         //If the position is a buy
         if(type == POSITION_TYPE_BUY)
           {

            //The new stop loss value is just the ask price minus the ATR stop we calculated above
            double atr_stop_loss = NormalizeDouble(ask_price - ((min_distance * sl_width)/2),_Digits);
            //The new take profit is just the ask price plus the ATR stop we calculated above
            double atr_take_profit = NormalizeDouble(ask_price + (min_distance * sl_width),_Digits);

            //If our current stop loss is less than our calculated ATR stop loss
            //Or if our current stop loss is 0 then we will modify the stop loss and take profit
            if((current_stop_loss < atr_stop_loss) || (current_stop_loss == 0))
              {
               Trade.PositionModify(ticket,atr_stop_loss,atr_take_profit);
              }
           }

         //If the position is a sell
         else
            if(type == POSITION_TYPE_SELL)
              {
               //The new stop loss value is just the ask price minus the ATR stop we calculated above
               double atr_stop_loss = NormalizeDouble(bid_price + ((min_distance * sl_width)/2),_Digits);
               //The new take profit is just the ask price plus the ATR stop we calculated above
               double atr_take_profit = NormalizeDouble(bid_price - (min_distance * sl_width),_Digits);

               //If our current stop loss is greater than our calculated ATR stop loss
               //Or if our current stop loss is 0 then we will modify the stop loss and take profit
               if((current_stop_loss > atr_stop_loss) || (current_stop_loss == 0))
                 {
                  Trade.PositionModify(ticket,atr_stop_loss,atr_take_profit);
                 }
              }
        }
     }
All of our helper functions will be called at the appropriate time by our OnTick handler, that is responsible for controlling the flow of events inside our terminal whenever price changes.
void OnTick()
  {
//Our model must be initialized before we can begin trading.
   switch(model_initialized)
     {
      //Our model is ready
      case(true):
         //Update the technical indicator values
         update_technical_indicators();
         //If we have no open positions, let's make a forecast using our model
         if(PositionsTotal() == 0)
           {
            //Let's obtain a prediction from our model
            model_forecast = model_predict();
            //Now that we have sentiment from our model let's try find an entry
            find_entry();
            Comment("Model forecast: ",model_forecast);
           }

         //If we have an open position, we need to manage it
         if(PositionsTotal() > 0)
           {
            //Update our stop loss
            update_stoploss();
           }
         break;

      //Default case
      //Our model is not yet ready.
      default:
         //If our model is not being trained, train it.
         if(!model_being_trained)
           {
            Print("Our model is not ready. Starting the training procedure");
            model_initialize();
           }
         break;
     }

  }

Fig 3: Our application in action.
Limitations
There are a few limitations concerning the modelling approach we have chosen for our AI models, let us highlight a few of the important ones:
1.1 Correlated Inputs
The problems caused by correlated inputs are not unique to linear models, this problem affects a lot of Machine Learning models. Some of the stocks we have in our input matrix operate in the same industry and their prices tend to rise and fall at the same time, this can make it hard for our model to isolate the effect each stock has on the performance of the index because the stock price movements may be masking each other.
1.2 Nonlinear Objective Function
Financial data sets that are inherently noisy are usually more suitable for simpler models such as multiple linear regression. However, in most real-life cases the actual functions being approximated are hardly ever linear. Therefore, the further away from linearity the true function is, the more variance will be observed in the model's accuracy.
1.3 Limitations of a Direct Modelling Approach
Lastly, if we were to include every stock listed on the S&P 500 in our model, we would end up with a model containing 500 parameters. Optimizing such a model would demand significant computational resources, and interpreting its results would pose challenges. Direct modeling solutions do not scale gracefully in this context; as we add more stocks in the future, the number of parameters to optimize could quickly become unmanageable.
Conclusion
In this article, we've demonstrated how straightforward it is to begin building AI models that integrate technical analysis for informed trading decisions. As we progress to more advanced models, most of the steps covered today will remain unchanged. This should give beginners confidence, knowing they've completed a machine learning project from start to finish and hopefully understood the rationale behind each decision.
Our entire application utilizes native MQL5 code and leverages standard technical indicators available in every installation of MetaTrader 5. We hope this article inspires you to explore further possibilities with your existing tools and continue advancing in mastering MQL5.
- Free trading apps
- Over 8,000 signals for copying
- Economic news for exploring financial markets
You agree to website policy and terms of use
Awesome thank you for your interesting and well documented code , Looking forward to getting it to work . There is at least one trap with for newbies , that is to change the target symbol on line 92 to your brokers symbol for sp500 ,also on line 84 to match the stock symbols your broker has.
what should line 286 'Our Model Parameters return? I get [-nan(ind)], the rest seems to work perfectly.
I was hopefull this might actually work. Thanks to the auther for sharing it regardless.
cannot load indicator 'Relative Strength Index' [4302]
cannot load indicator 'Moving Average' [4302]
cannot load indicator 'Williams' Percent Range' [4302]
cannot load indicator 'Commodity Channel Index' [4302]
I understand indicators should automatically be loaded and displayed.(fails)
I manually placed the indicators on the chart and even created a template with all indicators included. Even when every stock's chart is open and all indicators placed on chart manually, the EA fails to read indicators on it's own.