
重构经典策略(第七部分):基于USDJPY的外汇市场与主权债务分析
人工智能有潜力为现代投资者创造新的交易策略。任何单一投资者都不太可能有足够的时间仔细评估每一种可能的策略,然后再决定将他们的资金用于哪一种策略。在这一系列文章中,我们的目标是为您提供所需的信息,以便您能够做出明智的决策,选择最适合您投资偏好的策略。
交易策略概要
固定收益证券是一种允许投资者安全地多样化其投资组合的投资。它们是一类在到期前支付固定或浮动利率回报的投资。到期时,投资者的本金将被偿还,此后不会再向投资者支付任何款项。固定收益证券有多种类型,如债券和定期存款单。
债券是固定收益证券中最受欢迎的形式之一,将成为我们讨论的重点。债券可以由公司或政府发行。特别是政府债券是世界上最安全的投资之一。如果投资者希望购买某一特定政府的债券,他们必须使用发行国的货币进行购买。如果某一特定政府的债券在国际上需求旺盛,每个希望获得该债券的投资者首先会将本国货币兑换成所需的货币。这反过来可能会改变市场对两种货币汇率估值的看法。
债券的表现通过债券的收益率来衡量。债券的收益率与对该债券的需求水平之间存在反向关系。换句话说,当对某一特定债券的需求下降时,债券的收益率会上升,以吸引对该债券的需求。一些成功的外汇市场交易者将这种基本面分析纳入他们的交易策略中。通过比较有关汇率中两个国家的中期至长期政府债券的收益率,外汇交易者可以对这两个国家的经济状况有一个直观的了解。
通常情况下,提供给投资者较高利率的债券会更受欢迎,根据该策略,发行国的货币也会随着时间的推移而升值,而发行较低利率债券的国家的货币则会随着时间的推移而贬值。
方法论概要
为了评估该策略,我们训练了各种模型来预测USDJPY汇率的收盘价。我们为模型准备了3组预测因子:- 从市场获取USDJPY的常规开盘价、最高价、最低价、收盘价、成交笔数(OHLCV)数据。
- 日本政府10年期国债和美国政府10年期国债的OHLCV数据。
- 前两组数据的超数据集。
我们的目标是确定哪一组预测因子能够在未知数据上产生具有最低均方根误差(RMSE)的模型。尽管日本国债和美国国债的历史价格与USDJPY之间的相关性显著较强(两者均为-0.85),但由第一组预测因子训练出的模型产生了最低的测试误差率。
我们识别出的最佳模型是线性回归(LR)模型。然而,它没有任何我们可以调整的参数。因此,我们选择线性支持向量回归器(LSVR)作为我们的候选解决方案。我们成功地对LSVR模型进行了超参数调整,而没有过度拟合训练集。此外,我们定制的LSVR模型能够在验证数据上超越简单LR模型设定的基准表现。模型的训练和比较使用了时间序列交叉验证,且没有随机打乱数据。
在成功调整我们的模型后,我们将模型导出为ONNX格式,并将其集成到我们定制的EA中。
获取数据
让我们开始吧,首先我们将导入我们需要的库。
#Import the libraries we need
import pandas as pd
import numpy as np
import MetaTrader5 as mt5
import matplotlib.pyplot as plt
import matplotlib
import seaborn as sns
import sklearn
from sklearn.preprocessing import RobustScaler
from sklearn.model_selection import train_test_split
以下是我们在使用的库的版本。
#Show library versions
print(f"Pandas version: {pd.__version__}")
print(f"Numpy version: {np.__version__}")
print(f"MetaTrader 5 version: {mt5.__version__}")
print(f"Matplotlib version: {matplotlib.__version__}")
print(f"Seaborn version: {sns.__version__}")
print(f"Scikit-learn version: {sklearn.__version__}")
Pandas 版本:1.5.3
Numpy 版本:1.24.4
MetaTrader 5 版本:5.0.45
Matplotlib 版本:3.7.1
Seaborn 版本:0.13.0
Scikit-learn 版本:1.2.2
让我们初始化终端。
#Initialize the terminal
mt5.initialize()
定义我们想要预测多久的未来数据。
#Define how far ahead into the future we should forecast
look_ahead = 20
从MetaTrader 5 终端中获取所需的时间序列数据。
#Fetch historical market data
usa_10y_bond = pd.DataFrame(mt5.copy_rates_from_pos("UST10Y_U4",mt5.TIMEFRAME_M1,0,100000))
jpn_10y_bond = pd.DataFrame(mt5.copy_rates_from_pos("JGB10Y_U4",mt5.TIMEFRAME_M1,0,100000))
usd_jpy      = pd.DataFrame(mt5.copy_rates_from_pos("USDJPY",mt5.TIMEFRAME_M1,0,100000))
数据结构中的时间列需要进行格式化。
#Convert the time from seconds
usa_10y_bond["time"] = pd.to_datetime(usa_10y_bond["time"],unit="s")
jpn_10y_bond["time"] = pd.to_datetime(jpn_10y_bond["time"],unit="s")
usd_jpy["time"] = pd.to_datetime(usd_jpy["time"],unit="s")
我们应该将时间列设置为索引,这将使我们能够更轻松地将3个数据框合并为1个。
#Prepare to merge the data
usa_10y_bond.set_index("time",inplace=True)
jpn_10y_bond.set_index("time",inplace=True)
usd_jpy.set_index("time",inplace=True)
合并各数据块。
#Merge the data
merged_data = usa_10y_bond.merge(jpn_10y_bond,how="inner",left_index=True,right_index=True,suffixes=(" usa"," japan"))
merged_data = merged_data.merge(usd_jpy,left_index=True,right_index=True)
探索性数据分析
让我们创建一个数据结构,我们将用它来进行绘图。
data_visualization = merged_data
我们需要重置可视化数据的索引。
#Reset the index
data_visualization.reset_index(inplace=True)
将所有列的值进行缩放,使它们都从1开始。
#Let's scale the data so all the first values in the column are one
for i in np.arange(1,data_visualization.shape[1]):
    data_visualization.iloc[:,i] = data_visualization.iloc[:,i] / data_visualization.iloc[0,i]
让我们绘制这3个时间序列,看看是否存在任何可观察的关系。
#Let's create a plot
plt.figure(figsize=(10, 5))
plt.plot(data_visualization.loc[:,"open usa"])
plt.plot(data_visualization.loc[:,"open japan"])
plt.plot(data_visualization.loc[:,"open"])
plt.legend(["USA 10Y T-Note","JGB 10Y Bond","USDJPY Fx Rate"])
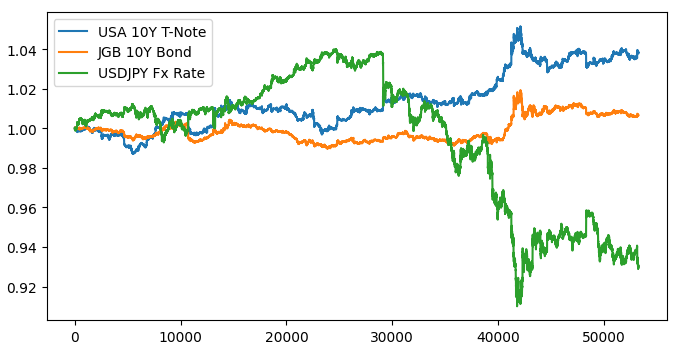
图1:可视化我们的市场数据
当我们叠加这3个市场时,似乎不存在明显的相关性。让我们尝试通过绘制美债和日债之间的利差来使图表更易于阅读。这样,我们只需要考虑USDJPY汇率和美日10年期债券利差。换句话说,上面绘制的3条曲线,实际上可以用仅2条曲线来完全表示。
首先,我们需要计算债券之间的利差。
#Let's create a new feature to show the spread between the securities
data_visualization["spread"] = data_visualization["open usa"] - data_visualization["open japan"]
在图表的左侧,我们看到USDJPY汇率的样本,每当汇率超过1时,美元的表现优于日元,反之亦然,当汇率低于1时,日元表现优于美元。此外,每当利差超过0时,美债的表现优于日债,反之亦然,当利差低于0时,日债表现优于美债。因此,当利差低于0,即日债在市场上的表现优于美债时,我们也会期望看到均衡汇率向日元倾斜。然而,通过肉眼观察这些图表,我们可以迅速发现这种预期并不总是成立。
#Visualizing the results of using the bonds predictors
fig,axs = plt.subplots(1,2,sharex=True,sharey=False,figsize=(8,4))
columns = ["open","spread"]

for i,ax in enumerate(axs.flat):
    ax.plot(data_visualization.loc[:,columns[i]])
    ax.set_title(columns[i])
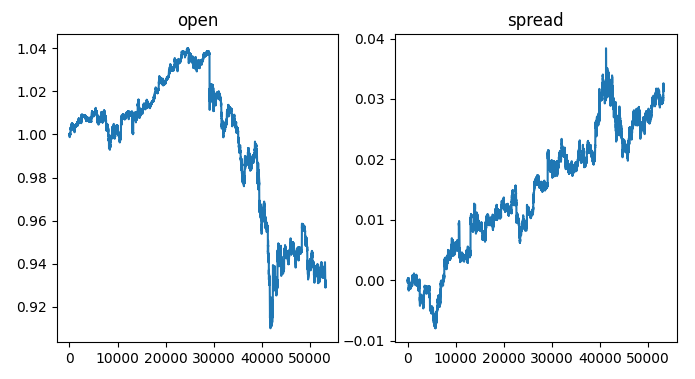
图2:可视化汇率上的债券利差。
让我们为数据打标签。
#Label the data
merged_data["target"] = merged_data["close"].shift(-look_ahead)
merged_data["binary target"] = np.nan
merged_data.loc[merged_data["close"] > merged_data["target"],"binary target"] = 0
merged_data.loc[merged_data["close"] < merged_data["target"],"binary target"] = 1
merged_data.dropna(inplace=True)
merged_data.reset_index(inplace=True)
merged_data
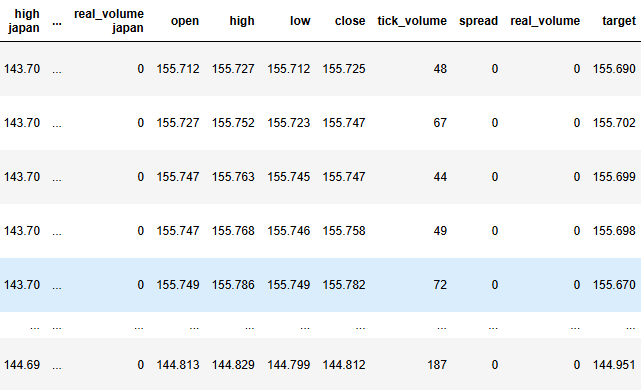
图3:数据结构的当前状态
现在我们要定义目标和输入参数。
#Define the predictors and target
target = "target"
ohlc_predictors = ['open', 'high', 'low', 'close','tick_volume']
bonds_predictors = ['open usa','high usa','low usa','close usa','tick_volume usa','open japan','high japan', 'low japan', 'close japan','tick_volume japan']
predictors = ['open usa','high usa','low usa','close usa','tick_volume usa','open japan','high japan', 'low japan', 'close japan','tick_volume japan','open', 'high', 'low', 'close','tick_volume']
让我们分析数据集的相关性水平。
#Analyze correlation levels
plt.subplots(figsize=(8,6))
sns.heatmap(merged_data.loc[:,predictors].corr(),annot=True)
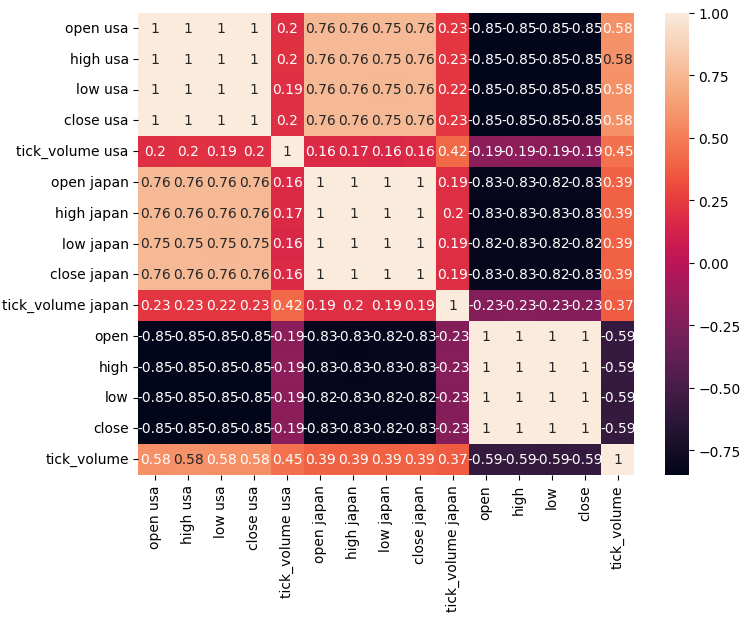
图4:我们的相关矩阵
正如我们所观察到的,美国债券和日本债券之间存在很强的相关性,为0.76。此外,美国和日本的债券证券与USDJPY汇率之间都存在很强的负相关性。
散点图允许我们在二维空间中可视化变量之间的关系,让我们使用从债券市场收集的数据创建散点图。我们将从创建美国国债开盘价与USDJPY汇率开盘价之间的散点图开始。
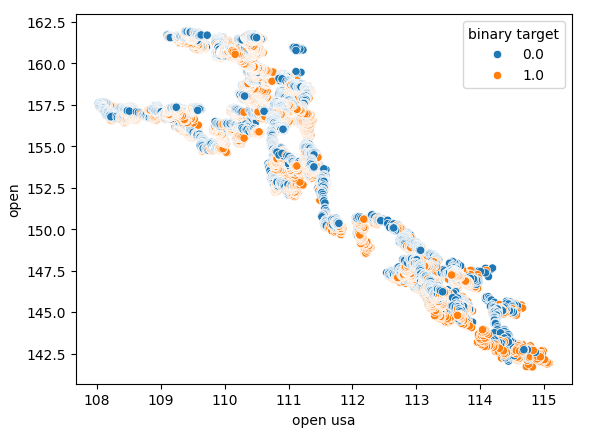
图5:美国债券开盘价与USDJPY开盘价的散点图
正如我们所观察到的,散点图并没有显示出任何清晰的模式或依赖关系。看起来汇率可能会升值或贬值,而不管债券市场发生的变化如何。
我们还使用日本国债开盘价作为x轴,USDJPY汇率开盘价作为y轴,进行了另一张散点图的绘制。遗憾的是,数据中仍然没有显示出任何可见的关系。
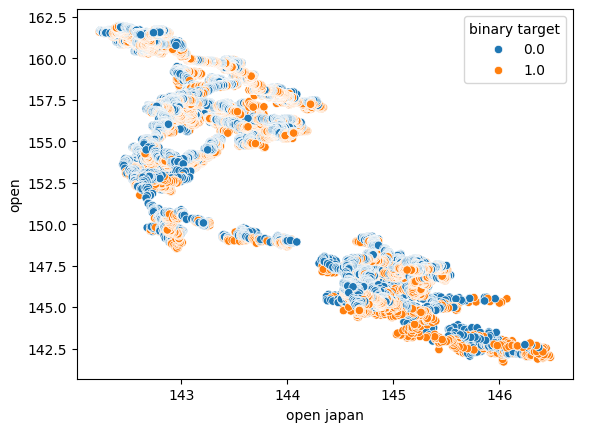
图6:日本国债开盘价与USDJPY开盘价的散点图
我们还尝试创建了另一张散点图,这次在每个轴上分别使用了两种国债。我们使用日本国债开盘价作为x轴,美国国债开盘价作为y轴。我们的散点图没有揭示数据中任何有趣的模式,这可能表明还有其他我们没有考虑的变量也在影响数据。

图7:日本国债开盘价与美国国债开盘价的散点图
让我们也检查一下美国债券市场的成交量与USDJPY汇率收盘价之间是否存在任何关系。遗憾的是,散点图中没有明显的分离,我们观察到许多情况下价格在相同的成交量上上涨和下跌。
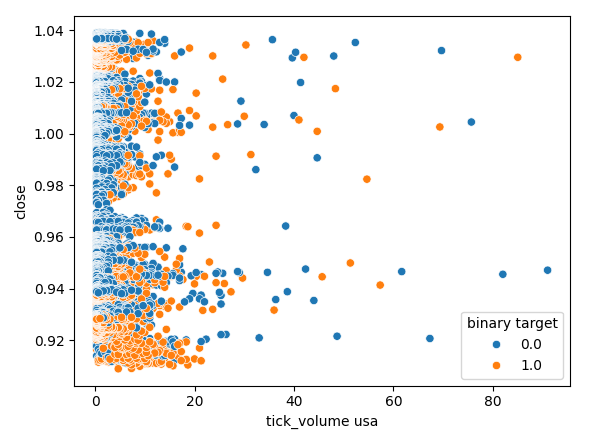
图8:美国国债成交量与USDJPY收盘价的散点图
数据建模
我们现在可以开始对数据进行建模了,我们首先会对数据集进行缩放和标准化。这有助于我们的机器学习模型更有效地学习。
#Scale the data
scaled_data = pd.DataFrame(RobustScaler().fit_transform(merged_data.loc[:,predictors]),columns=predictors)
然后我们将数据集分成两部分,前半部分用于训练和优化我们的模型,后半部分用于验证我们的模型并测试是否过拟合。
#Partition the data
train_X , test_X, train_y, test_y = train_test_split(scaled_data,merged_data.loc[:,target],shuffle=False,test_size=0.5)
为了有效地测试各种模型,我们将模型保存在一个列表中,以便我们可以循环遍历它们,并逐一交叉验证它们的性能。我们还需要创建3个数据结构:
- 第一个将存储仅使用USDJPY市场的常规OHLCV数据时的误差水平。
- 第二个将存储仅依赖于两个债券市场OHLCV数据的误差水平。
- 最后一个将存储当我们整合所有可用数据时的误差水平。
#Model selection
from sklearn.linear_model import LinearRegression , Lasso , SGDRegressor
from sklearn.svm import LinearSVR
from sklearn.ensemble import GradientBoostingRegressor , RandomForestRegressor , BaggingRegressor
from sklearn.neighbors import KNeighborsRegressor
from sklearn.neural_network import MLPRegressor
from sklearn.metrics import mean_squared_error
from sklearn.model_selection import TimeSeriesSplit

#Define the columns
columns = [
    "Linear Model",
    "Lasso",
    "SGD",
    "Linear SV",
    "Gradient Boost",
    "Random Forest",
    "Bagging",
    "K Neighbors",
    "Neural Network"
]

#Define the models
models = [
    LinearRegression(),
    Lasso(),
    SGDRegressor(),
    LinearSVR(),
    GradientBoostingRegressor(),
    RandomForestRegressor(),
    BaggingRegressor(),
    KNeighborsRegressor(),
    MLPRegressor(hidden_layer_sizes=(100,40,20,10),shuffle=False)
]

#Create 2 dataframes to store our error on the training and test sets respectively
ohlc_training_loss = pd.DataFrame(index=np.arange(0,5),columns=columns)
ohlc_validation_loss = pd.DataFrame(index=np.arange(0,5),columns=columns)
bonds_training_loss = pd.DataFrame(index=np.arange(0,5),columns=columns)
bonds_validation_loss = pd.DataFrame(index=np.arange(0,5),columns=columns)
all_training_loss = pd.DataFrame(index=np.arange(0,5),columns=columns)
all_validation_loss = pd.DataFrame(index=np.arange(0,5),columns=columns)
#Create the time-series split object
tscv = TimeSeriesSplit(n_splits=5,gap=look_ahead)
我们将交叉验证每个模型。外部循环将遍历我们可用的每个模型,而内部循环将对每个模型进行交叉验证,并存储各自的训练和测试误差水平。请注意,我们仅在训练集上对模型进行交叉验证。
#Now perform cross validation
for j in np.arange(0,len(models)):
    model = models[j]
    for i,(train,test) in enumerate(tscv.split(train_X)):
        model.fit(train_X.loc[train[0]:train[-1],predictors],train_y.loc[train[0]:train[-1]])
        all_training_loss.iloc[i,j] = mean_squared_error(train_y.loc[train[0]:train[-1]],model.predict(train_X.loc[train[0]:train[-1],predictors]))
        all_validation_loss.iloc[i,j] = mean_squared_error(train_y.loc[test[0]:test[-1]],model.predict(train_X.loc[test[0]:test[-1],predictors]))
让我们现在来看看仅使用USDJPY常规OHLCV数据时的误差水平。正如我们所看到的,在这种特定的设置中,线性模型和线性支持向量回归器的表现都非常出色。
#Our results using the OHLC data
ohlc_validation_loss

图9:我们的OHLCV误差水平
让我们可视化这些结果。我们先从绘制我们在5折交叉验证程序中每个模型表现的折线图开始。
#Visualizing the results of using the OHLC predictors
plt.plot(ohlc_validation_loss)
plt.legend(columns) 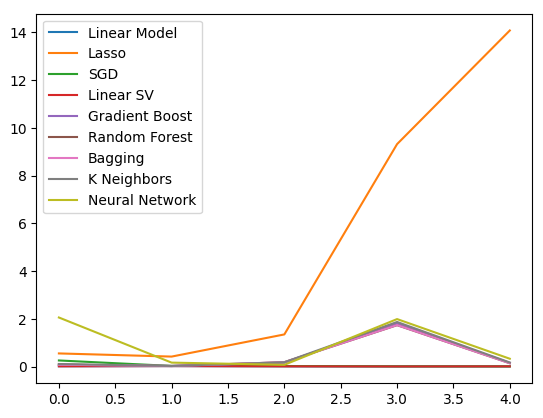
图10:我们的OHLCV误差值的折线图
我们可以清楚地看到,Lasso模型表现最差,其验证误差率明显高于其他模型。然而,尚不清楚哪个模型的误差率最低,我们可以使用箱线图来回答这个问题。
箱线图有助于我们快速识别在这种特定任务中表现良好的模型。正如我们从下面的图中可以看到的,线性回归的平均误差水平最低,而且它看起来很稳定,其异常值也最低。
#Visualizing the results of using the OHLC predictors
fig,axs = plt.subplots(2,4,sharex=True,sharey=True,figsize=(16,10))

for i,ax in enumerate(axs.flat):
    ax.boxplot(ohlc_validation_loss.iloc[:,i])
    ax.set_title(columns[i])
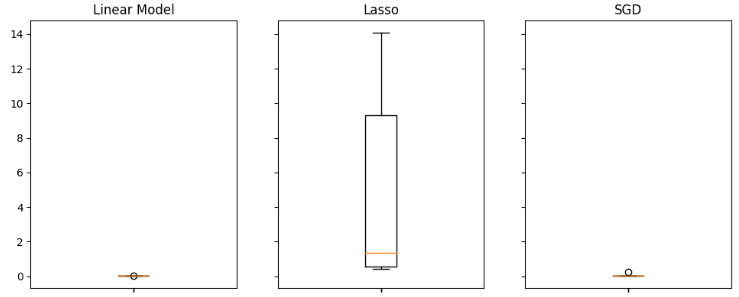
图11:使用常规 USDJPY OHLCV 数据时的部分误差水平
当我们使用与政府债券相关的数据时,模型表现全面下降。然而,线性支持向量回归器(Linear SVR)似乎能够很好地处理这些数据。
#Our results using the bonds data
bonds_validation_loss

图12:使用债券数据时的误差水平
让我们可视化这些结果。
#Visualizing the results of using the bonds predictors
plt.plot(bonds_validation_loss)
plt.legend(columns)
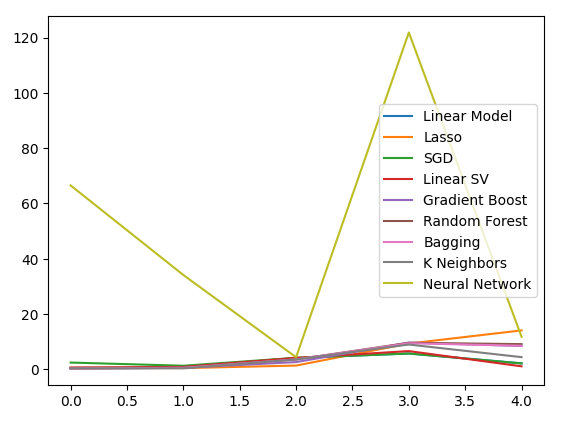
图13:使用债券数据预测USDJPY汇率时的验证误差折线图
我们也可以使用箱线图来评估我们的误差水平。
#Visualizing the results of using the bonds predictors
fig,axs = plt.subplots(2,4,sharex=True,sharey=True,figsize=(16,10))

for i,ax in enumerate(axs.flat):
    ax.boxplot(bonds_validation_loss.iloc[:,i])
    ax.set_title(columns[i])

图14:使用债券市场的OHLCV数据预测USDJPY未来收盘价时的部分误差水平
最后,当我们整合了所有可用数据后,与上一步相比,我们的误差水平有所改善,但与仅使用USDJPY市场报价时的误差水平相比,结果并不令人满意。
#Our results using all the data we have
all_validation_loss

图15:使用所有数据时的误差水平
让我们对模型的表现进行可视化。
#Visualizing the results of using the bonds predictors
plt.plot(all_validation_loss)
plt.legend(columns)
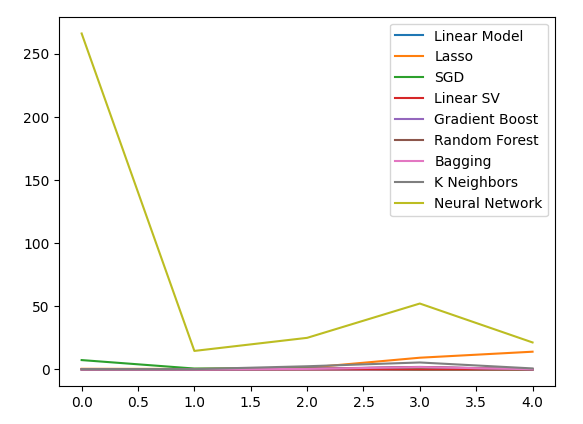
图16:使用所有数据预测USDJPY收盘价时的误差水平
线性回归模型在这里显然是我们最好的选择。然而,它对我们来说没有任何超参数可以调整。因此,我们将选择第二好的模型,线性SVR,并尝试对其进行调整,使其在不过度拟合训练集的情况下超越线性模型。在优化模型之前,让我们评估哪些特征对模型很重要。如果我们的策略是可行的,我们希望我们的特征选择算法能够保留该列。否则,如果债券数据被丢弃,我们可能有理由重新审视该策略。
#Visualizing the results of using the bonds predictors
fig,axs = plt.subplots(2,4,sharex=True,sharey=True,figsize=(16,10))

for i,ax in enumerate(axs.flat):
    ax.boxplot(all_validation_loss.iloc[:,i])
    ax.set_title(columns[i])
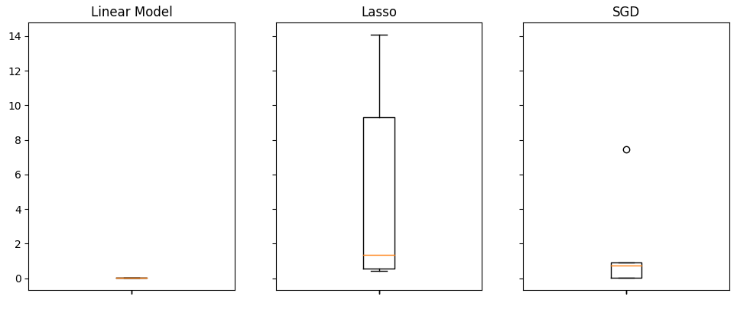
图17:在使用所有可用数据时,我们的线性模型表现最佳
特征选择
让我们首先计算Shapley(SHAP)值。SHAP值是一种指标,旨在告知我们每个输入对模型预测的影响,与每列的基线值相比。例如,考虑一个预测驾驶员获得超速罚单可能性的模型。如果想评估我们的模型是否能够做出合理的预测,我们可能会问:“我们的模型如何解释驾驶员的血液酒精水平很高这一事实?”
显然,我们希望模型预测如果你在酒精的影响下驾驶,获得超速罚单的概率会更高。SHAP值通过将问题重新表述为包含基线值的方式,来帮助我们回答这类问题:“我们的模型如何解释驾驶员的血液酒精水平高于法定限制这一事实?”
通过包含法律限制,我们定义了一个基线。因此,我们通过计算驾驶员的血液酒精水平在法定限制以下和以上时模型预测的差异来计算SHAP值。
让我们导入SHAP库。
#Feature selection
import shap
现在,我们需要训练我们的模型。
#The SVR performed quite well, let's inspect it further
model = LinearSVR()
model.fit(train_X,train_y)
让我们拟合SHAP解释器。
#Calculate SHAP Values
explainer = shap.Explainer(model.predict,test_X)
shap_values = explainer(test_X)
让我们查看SHAP图。
shap.plots.beeswarm(shap_values)

图18:我们线性SVR模型的SHAP值
特征按重要性顺序排列,从顶部开始最重要。因此,根据我们的SHAP解释,USDJPY的收盘价似乎是最重要的特征。此外,我们还可以看到,与政府债券相关的数据紧随货币对的所有价格数据之后。这是支持我们策略的良好证据,我们的SHAP值认为债券数据比USDJPY市场的成交量更重要。
然而,所有模型解释都必须谨慎对待。它们并非不受误差影响。
让我们也考虑后向选择。后向选择算法首先拟合一个完整的模型,并逐步消除特征,直到测试误差不能再被改善。
让我们导入mlxtend库。
#Let's also perform backward selection
from mlxtend.feature_selection import SequentialFeatureSelector as SFS
from mlxtend.plotting import plot_sequential_feature_selection as plot_sfs
初始化模型。
#Reinitialize the model
model = LinearSVR()
创建特征选择对象。
#Prepare the feature selector
sfs = SFS(model,
         k_features=(1,train_X.shape[1]),
         forward=False,
          n_jobs = -1,
          scoring="neg_mean_squared_error",
          cv=5)
拟合特征选择器。
#Fit the feature selector
sfs_results = sfs.fit(train_X,train_y)
让我们看看选中的特征。
#The best features we identified
sfs_results.k_feature_names_
('open usa',
'high usa',
'tick_volume usa',
'open japan',
'low japan',
'close',
'tick_volume')
我们的后向消除算法比SHAP值更重视债券市场数据。因此,我们可以合理地得出结论,我们的债券数据与USDJPY汇率的未来走势之间可能存在一种可靠的关系。
让我们绘制结果。
#Prepare the plot
fig1 = plot_sfs(sfs_results.get_metric_dict(),kind="std_dev")
plt.title("Backward Selection on our Linear SVR")
plt.grid()

图19:我们的后向消除结果
看起来我们模型的误差率并没有剧烈波动,这意味着即使在数据有限的情况下,我们的模型也可能是稳定的。记住,该算法会逐一消除特征,直到通过移除算法所选的每个特征都无法再改善误差率为止。
超参数优调
现在,让我们优化我们的模型,使其超越线性回归模型。首先,导入我们需要的库。
#Parameter tuning
from sklearn.model_selection import RandomizedSearchCV
初始化模型。
#Reinitialize the model
model = LinearSVR()
定义调优器对象。
tuner = RandomizedSearchCV(model,
                          {
                              "epsilon":[0,0.001,0.01,0.1,25,50,100],
                              "tol": [0.1,0.01,0.001,0.0001,0.00001],
                              "C" : [1,5,10,50,100,1000,10000,100000],
                              "loss":["epsilon_insensitive", "squared_epsilon_insensitive"],
                              "fit_intercept": [False,True]
                          },
                           n_jobs=-1,
                           n_iter=100,
                           scoring="neg_mean_squared_error"
                          )
模型调优。
tuner_results = tuner.fit(train_X,train_y)
有意思的是,我们得出的最佳参数几乎与默认设置完全一致。然而,让我们观察一下性能上的差异。
tuner_results.best_params_
{'tol': 0.0001,
'loss': 'epsilon_insensitive',
'fit_intercept': True,
'epsilon': 0,
'C': 1}
过拟合测试
让我们现在测试一下我们是否过度拟合了训练集。我们将实例化我们的模型。#Testing for overfitting baseline_model = LinearRegression() default_model = LinearSVR() customized_model = LinearSVR(tol=0.0001,loss='epsilon_insensitive',fit_intercept=True,epsilon=0,C=1)
现在让我们拟合所有三个模型。
#Fit the models
baseline_model.fit(train_X,train_y)
default_model.fit(train_X,train_y)
customized_model.fit(train_X,train_y)
准备交叉验证每个模型的表现。
我们需要重置数据集索引。
#Let's assess our new accuracy levels
test_y = test_y.reset_index()
test_X.reset_index(inplace=True)
重新定义时间序列拆分对象,并创建一个数据结构来存储我们的验证误差。
#Create our time-series test object
tscv = TimeSeriesSplit(n_splits=5,gap=look_ahead)
overfitting_error = pd.DataFrame(columns=columns,index=np.arange(0,5))

Cross-validate each model.
for j in np.arange(0,len(columns)):
    model = models[j]
    for i , (train,test) in enumerate(tscv.split(test_X)):
        model.fit(test_X.loc[train[0]:train[-1],predictors],test_y.loc[train[0]:train[-1],"target"])
        overfitting_error.iloc[i,j] = mean_squared_error(test_y.loc[test[0]:test[-1],"target"],model.predict(test_X.loc[test[0]:test[-1],predictors]))
让我们来看看结果如何。
#Visualizing the results of using the bonds predictors
fig,axs = plt.subplots(1,3,sharex=True,sharey=True,figsize=(8,4))

for i,ax in enumerate(axs.flat):
    ax.boxplot(overfitting_error.iloc[:,i])
    ax.set_title(columns[i])
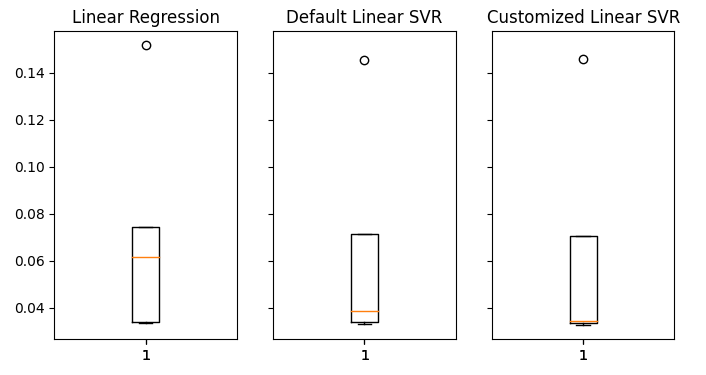
图20:在未知数据上的误差水平
我们可以清楚地看到,我们的线性支持向量回归(LinearSVR)模型在验证中产生了最低的平均误差。因此,我们成功地超越了线性模型设定的基准表现。此外,我们还在不过度拟合训练集的情况下,超越了默认的误差率。
导出到ONNX
现在,让我们准备将模型导出为ONNX格式,以便我们可以轻松地将其集成到MQL5程序中。
在我们继续之前,我们必须首先以一种可以在MQL5中重现的方式标准化我们的数据。我们可以通过从每个相应的列值中减去列的均值,然后将每列除以其标准差来实现这一点。
让我们将相应的值写入到我们终端文件路径中的一个CSV文件中。
#Create scaling factors
scaling_factors = pd.DataFrame(index=("mean","standard deviation"),columns=predictors)

#Write our the values
for i in np.arange(0,scaling_factors.shape[1]):
    scaling_factors.iloc[0,i] = merged_data.loc[:,predictors[i]].mean()
    scaling_factors.iloc[1,i] = merged_data.loc[:,predictors[i]].std()
    merged_data.loc[:,predictors[i]] = ((merged_data.loc[:,predictors[i]] - scaling_factors.iloc[0,i]) / scaling_factors.iloc[1,i])

scaling_factors

图21:缩放因子
现在保存CSV文件。
#Save the scaling factors
scaling_factors.to_csv("C:\\Enter \\Your\\Path\\Here\\MetaQuotes\\Terminal\\D0E82094358C8CF3394F550E51FF075\\MQL5\\Files\\usdjpy scaling factors.csv")
在所有可获取到的数据上训练模型。
#Fit the model on all the data we have
customized_model.fit(merged_data.loc[:,predictors],merged_data.loc[:,"target"])
导入所需的库。
#Let's import the libraries we need
from skl2onnx.common.data_types import FloatTensorType
from skl2onnx import convert_sklearn
import netron
import onnx
定义ONNX模型的输入参数类型和格式。
#Define the initial input types
initial_types = [('float_input',FloatTensorType([1,len(predictors)]))]
创建ONNX模型。
#Create an ONNX representation of the model
onnx_model = convert_sklearn(customized_model,initial_types=initial_types,target_opset=12)
将ONNX模型保存到一个带有.onnx扩展名的文件中。
#Save the ONNX model
onnx_name = "USDJPY M1 FLOAT.onnx"
onnx.save(onnx_model,onnx_name)
让我们在Netron中可视化这个模型。
#Visualize the model
netron.start(onnx_name) 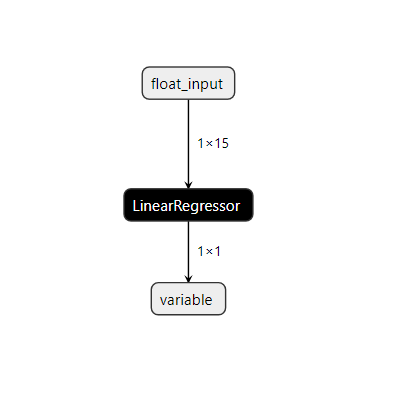
图22:可视化我们的线性SVR模型
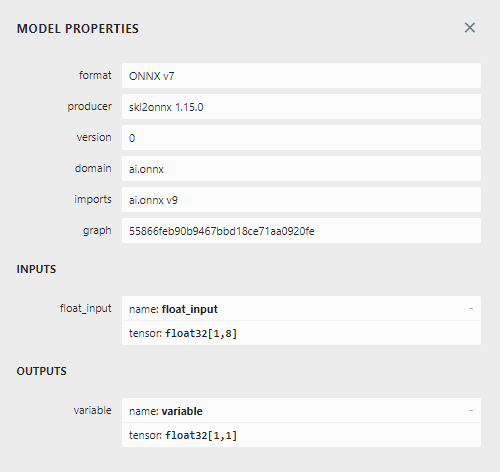
图23:ONNX的输入和输出数据格式
我们的模型的输入和输出格式与我们的规格一致。让我们继续构建EA。
在MQL5中的实现
首先需要将我们的ONNX模型作为一个资源,它将被编译到我们的程序中。//+------------------------------------------------------------------+ //| USDJPY Bonds.mq5 | //| Gamuchirai Ndawana | //| https://www.mql5.com/en/users/gamuchiraindawa | //+------------------------------------------------------------------+ #property copyright "Gamuchirai Ndawana" #property link "https://www.mql5.com/en/users/gamuchiraindawa" #property version "1.00" //+------------------------------------------------------------------+ //| Resources | //+------------------------------------------------------------------+ #resource "\\Files\\USDJPY M1 FLOAT.onnx" as const uchar onnx_model_buffer[];
现在,让我们定义一些在我们程序中需要的全局变量。
//+------------------------------------------------------------------+
//| Global variables                                                 |
//+------------------------------------------------------------------+
long onnx_model;
float mean_values[15],std_values[15];
vector model_output = vector::Zeros(1);
int state = 0;
int prediction = 0;
导入交易库以便我们可以便捷地开立和管理头寸。
//+------------------------------------------------------------------+
//| Libraries                                                        |
//+------------------------------------------------------------------+
#include <Trade/Trade.mqh>
CTrade Trade;
现在,我们将定义一些EA的辅助函数。需要一个函数来加载我们的ONNX模型,并定义其输入和输出的格式。如果在加载过程中有任何步骤失败,我们的函数将返回一个标志,该标志将中断初始化过程。
//+------------------------------------------------------------------+
//| Load our onnx file                                               |
//+------------------------------------------------------------------+
bool load_onnx_file(void)
  {
//--- Create the model from the buffer
   onnx_model = OnnxCreateFromBuffer(onnx_model_buffer,ONNX_DEFAULT);

//--- Set the input shape
   ulong input_shape [] = {1,15};

//--- Check if the input shape is valid
   if(!OnnxSetInputShape(onnx_model,0,input_shape))
     {
      Alert("Incorrect input shape, model has input shape ", OnnxGetInputCount(onnx_model));
      return(false);
     }

//--- Set the output shape
   ulong output_shape [] = {1,1};

//--- Check if the output shape is valid
   if(!OnnxSetOutputShape(onnx_model,0,output_shape))
     {
      Alert("Incorrect output shape, model has output shape ", OnnxGetOutputCount(onnx_model));
      return(false);
     }
//--- Everything went fine
   return(true);
  }
我们还需要一个函数来读取包含缩放值的CSV文件,并将它们存储在一个数组中,以便我们稍后在预测函数中使用。请注意,第一行仅包含列标题。第二行的第一项是索引标签,第二行的第二项是第一列的平均值。因此,我们的函数将检查当前循环迭代,以跟踪它所在的位置以及哪些值是重要的。
//+------------------------------------------------------------------+
//| Load our scaling factors                                         |
//+------------------------------------------------------------------+
void load_scaling_factors(void)
    {
//--- Read in the file
   string file_name = "usdjpy scaling factors.csv";

//--- Try open the file
   int result = FileOpen(file_name,FILE_READ|FILE_CSV|FILE_ANSI,","); //Strings of ANSI type (one byte symbols).

//--- Check the result
   if(result != INVALID_HANDLE)
     {
      Print("Opened the file");
      //--- Store the values of the file

      int counter = 0;
      string value = "";

      while(!FileIsEnding(result) && !IsStopped()) //read the entire csv file to the end
       {

         if (counter > 100) //if you aim to read 10 values set a break point after 10 elements have been read
           break; //stop the reading progress

         value = FileReadString(result);
         Print("Trying to read string: ",value," count value: ",counter);

         //--- Check where we are
         if((counter >= 17) && (counter < 32))
            {
               mean_values[counter - 17] = (float) value;
            }
         //--- Check where we are
         if((counter >= 33) && (counter < 48))
            {
               std_values[counter - 33] = (float) value;
            }
         //--- Reading a new row
         if(FileIsLineEnding(result))
           {
             Print("row++");
           }

         counter++;
       }
      //---Close the file
      ArrayPrint(mean_values);
      ArrayPrint(std_values);
      FileClose(result);
     }
//--- We failed to find the file
else
   {
      Print("Failed to find the file");
   }

  }
这个函数将获取我们的模型输入值,并在从模型获得预测之前对它们进行标准化。随后,模型的预测将被存储为一个二进制状态,1表示看涨预测,2表示看跌。这将帮助我们识别模型何时预测到反转。
//+------------------------------------------------------------------+
//| Obtain a prediction from our model                               |
//+------------------------------------------------------------------+
void model_predict(void)
   {
     //--- Fetch input values
      string symbols[3] = {"UST10Y_U4","JGB10Y_U4","USDJPY"};
      vectorf model_inputs = {iOpen(symbols[0],PERIOD_CURRENT,0),iHigh(symbols[0],PERIOD_CURRENT,0),iLow(symbols[0],PERIOD_CURRENT,0),iClose(symbols[0],PERIOD_CURRENT,0),iTickVolume(symbols[0],PERIOD_CURRENT,0),
                      iOpen(symbols[1],PERIOD_CURRENT,0),iHigh(symbols[1],PERIOD_CURRENT,0),iLow(symbols[1],PERIOD_CURRENT,0),iClose(symbols[1],PERIOD_CURRENT,0),iTickVolume(symbols[1],PERIOD_CURRENT,0),
                      iOpen(symbols[2],PERIOD_CURRENT,0),iHigh(symbols[2],PERIOD_CURRENT,0),iLow(symbols[2],PERIOD_CURRENT,0),iClose(symbols[2],PERIOD_CURRENT,0),iTickVolume(symbols[2],PERIOD_CURRENT,0)
                     };
     //--- Normalize and scale our inputs
     for(int i=0;i < 15;i++)
         {
            model_inputs[i] = ((model_inputs[i] - mean_values[i])/std_values[i]);
         }
     //--- Show the inputs
     Print("Model inputs: ",model_inputs);
     //--- Fetch a forecast from our model
     OnnxRun(onnx_model,ONNX_DEFAULT,model_inputs,model_output);
     //--- Give the user feedback
     Comment("Model forecast: ",model_output[0]);

     //--- Store the prediction
     if(model_output[0] > iClose("USDJPY",PERIOD_CURRENT,0))
         {
            prediction = 1;
         }
     else if(model_output[0] < iClose("USDJPY",PERIOD_CURRENT,0))
         {
            prediction = 2;
         }
   }
我们的初始化过程首先需要成功加载ONNX文件,然后读取缩放值,最后测试模型是否正常工作。
//+------------------------------------------------------------------+
//| Expert initialization function                                   |
//+------------------------------------------------------------------+
int OnInit()
  {

//--- Load the ONNX file
   if(!load_onnx_file())
     {
      //--- We failed to load our onnx model
      return(INIT_FAILED);
     }

//--- Load scaling factors
load_scaling_factors();

//--- Test if our ONNX model works
model_predict();

//--- Everything worked out
   return(INIT_SUCCEEDED);

  }
每当我们的程序不再使用时,必须释放不再需要的资源。
//+------------------------------------------------------------------+
//| Expert deinitialization function                                 |
//+------------------------------------------------------------------+
void OnDeinit(const int reason)
  {
//--- Release the resources we used for our onnx model
   OnnxRelease(onnx_model);
//--- Release the expert advisor
   ExpertRemove();
  }
最后,每当价格水平发生变化时,我们首先会从模型中获取一个预测。如果我们没有任何未平仓头寸,我们将遵循我们模型的预测,并存储一个标志来表示我们当前的未平仓头寸。否则,如果我们已经有未平仓头寸,我们将检查模型的预测是否与我们的未平仓头寸一致,在不一致的情况下,我们将平仓。
//+------------------------------------------------------------------+
//| Expert tick function                                             |
//+------------------------------------------------------------------+
void OnTick()
  {
      //--- Obtain a forecast from our model
      model_predict();

      //--- Check if we have any positions
      if(PositionsTotal() == 0)
         {
            //--- Reset the state of our system
            state = 0;

            //--- Check for an entry
            if(model_output[0] > iClose("USDJPY",PERIOD_CURRENT,0))
               {
                  Trade.Buy(0.3,"USDJPY",SymbolInfoDouble("USDJPY",SYMBOL_ASK),SymbolInfoDouble("USDJPY",SYMBOL_ASK)-2,SymbolInfoDouble("USDJPY",SYMBOL_ASK)+2,"USDJPY Bonds AI");
                  state = 1;
               }

             if(model_output[0] < iClose("USDJPY",PERIOD_CURRENT,0))
               {
                  Trade.Sell(0.3,"USDJPY",SymbolInfoDouble("USDJPY",SYMBOL_BID),SymbolInfoDouble("USDJPY",SYMBOL_ASK)+2,SymbolInfoDouble("USDJPY",SYMBOL_ASK)-2,"USDJPY Bonds AI");
                  state = 2;
               }
         }

      //--- Check for reversals
      if(state != prediction)
         {
            Alert("Reversal detected by the AI system!");
            Trade.PositionClose("USDJPY");
         }
  }
//+------------------------------------------------------------------+
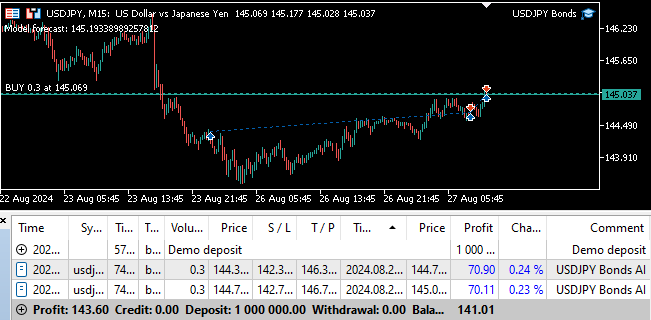
图24:前向测试
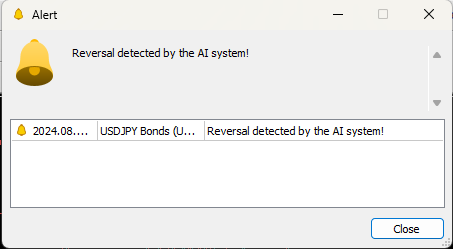
图25:我们的EA可以在检测到反转时自动平仓
结论
在本文中,我们展示了如何利用人工智能为经典交易策略注入新的活力。我们的策略是否值得如此复杂,尚有待商榷。实际上,我们本可以采用一个更简单的模型,即便那样可能会得到较低的准确率。因此,我们可以合理地得出结论,除非我们投入更多的时间去优化特征,以更清晰地揭示其中的关系,否则,采用一个仅基于普通市场报价的更简单策略,可能才是更为明智的选择。
本文由MetaQuotes Ltd译自英文
原文地址: https://www.mql5.com/en/articles/15719
 开发回放系统(第 60 部分):玩转服务(一)
 新手在交易中的10个基本错误
 禁忌搜索(TS)
