
重塑经典策略(第六部分):多时间框架分析
概述
现代投资者可以利用人工智能(AI)来增强其交易决策的潜力是无穷的。遗憾的是,在决定将您辛苦赚来的资本托付给哪种策略之前,您不太可能评估完所有这些策略。在这一系列文章中,我们将探讨交易策略,以评估我们是否可以用AI改进这些策略。我们的目标是为你提供所需的信息,以便你能够做出明智的决定,判断这种策略是否适合你个人的投资者概况。
交易策略概述
在本文中,我们将重新审视一个广为人知的多时间框架分析策略。全球许多成功的交易者都坚信,在做出投资决策之前,分析多个时间框架是有益的。这种策略有许多不同的变体。然而,它们都倾向于坚持一个普遍的理念,即在较高时间框架上识别出的趋势,将在所有较低的时间框架上持续存在。
例如,如果我们观察到日线图上出现了看涨的价格行为,那么我们合理地期望在小时图上看到看涨的价格趋势。该策略还将这一理念进一步扩展,根据该策略,我们应该更重视与较高时间框架上观察到的趋势一致的价格波动。
换句话说,回到我们的简单实例中,如果我们观察到日线图上出现了上升趋势,那么我们会在小时图上更倾向于寻找买入机会,并且我们会不情愿地采取与日线图上观察到的趋势相反的头寸。
一般来说,当较高时间框架上观察到的趋势发生反转时,这种策略就会失效。这通常是因为反转最初只会在较低的时间框架上出现。回想一下,在使用这种策略时,对于与较高时间框架相反的较低时间框架上观察到的波动,通常不会给予太多重视。因此,遵循这种策略的交易者通常会在较高的时间框架上等待明显的反转。因此,在等待较高时间框架的确认时,可能会经历价格的大幅波动。
方法论概述
为了实证评估这一策略的优点,我们不得不从我们的MetaTrader 5终端仔细提取有意义的数据。本文的目标是预测20分钟后欧元兑美元(EURUSD)的未来收盘价。为了实现这一目标,我们创建了3组预测变量:
- 常规的开盘价、最高价、最低价和收盘价信息。
- 较高时间框架上的价格水平变化。
- 上述两组的超集。
我们观察到常规价格数据与较高时间框架上的价格变化之间的相关性相对较弱。我们观察到的最强相关性出现在15分钟(M15)的价格变化与1分钟(M1)的价格水平之间,大约为-0.1。
我们创建了一个包含各种模型的大型集合,并基于全部3组预测变量进行训练,以观察精度的变化。我们发现,使用第一组预测变量(常规市场数据)时,误差水平最低。从我们的观察来看,线性回归模型表现最佳,其次是梯度提升回归器(GBR)模型。
由于线性模型没有太多我们感兴趣的调整参数,因此我们选择了GBR模型作为候选解决方案,而线性模型的误差水平则成为性能基准。我们当前的目标是优化GBR模型,使其超越线性模型设定的基准性能。
在开始优化过程之前,我们使用后向选择算法进行了特征选择。所有与较高时间框架上的价格变化相关的特征都被算法舍弃,这可能表明这种关系不可靠,或者我们也可以解释为以无意义的方式将这种关联呈现给模型。
我们使用了1000次迭代的随机搜索算法来寻找GBR模型的最佳设置。随后,我们利用随机搜索的结果作为起点,使用有限记忆Broyden-Fletcher-Goldfarb-Shanno(L-BFGS-B)算法对GBR的连续参数进行局部优化。
我们在验证数据上未能超越默认的GBR模型,这可能表明我们对训练数据过度拟合。此外,我们在验证中也未能超过线性模型的基准性能。
数据提取
我创建了一个用于从我们的MetaTrader 5终端提取数据的MQL5脚本。该脚本还将从一系列较高时间框架中获取价格变化,并将文件输出到路径:“MetaTrader 5\MQL5\Files...”
//+------------------------------------------------------------------+
//|                                                      ProjectName |
//|                                      Copyright 2020, CompanyName |
//|                                       http://www.companyname.net |
//+------------------------------------------------------------------+
#property copyright "Gamuchirai Zororo Ndawana"
#property link      "https://www.mql5.com/en/users/gamuchiraindawa"
#property version   "1.00"
#property script_show_inputs

//---Amount of data requested
input int size = 5; //How much data should we fetch?

//+------------------------------------------------------------------+
//|                                                                  |
//+------------------------------------------------------------------+
void OnStart()
  {
//---File name
   string file_name = "Market Data " + Symbol() + " multiple timeframe 20 step look ahead .csv";

//---Write to file
   int file_handle=FileOpen(file_name,FILE_WRITE|FILE_ANSI|FILE_CSV,",");

   for(int i= -1;i<=size;i++)
     {
      if(i == -1)
        {
         FileWrite(file_handle,"Time","Open","High","Low","Close","M5","M15","M30","H1","D1");
        }

      else
        {
         FileWrite(file_handle,iTime(Symbol(),PERIOD_CURRENT,i),
                   iOpen(Symbol(),PERIOD_CURRENT,i),
                   iHigh(Symbol(),PERIOD_CURRENT,i),
                   iLow(Symbol(),PERIOD_CURRENT,i),
                   iClose(Symbol(),PERIOD_CURRENT,i),
                   (iClose(Symbol(),PERIOD_M5,i) - iClose(Symbol(),PERIOD_M5,i+20)),
                   (iClose(Symbol(),PERIOD_M15,i) - iClose(Symbol(),PERIOD_M15,i+20)),
                   (iClose(Symbol(),PERIOD_M30,i) - iClose(Symbol(),PERIOD_M30,i+20)),
                   (iClose(Symbol(),PERIOD_H1,i) - iClose(Symbol(),PERIOD_H1,i+20)),
                   (iClose(Symbol(),PERIOD_D1,i) - iClose(Symbol(),PERIOD_D1,i+20))
                  );
        }
     }
//--- Close the file
FileClose(file_handle);
  }
//+------------------------------------------------------------------+
读取数据
让我们先加载我们需要的库。
import pandas as pd
imort numpy as np
请注意,数据是从接近现在的时间点向过去的时间点运行的。我们需要将数据反转,使其从过去向接近现在的时间点运行。
#Let's format the data so it starts with the oldest date
market_data = market_data[::-1]
market_data.reset_index(inplace=True)
现在我们将定义预测范围。
look_ahead = 20 标记数据。我们的目标是欧元兑美元(EURUSD)的未来收盘价。
#Let's label the data
market_data["Target"] = market_data["Close"].shift(-look_ahead)
现在让我们删除任何包含缺失值的行。
#Drop rows with missing values
market_data.dropna(inplace=True)
探索性数据分析
相关性水平分析。
#Let's see if there is any correlation
market_data.iloc[:,2:-1].corr()
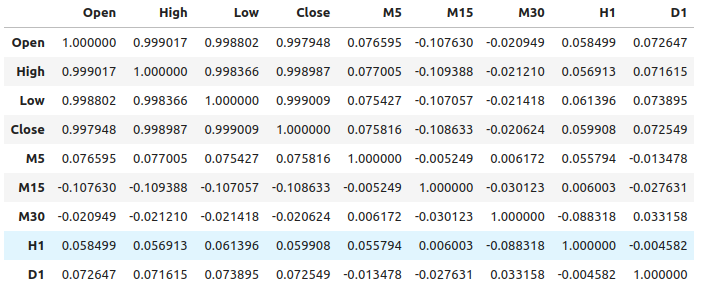
图1:不同时间框架下的相关性水平
如我们所见,我们的数据集中存在中等程度的弱相关性。请注意,相关性并不一定证明被观察变量之间存在关系。
互信息(Mutual Information)是衡量一个预测变量解释目标变量潜力的指标。让我们先考虑一个已知的对预测目标具有很强潜力的变量:开盘价。
from sklearn.feature_selection import mutual_info_regression
现在,作为一个基准,这是一个很好的互信息(MI)得分。
#MI Score for the Open price
print(f'Open price has MI score: {mutual_info_regression(market_data.loc[:,["Open"]],market_data.loc[:,"Target"])[0]}') 让我们来看看M5时间框架上的价格变化与M1时间框架上的未来价格之间的互信息(MI)得分。
#MI Score for the M5 change in price
print(f'M5 change in price has MI score: {mutual_info_regression(market_data.loc[:,["M5"]],market_data.loc[:,"Target"])[0]}') 我们的互信息(MI)得分明显较小,这意味着我们可能以无意义的方式揭示了这种关系,或者不同时间框架上的价格水平之间根本不存在依赖关系!
#MI Score for the M15 change in price
print(f'M15 change in price has MI score: {mutual_info_regression(market_data.loc[:,["M15"]],market_data.loc[:,"Target"])[0]}') 对于我们选择的其他时间框架,情况也是如此。
建模关系
让我们来定义预测变量和目标变量。
#Let's define our predictors and our target
ohlc_predictors = [
        "Open",
        "High",
        "Low",
        "Close"
]

time_frame_predictors = [
        "M5",
        "M15",
        "M30",
        "H1",
        "D1"
]

all_predictors = ohlc_predictors + time_frame_predictors

target = "Target"
现在我们导入所需的库。
#Import the libraries we need
from sklearn.linear_model import LinearRegression
from sklearn.linear_model import SGDRegressor
from sklearn.ensemble import RandomForestRegressor
from sklearn.ensemble import BaggingRegressor
from sklearn.ensemble import GradientBoostingRegressor
from sklearn.ensemble import AdaBoostRegressor
from sklearn.neighbors import KNeighborsRegressor
from sklearn.svm import LinearSVR
from sklearn.neural_network import MLPRegressor
from sklearn.model_selection import TimeSeriesSplit,RandomizedSearchCV
from sklearn.metrics import root_mean_squared_error
from sklearn.preprocessing import RobustScaler
定义时间序列拆分对象的参数。
#Define the time series split object
gap = look_ahead
splits = 10
现在让我们准备模型,并创建数据帧来存储我们的精度水平。这样一来,我们就可以观察随着模型输入改变时精度的变化。
#Store our models in a list
models = [
        LinearRegression(),
        SGDRegressor(),
        RandomForestRegressor(),
        BaggingRegressor(),
        GradientBoostingRegressor(),
        AdaBoostRegressor(),
        KNeighborsRegressor(),
        LinearSVR(),
        MLPRegressor(hidden_layer_sizes=(10,4),early_stopping=True),
        MLPRegressor(hidden_layer_sizes=(100,20),early_stopping=True)
]

#Create a list of column titles for each model
columns = [
        "Linear Regression",
        "SGD Regressor",
        "Random Forest Regressor",
        "Bagging Regressor",
        "Gradient Boosting Regressor",
        "AdaBoost Regressor",
        "K Neighbors Regressor",
        "Linear SVR",
        "Small Neural Network",
        "Large Neurla Network"
]

#Create data frames to store our accuracy
ohlc_accuracy = pd.DataFrame(index=np.arange(0,10),columns=columns)
multiple_time_frame_accuracy = pd.DataFrame(index=np.arange(0,10),columns=columns)
all_accuracy = pd.DataFrame(index=np.arange(0,10),columns=columns)
现在让我们准备预测变量和缩放数据。
#Preparing to perform cross validation
current_predictors = all_predictors
scaled_data = pd.DataFrame(RobustScaler().fit_transform(market_data.loc[:,all_predictors]),columns=all_predictors)
创建时间序列拆分对象。
#Create the time series split object
tscv = TimeSeriesSplit(gap=gap,n_splits=splits)
现在我们将执行交叉验证。第一个循环遍历我们之前创建的模型列表,第二个循环依次对每个模型进行交叉验证。
#First we will iterate over all the available models
for i in np.arange(0,len(models)):
        #First select the model
        model = models[i]
        #Now we will cross validate this current model
        for j , (train,test) in enumerate(tscv.split(scaled_data)):
        #First define the train and test data
        train_X = scaled_data.loc[train[0]:train[-1],current_predictors]
        train_y = market_data.loc[train[0]:train[-1],target]
        test_X = scaled_data.loc[test[0]:test[-1],current_predictors]
        test_y = market_data.loc[test[0]:test[-1],target]
        #Now we will fit the model
        model.fit(train_X,train_y)
        #And finally record the accuracy
        all_accuracy.iloc[j,i] = root_mean_squared_error(test_y,model.predict(test_X))
使用常规输入时模型的精度水平。
ohlc_accuracy
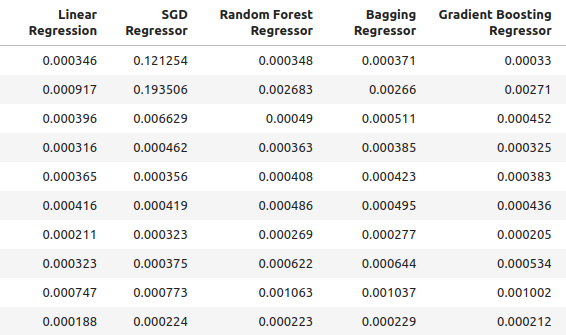
图2:正常的精度水平。
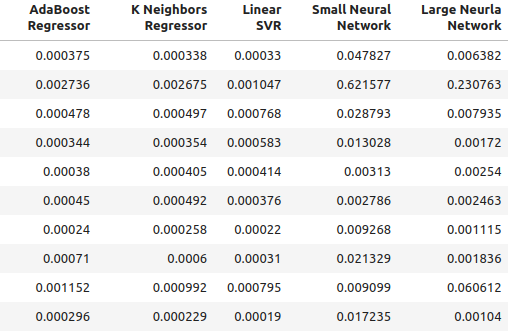
图3:正常的精度水平(2)
for i in np.arange(0,ohlc_accuracy.shape[1]):
    print(f"{columns[i]} had error levels {ohlc_accuracy.iloc[:,i].mean()}")
线性回归的误差水平为:0.00042256332959154886
SGD 回归器的误差水平为:0.0324320107406244
随机森林回归器的误差水平为:0.0006954883552094012
Bagging回归器的误差水平为:0.0007030697054783931
梯度提升回归器的误差水平为:0.0006588749449742309
AdaBoost回归器的误差水平为:0.0007159624774453208
K近邻回归器的误差水平为:0.0006839218661791973
线性支持向量回归器(SVR)的误差水平为:0.000503277800807813
小型神经网络的误差水平为:0.07740701832606754
大型神经网络的误差水平为:0.03164056895135391
使用我们创建的新输入时的精度。
multiple_time_frame_accuracy
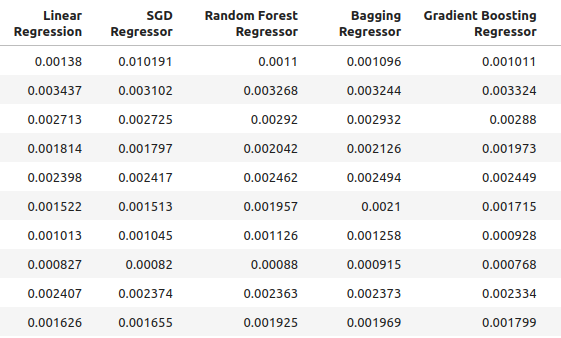
图4:最新的精度水平
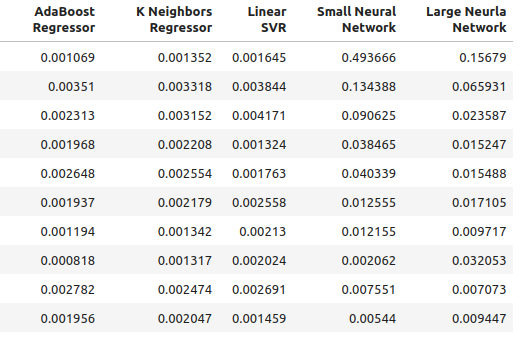
图5:最新的精度水平(2)
for i in np.arange(0,ohlc_accuracy.shape[1]):
    print(f"{columns[i]} had error levels {multiple_time_frame_accuracy.iloc[:,i].mean()}")
线性回归的误差水平为:0.001913639795583766
SGD 回归器的误差水平为:0.0027638553835377206
随机森林回归器的误差水平为:0.0020041047670504254
Bagging回归器的误差水平为:0.0020506512726394415
梯度提升回归器的误差水平为:0.0019180687958290775
AdaBoost回归器的误差水平为:0.0007159624774453208
K近邻回归器的误差水平为:0.0021943350208868213
线性支持向量回归器(SVR)的误差水平为:0.0023609474919917338
小型神经网络的误差水平为:0.08372469596701271
大型神经网络的误差水平为:0.035243897461061074
最后,让我们观察一下使用所有可用预测变量时的精度。
all_accuracy
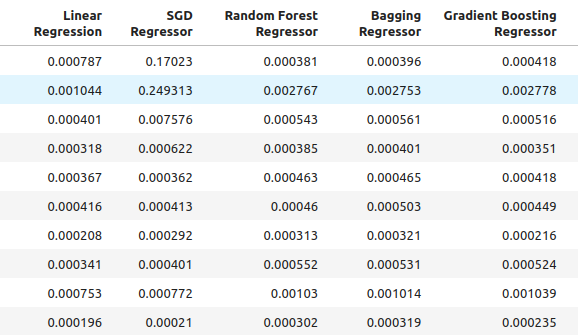
图6:使用所有预测变量时的精度水平。
for i in np.arange(0,ohlc_accuracy.shape[1]):
    print(f"{columns[i]} had error levels {all_accuracy.iloc[:,i].mean()}")
线性回归的误差水平为:0.00048307488099524497
SGD 回归器的误差水平为:0.043019079499194125
随机森林回归器的误差水平为:0.0006954883552094012
Bagging回归器的误差水平为:0.0007263444909545053
梯度提升回归器的误差水平为:0.0006943964783049555
AdaBoost回归器的误差水平为:0.0007217149661087063
K近邻回归器的误差水平为:0.000872811528292862
线性支持向量回归器(SVR)的误差水平为:0.0006457525216512596
小型神经网络的误差水平为:0.08372469596701271
大型神经网络的误差水平为:0.06774795252887988
正如大家所见,线性模型在所有测试中的表现最佳。此外,当使用常规的开盘价、最高价、最低价和收盘价(OHLC)数据时,它的表现最为出色。然而,该模型并不包含我们感兴趣的参数调整。因此,我们将选择排名第二的模型——梯度提升回归器(GBR),并尝试超越线性模型。
特征选择
现在让我们看看哪些特征对我们的梯度提升回归器(GBR)模型最为重要。
#Feature selection
from mlxtend.feature_selection import SequentialFeatureSelector as SFS
选择模型。
#We'll select the Gradient Boosting Regressor as our chosen model
model = GradientBoostingRegressor()
我们将使用后向选择算法。我们从一个包含所有预测变量的模型开始,并逐步逐一删除特征。只有当删除某个特征能够改善模型的性能时,我们才会将其删除。
#Let us prepare the Feature Selector Object
sfs = SFS(model,
        k_features=(1,len(all_predictors)),
        forward=False,
        n_jobs=-1,
        scoring="neg_root_mean_squared_error",
        cv=10
        )
执行特征选择。
#Select the best feature
sfs_results = sfs.fit(scaled_data.loc[:,all_predictors],market_data.loc[:,"Target"])
该算法仅保留了最高价,并丢弃了所有其他特征。
#The best feature we found
sfs_results.k_feature_names_
让我们来可视化结果。
#Prepare the plot
fig1 = plot_sfs(sfs_results.get_metric_dict(),kind="std_dev")
plt.title("Backward Selection on Gradient Boosting Regressor")
plt.grid()
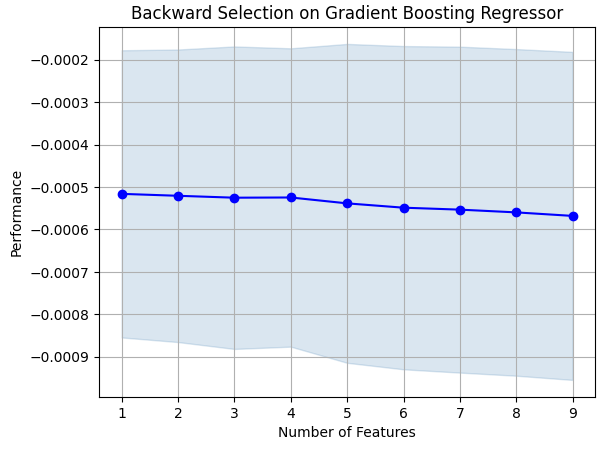
图7:可视化特征选择过程
正如大家所见,我们的模型大小和误差水平成正比。换句话说,随着模型规模的增大,误差水平也随之增大。
参数调整
现在让我们对GBR模型进行参数调整。我们已经确定了模型中有11个参数需要调整,并且在终止优化过程之前,我们将允许调整对象进行1000次迭代。
#Let us try to tune our model
from sklearn.model_selection import RandomizedSearchCV
在开始调整模型之前,让我们将数据分成两部分。其中一半用于训练和优化我们的模型,另一半用于验证以及检测是否过拟合。
#Before we try to tune our model, let's first create a train and test set
train_X = scaled_data.loc[:(scaled_data.shape[0]//2),:]
train_y = market_data.loc[:(market_data.shape[0]//2),"Target"]
test_X = scaled_data.loc[(scaled_data.shape[0]//2):,:]
test_y = market_data.loc[(market_data.shape[0]//2):,"Target"]
定义调整对象。
#Time the process
import time

start_time = time.time()

#Prepare the tuning object
tuner = RandomizedSearchCV(GradientBoostingRegressor(),
                        {
                                "loss": ["squared_error","absolute_error","huber"],
                                "learning_rate": [0,(10.0 ** -1),(10.0 ** -2),(10.0 ** -3),(10.0 ** -4),(10.0 ** -5),(10.0 ** -6),(10.0 ** -7)],
                                "n_estimators": [5,10,25,50,100,200,500,1000],
                                "max_depth": [1,2,3,5,9,10],
                                "min_samples_split":[0.1,0.2,0.3,0.4,0.5,0.6,0.7,0.8,0.9,1.0],
                                "criterion":["friedman_mse","squared_error"],
                                "min_samples_leaf":[0.1,0.2,0.3,0.4,0.5,0.6,0.7,0.8,0.9],
                                "min_weight_fraction_leaf":[0.0,0.1,0.2,0.3,0.4,0.5],
                                "max_features":[1,2,3,4,5,20],
                                "max_leaf_nodes": [2,3,4,5,10,20,50,90,None],
                                "min_impurity_decrease": [0,1,10,(10.0 ** 2),(10.0 ** 3),(10.0 ** 4)]
                        },
                        cv=5,
                        n_iter=1000,
                        return_train_score=False,
                        scoring="neg_mean_squared_error"
                        )
调整GBR模型。
#Tune the GradientBoostingRegressor
tuner.fit(train_X,train_y)

end_time = time.time()

print(f"Process completed in {end_time - start_time} seconds.")
让我们按从最好到最坏的顺序查看结果。
#Let's observe the results
tuner_results = pd.DataFrame(tuner.cv_results_)
params = ["param_loss",
          "param_learning_rate",
          "param_n_estimators",
          "param_max_depth",
          "param_min_samples_split",
          "param_criterion",
          "param_min_samples_leaf",
          "param_max_features",
          "param_max_leaf_nodes",
          "param_min_impurity_decrease",
          "param_min_weight_fraction_leaf",
          "mean_test_score"]
tuner_results.loc[:,params].sort_values(by="mean_test_score",ascending=False)

图8:部分最佳结果。

图9:部分最佳结果(2)

图10:部分最佳结果(3)
我们找到的最佳参数。
#Best parameters we found
tuner.best_params
{'n_estimators': 500,
'min_weight_fraction_leaf': 0.0,
'min_samples_split': 0.4,
'min_samples_leaf': 0.1,
'min_impurity_decrease': 1,
'max_leaf_nodes': 10,
'max_features': 2,
'max_depth': 3,
'loss': 'absolute_error',
'learning_rate': 0.01,
'criterion': 'friedman_mse'}
更深入的参数调整

图11:SciPy标识
SciPy是一个用于科学计算的Python库。SciPy代表科学Python。让我们看一下是否能找到更好的参数。我们将使用SciPy的优化库,尝试找到能够提升模型性能的参数。
#Let's see if we can't find better parameters
#We may be overfitting the training data!
from scipy.optimize import minimize
要使用SciPy优化库,我们需要定义一个目标函数。我们的目标函数将是模型在训练集上通过交叉验证所达到的误差水平的平均值。我们的SciPy优化器将搜索能够降低训练误差的系数。
#Define the objective function
def objective(x):
        #Create a dataframe to store our new accuracy
        current_error = pd.DataFrame(index=[0],columns=["error"])
        #x is an array of possible values to use for our Gradient Boosting Regressor
        model = GradientBoostingRegressor(n_estimators=500,
                                        min_impurity_decrease=1,
                                        max_leaf_nodes=10,
                                        max_features=2,
                                        max_depth=3,
                                        loss="absolute_error",
                                        criterion="friedman_mse",
                                        min_weight_fraction_leaf=x[0],
                                        min_samples_split=x[1],
                                        min_samples_leaf=x[2],
                                        learning_rate=x[3])
        model.fit(train_X.loc[:,:],train_y.loc[:])
        current_error.iloc[0,0] = root_mean_squared_error(train_y.loc[:],model.predict(train_X.loc[:,:]))
        #Record our progress
        mean_error = current_error.loc[:].mean()
        #Return the average error
        return mean_error
现在让我们开始优化过程。请注意,GBR模型中的一些参数不允许负值,而我们的SciPy优化器会传递负值,除非为优化器指定边界。此外,优化器希望我们给它设定一个起点。我们将使用前一个优化算法的终点作为当前优化器的起点。
#Let's optimize these parameters again
#Fist define the bounds
bounds = ((0.0,0.5),(0.3,0.5),(0.001,0.2),(0.001,0.1))

#Then define the starting points for the L-BFGS-B algorithm
pt = np.array([tuner.best_params_["min_weight_fraction_leaf"],
                tuner.best_params_["min_samples_split"],
                tuner.best_params_["min_samples_leaf"],
                tuner.best_params_["learning_rate"]
                ])
训练误差最小化。
lbfgs = minimize(objective,pt,bounds=bounds,method="L-BFGS-B")
让我们看一下结果。
lbfgs
success: True
status: 0
fun: 0.0005766670348377334
x: [ 5.586e-06 4.000e-01 1.000e-01 1.000e-02]
nit: 3
jac: [-6.216e+00 -4.871e+02 -2.479e+02 8.882e+01]
nfev: 180
njev: 36
hess_inv: <4x4 LbfgsInvHessProduct with dtype=float64>
过拟合测试
现在让我们来比较两个定制模型的精度与默认GBR模型的精度。此外,我们还将关注是否超越了线性模型。
#Let us now see how well we're performing on the validation set
linear_regression = LinearRegression()
default_gbr = GradientBoostingRegressor()
grid_search_gbr = GradientBoostingRegressor(n_estimators=500,
                                        min_impurity_decrease=1,
                                        max_leaf_nodes=10,
                                        max_features=2,
                                        max_depth=3,
                                        loss="absolute_error",
                                        criterion="friedman_mse",
                                        min_weight_fraction_leaf=0,
                                        min_samples_split=0.4,
                                        min_samples_leaf=0.1,
                                        learning_rate=0.01
                                        )
lbfgs_grid_search_gbr = GradientBoostingRegressor(
                                        n_estimators=500,
                                        min_impurity_decrease=1,
                                        max_leaf_nodes=10,
                                        max_features=2,
                                        max_depth=3,
                                        loss="absolute_error",
                                        criterion="friedman_mse",
                                        min_weight_fraction_leaf=lbfgs.x[0],
                                        min_samples_split=lbfgs.x[1],
                                        min_samples_leaf=lbfgs.x[2],
                                        learning_rate=lbfgs.x[3]
                                        )
使用线性模型时的精度。
#Linear Regression
linear_regression.fit(train_X,train_y)
root_mean_squared_error(test_y,linear_regression.predict(test_X)) 使用默认GBR模型时的精度。
#Default Gradient Boosting Regressor
default_gbr.fit(train_X,train_y)
root_mean_squared_error(test_y,default_gbr.predict(test_X)) 使用通过随机搜索定制GBR模型时的精度。
#Random Search Gradient Boosting Regressor
grid_search_gbr.fit(train_X,train_y)
root_mean_squared_error(test_y,grid_search_gbr.predict(test_X)) 使用通过随机搜索和L-BFGS-B定制GBR模型时的精度。
#L-BFGS-B Random Search Gradient Boosting Regressor
lbfgs_grid_search_gbr.fit(train_X,train_y)
root_mean_squared_error(test_y,lbfgs_grid_search_gbr.predict(test_X))
正如我们所见,我们未能超越线性模型。此外,我们也未能超越默认的GBR模型。因此,为了演示,我们将继续使用默认的GBR模型。然而,需要注意的是,选择线性模型会给我们带来更高的精度。
导出到ONNX
开放神经网络交换(ONNX)是一种协议,允许我们将机器学习模型表示为由节点和边组成的计算图。其中节点代表数学运算,边代表数据流。通过将我们的机器学习模型导出为ONNX格式,我们能够轻松地将AI模型应用于EA中。
让我们准备好导出ONNX模型。
#We failed to beat the linear regression model, in such cases we should pick the linear model!
#However for demonstrational purposes we'll pick the gradient boosting regressor
#Let's export the default GBR to ONNX format
from skl2onnx.common.data_types import FloatTensorType
from skl2onnx import convert_sklearn
import onnx
现在我们需要以一种可以在MetaTrader 5中重现的方式对数据进行缩放。最简单的转换方式是减去均值,然后除以标准差。
#We need to save the scale factors for our inputs
scale_factors = pd.DataFrame(index=["mean","standard deviation"],columns=all_predictors)

for i in np.arange(0,len(all_predictors)):
        scale_factors.iloc[0,i] = market_data.iloc[:,i+2].mean()
        scale_factors.iloc[1,i] = market_data.iloc[:,i+2].std()
        market_data.iloc[:,i+2] = ((market_data.iloc[:,i+2] - market_data.iloc[:,i+2].mean()) / market_data.iloc[:,i+2].std())

scale_factors

图12:我们的缩放因子
定义我们ONNX模型的输入类型。
#Define our initial types
initial_types = [("float_input",FloatTensorType([1,test_X.shape[1]]))]
基于我们现有的全部数据拟合模型。
#Fit the model on all the data we have
model = GradientBoostingRegressor().fit(market_data.loc[:,all_predictors],market_data.loc[:,"Target"])
创建ONNX表示形式。
#Create the ONNX representation
onnx_model = convert_sklearn(model,initial_types=initial_types,target_opset=12)
保存ONNX模型。
#Now save the ONNX model
onnx_model_name = "GBR_M1_MultipleTF_Float.onnx"
onnx.save(onnx_model,onnx_model_name)
可视化模型
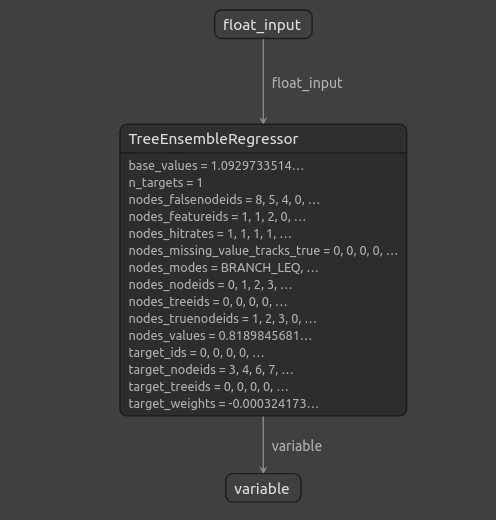
Netron是一个用于检查机器学习模型的开源可视化工具。目前,Netron仅支持有限数量的框架。然而,随着时间的推移和库的不断完善,它将扩展对不同机器学习框架的支持。
导入我们需要的库。
#Import netron so we can visualize the model
import netron
启动Netron。
netron.start(onnx_model_name)
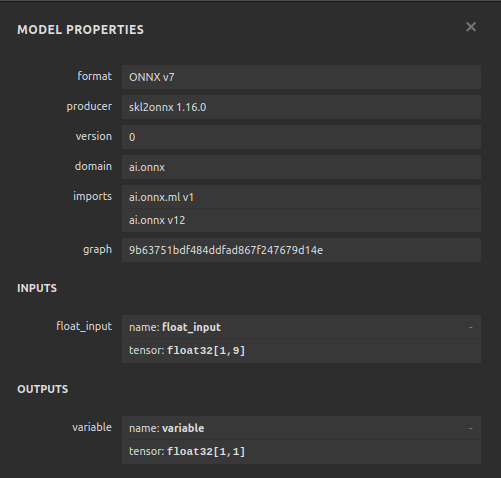
图13:我们的梯度提升回归器ONNX模型属性
 \
\
图14:我们的梯度提升回归器的结构
正如我们所见,ONNX模型的输入和输出形状正如我们所期望的那样,这让我们有信心继续并基于ONNX模型构建EA。
在MQL5中实现
要开始构建带有集成AI模块的EA,我们首先需要引入ONNX模型。//+------------------------------------------------------------------+ //| Multiple Time Frame.mq5 | //| Gamuchirai Zororo Ndawana | //| https://www.mql5.com/en/gamuchiraindawa | //+------------------------------------------------------------------+ #property copyright "Gamuchirai Zororo Ndawana" #property link "https://www.mql5.com/en/gamuchiraindawa" #property version "1.00" //+------------------------------------------------------------------+ //| Require the onnx file | //+------------------------------------------------------------------+ #resource "\\Files\\GBR_M1_MultipleTF_Float.onnx" as const uchar onnx_model_buffer[];
现在我们将加载交易库。
//+------------------------------------------------------------------+
//| Libraries we need                                                |
//+------------------------------------------------------------------+
#include <Trade/Trade.mqh>
CTrade Trade;
让我们定义终端用户可以更改的输入。
//+------------------------------------------------------------------+
//| Inputs                                                           |
//+------------------------------------------------------------------+
input double max_risk = 20;               //How much profit/loss should we allow before closing
input double sl_width = 1;                //How wide should out sl be?
现在我们将定义将在整个程序中使用的全局变量。
//+------------------------------------------------------------------+
//| Global variables                                                 |
//+------------------------------------------------------------------+
long onnx_model;                          //Our onnx model
double mean_variance[9],std_variance[9];  //Our scaling factors
vector model_forecast = vector::Zeros(1); //Model forecast
vector model_inputs = vector::Zeros(9);   //Model inputs
double ask,bid;                           //Market prices
double trading_volume;                    //Our trading volume
int lot_multiple = 20;                    //Our lot size
int state = 0;                            //System state
让我们定义将在整个程序中使用的辅助函数。首先,我们需要一个函数来检测反转,并提醒终端用户我们的AI系统所预测到的前方危险。如果我们的AI系统检测到反转,我们将关闭在该市场中持有的所有头寸。
//+------------------------------------------------------------------+
//| Check reversal                                                   |
//+------------------------------------------------------------------+
void check_reversal(void)
  {
//--- Check for reversal
   if(((state == 1) && (model_forecast[0] < iClose(Symbol(),PERIOD_M1,0))) || ((state == 2) && (model_forecast[0] > iClose(Symbol(),PERIOD_M1,0))))
     {
      Alert("Reversal predicted.");
      Trade.PositionClose(Symbol());
     }
//--- Check if we have breached our maximum risk levels
   if(MathAbs(PositionGetDouble(POSITION_PROFIT) > max_risk))
     {
      Alert("We've breached our maximum risk level.");
      Trade.PositionClose(Symbol());
     }
  }
现在我们将定义一个用于寻找市场入场机会的函数。只有当我们从较高时间框架上确定市场走势时,我们才会认为入场有效。在这个EA中,我们希望交易与周线图上的价格走势保持一致。
//+------------------------------------------------------------------+
//| Find an entry                                                    |
//+------------------------------------------------------------------+
void find_entry(void)
  {
//--- Analyse price action on the weekly time frame
   if(iClose(Symbol(),PERIOD_W1,0) > iClose(Symbol(),PERIOD_W1,20))
     {
      //--- We are riding bullish momentum
      if(model_forecast[0] > iClose(Symbol(),PERIOD_M1,20))
        {
         //--- Enter a buy
         Trade.Buy(trading_volume,Symbol(),ask,(ask - sl_width),(ask + sl_width),"Multiple Time Frames AI");
         state = 1;
        }
     }
//--- Analyse price action on the weekly time frame
   if(iClose(Symbol(),PERIOD_W1,0) < iClose(Symbol(),PERIOD_W1,20))
     {
      //--- We are riding bearish momentum
      if(model_forecast[0] < iClose(Symbol(),PERIOD_M1,20))
        {
         //--- Enter a sell
         Trade.Sell(trading_volume,Symbol(),bid,(bid + sl_width),(bid - sl_width),"Multiple Time Frames AI");
         state = 2;
        }
     }
  }
我们还需要一个函数来获取当前的市场价格。
//+------------------------------------------------------------------+
//| Update market prices                                             |
//+------------------------------------------------------------------+
void update_market_prices(void)
  {
   ask = SymbolInfoDouble(Symbol(),SYMBOL_ASK);
   bid = SymbolInfoDouble(Symbol(),SYMBOL_BID);
  }
除非我们对输入进行标准化和归一化,否则无法使用ONNX模型,该函数将获取我们在训练ONNX模型时使用的缩放因子。
//+------------------------------------------------------------------+
//| Load our scaling factors                                         |
//+------------------------------------------------------------------+
void load_scaling_factors(void)
  {
//--- EURUSD OHLC
   mean_variance[0] = 1.0930010861272836;
   std_variance[0] = 0.0017987600829890852;
   mean_variance[1] = 1.0930721822927123;
   std_variance[1] =  0.001810556238082839;
   mean_variance[2] = 1.092928371812889;
   std_variance[2] = 0.001785041172362313;
   mean_variance[3] = 1.093000590242923;
   std_variance[3] = 0.0017979420556511476;
//--- M5 Change
   mean_variance[4] = (MathPow(10.0,-5) * 1.4886568962056413);
   std_variance[4] = 0.000994902152654042;
//--- M15 Change
   mean_variance[5] = (MathPow(10.0,-5) * 1.972093957036524);
   std_variance[5] = 0.0017104874192072138;
//--- M30 Change
   mean_variance[6] = (MathPow(10.0,-5) * 1.5089339490060967);
   std_variance[6] = 0.002436078407827825;
//--- H1 Change
   mean_variance[7] = 0.0001529512146155358;
   std_variance[7] = 0.0037675774501395387;
//--- D1 Change
   mean_variance[8] = -0.0008775667536639223;
   std_variance[8] = 0.03172437243836734;
  }
定义负责从模型中获取预测的函数,注意我们在将输入传递给ONNX模型之前已经对它们进行了缩放。通过OnnxRun命令从模型中获取预测结果。
//+------------------------------------------------------------------+
//| Model predict                                                    |
//+------------------------------------------------------------------+
void model_predict(void)
  {
//--- EURD OHLC
   model_inputs[0] = ((iClose(Symbol(),PERIOD_CURRENT,0) - mean_variance[0]) / std_variance[0]);
   model_inputs[1] = ((iClose(Symbol(),PERIOD_CURRENT,0) - mean_variance[1]) / std_variance[1]);
   model_inputs[2] = ((iClose(Symbol(),PERIOD_CURRENT,0) - mean_variance[2]) / std_variance[2]);
   model_inputs[3] = ((iClose(Symbol(),PERIOD_CURRENT,0) - mean_variance[3]) / std_variance[3]);
//--- M5 CAHNGE
   model_inputs[4] = (((iClose(Symbol(),PERIOD_M5,0) - iClose(Symbol(),PERIOD_M5,20)) - mean_variance[4]) / std_variance[4]);
//--- M15 CHANGE
   model_inputs[5] = (((iClose(Symbol(),PERIOD_M15,0) - iClose(Symbol(),PERIOD_M15,20)) - mean_variance[5]) / std_variance[5]);
//--- M30 CHANGE
   model_inputs[6] = (((iClose(Symbol(),PERIOD_M30,0) - iClose(Symbol(),PERIOD_M30,20)) - mean_variance[6]) / std_variance[6]);
//--- H1 CHANGE
   model_inputs[7] = (((iClose(Symbol(),PERIOD_H1,0) - iClose(Symbol(),PERIOD_H1,20)) - mean_variance[7]) / std_variance[7]);
//--- D1 CHANGE
   model_inputs[8] = (((iClose(Symbol(),PERIOD_D1,0) - iClose(Symbol(),PERIOD_D1,20)) - mean_variance[8]) / std_variance[8]);
//--- Fetch forecast
   OnnxRun(onnx_model,ONNX_DEFAULT,model_inputs,model_forecast);
  }
现在我们将定义一个函数用于加载ONNX模型,并定义输入和输出的形状。
//+------------------------------------------------------------------+
//| Load our onnx file                                               |
//+------------------------------------------------------------------+
bool load_onnx_file(void)
  {
//--- Create the model from the buffer
   onnx_model = OnnxCreateFromBuffer(onnx_model_buffer,ONNX_DEFAULT);

//--- Set the input shape
   ulong input_shape [] = {1,9};

//--- Check if the input shape is valid
   if(!OnnxSetInputShape(onnx_model,0,input_shape))
     {
      Alert("Incorrect input shape, model has input shape ", OnnxGetInputCount(onnx_model));
      return(false);
     }

//--- Set the output shape
   ulong output_shape [] = {1,1};

//--- Check if the output shape is valid
   if(!OnnxSetOutputShape(onnx_model,0,output_shape))
     {
      Alert("Incorrect output shape, model has output shape ", OnnxGetOutputCount(onnx_model));
      return(false);
     }
//--- Everything went fine
   return(true);
  }
//+------------------------------------------------------------------+
我们现在可以定义程序的初始化过程。我们的EA将加载ONNX文件和缩放因子,并获取市场数据。
//+------------------------------------------------------------------+
//| Expert initialization function                                   |
//+------------------------------------------------------------------+
int OnInit()
  {
//--- Load the ONNX file
   if(!load_onnx_file())
     {
      //--- We failed to load our onnx model
      return(INIT_FAILED);
     }

//--- Load scaling factors
   load_scaling_factors();

//--- Get trading volume
   trading_volume = SymbolInfoDouble(Symbol(),SYMBOL_VOLUME_MIN) * lot_multiple;

//--- Everything went fine
   return(INIT_SUCCEEDED);
  }
当我们的程序不使用时,我们将释放不再需要的资源。我们将释放ONNX模型,并将EA从图表中移除。
//+------------------------------------------------------------------+
//| Expert deinitialization function                                 |
//+------------------------------------------------------------------+
void OnDeinit(const int reason)
  {
//--- Release the resources we used for our onnx model
   OnnxRelease(onnx_model);

//--- Release the expert advisor
   ExpertRemove();
  }
每当有新的价格报价时,我们首先会从模型中获取一个预测,然后更新市场价格。如果没有持仓,我们将尝试寻找入场机会。否则,如果有一个需要管理的头寸,我们将密切留意可能出现的反转。
//+------------------------------------------------------------------+
//| Expert tick function                                             |
//+------------------------------------------------------------------+
void OnTick()
  {
//--- We always need a prediction from our model
   model_predict();

//--- Show the model forecast
   Comment("Model forecast ",model_forecast);

//--- Fetch market prices
   update_market_prices();

//--- If we have no open positions, find an entry
   if(PositionsTotal() == 0)
     {
      //--- Find entry
      find_entry();
      //--- Update state
      state = 0;
     }

//--- If we have an open position, manage it
   else
     {
      //--- Check if our AI is predicting a reversal
      check_reversal();
     }
  }
现在我们可以看到应用程序在运行。

图15:我们的EA界面

图16:我们的EA输入
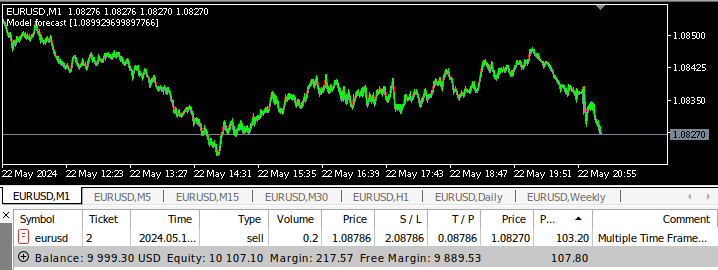
图17:对于多时间框架EA进行回测
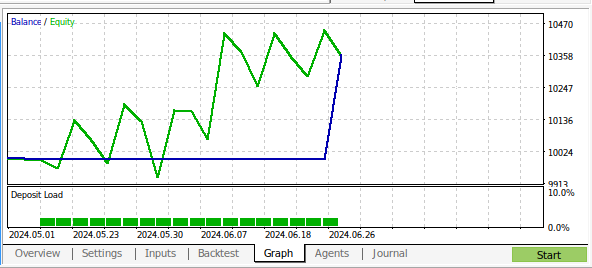
图18:在1个月的M1数据上对程序进行回测的结果
结论
在本文中,我们展示了如何构建一个能够分析多个时间框架的AI驱动的EA。尽管我们使用常规的开盘价、最高价、最低价和收盘价(OHLC)数据获得了更高的精度,但还有许多不同的选择尚未探索。例如,我们没有在更高时间框架上添加任何指标。我们可以将AI应用于交易策略的方式有很多,希望您现在对MetaTrader 5中等待挖掘的能力有了新的想法。
本文由MetaQuotes Ltd译自英文
原文地址: https://www.mql5.com/en/articles/15610
 数据科学与机器学习(第 20 部分):算法交易洞察,MQL5 中 LDA 与 PCA 之间的较量
 数据科学和机器学习(第 27 部分):MetaTrader 5 中训练卷积神经网络(CNN)交易机器人 — 值得吗?
 人工藻类算法(Artificial Algae Algorithm,AAA)
 数据科学和机器学习(第 26 部分):时间序列预测的终极之战 — LSTM 对比 GRU 神经网络