Watch the Market tutorial videos on YouTube
How to buy а trading robot or an indicator
Run your EA on
virtual hosting
virtual hosting
Test аn indicator/trading robot before buying
Want to earn in the Market?
How to present a product for a sell-through
New Technical Indicators for MetaTrader 4

The Grand Signal indicator is a unique tool that not only provides an understanding of market behavior but also precisely identifies trend entry points after intraday correction limits, with accuracy down to a five-minute candlestick! It includes individual settings for each currency pair. After purchasing, be sure to message me directly for instructions! Telegram: @Lapinsania or here in the Market! In the settings, define the standard daily movement:
EURUSD: 110
GBPUSD: 70
AUDUSD: 115
NZDUSD: 1

Dynamic Center of Gravity Indicator Revolutionary Price Action Trading System Harness the power of price momentum with the Dynamic Center of Gravity indicator - an advanced price action trading tool designed for serious traders. This innovative indicator identifies powerful gravity zones that attract rapid price movements, creating high-probability trading opportunities when momentum breaks free from these zones. Key Features Pure price action analysis - no lagging indicators Works effectively a

Discover the Future of Trading with Easy Entry Points! Developed by the renowned Felipe FX, Easy Entry Points is the next generation of trading indicators, designed to provide an intuitive and efficient trading experience. With advanced features and a user-friendly interface, this indicator is the perfect tool for traders of all levels. Key Features: Easy Entry Signal: Identify ideal entry points based on fast and slow EMA crossovers, ensuring precise and timely trading decisions. Sound Alerts:
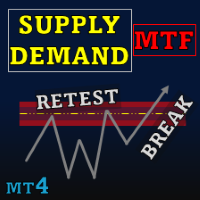
Celebrate Vietnamese Tet 2025 with Special Offer : ALL TOOLS only $35 ! Supply Demand Retest and Break Multi Timeframe , this tool plots supply and demand zones based on strong momentum candles, allowing you to identify these zones across multiple timeframes using the timeframe selector feature. With retest and break labels, along with customizable validation and styling options, this tool supports effective trading analysis. See more MT5 version at: Supply Demand Retest and Break MT5 Mul
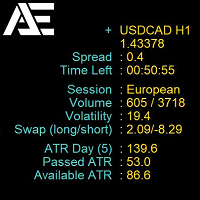
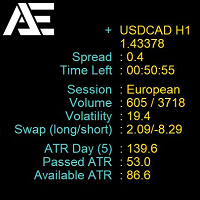
Market Info Display is a universal indicator that displays important market information organized in a user—friendly interface directly on the chart. Its functions are designed to efficiently display data that helps traders make informed decisions. It provides data on the current spread, time to candle close, current trading session, volume, volatility, daily price change, and ATR (Daily volatility).
The indicator supports multilingual settings (Russian and English), which makes it convenient

Bull and Bear Strength Indicator Overview: The Bull and Bear Strength Indicator is a versatile and intuitive tool designed to give traders a decisive edge. It captures the balance of power between bulls and bears, providing actionable insights into market sentiment and momentum for any timeframe or instrument. The Bull and bears strength indicator allows you to see the areas where momentum and volume has peaked. It highlights areas of strength within a range. A truly simple indicator with powerf
FREE
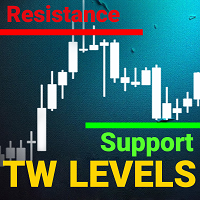
support resistance levels indicator mt4: This tool is a multi-timeframe indicator that identifies and plots support and resistance lines, as well as Fibonacci levels, on a chart with the same accuracy as the human eye. TW support and resistance levels for forex has complex algorithm that scans the chart to identify previous levels of price stabilization and rebounds, recording the number of touches.
Are you tired of manually drawing support and resistance levels and Fibonacci retracements? Ch

1.Supply and demand are one of the core strategies used in trading. It focuses on the ancient laws of supply and demand, as well as the trends of prices in a free flowing market. The basis of this strategy is that the quantity of available tools and the demand for tools from buyers determine the price. It marks on the chart the areas where demand overwhelms supply (demand regions), driving prices up, or where supply overwhelms demand (supply regions), driving prices down. Most supply and demand
FREE
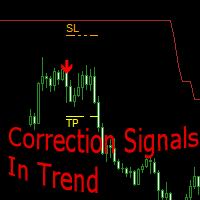
Correction Signals In Trend - a technical indicator that analyzes the market dynamics, helps the trader determine the trend direction and find points for opening orders.
The indicator follows the trend in the format of support and resistance lines and shows an upward or downward trend.
In the trend direction, after the end of the correction, a search for signals is performed. Arrows indicate potential moments for trading operations.
For each signal, the recommended SL and TP levels are displayed
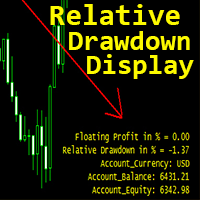
Crypto_Forex Indicator "Relative Drawdown Display" for MT4, useful trading tool. This is MUST HAVE indicator for traders who use grid trading systems!!! Relative Drawdown Display indicator shows current Relative DD or Floating Profit in % on your account. PC and Mobile Alerts are built-in with adjustable Trigger level. Indicator also indicates account Balance and Equity. It is possible to locate indicator values in any corner of the chart : 0 - for top-left corner, 1 - top-ri
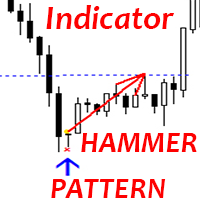
Crypto_Forex Indicator " Hammer pattern" for MT4. Indicator "Hammer pattern" is very powerful indicator for Price Action trading: No repaint, No delay. Indicator detects bullish Hammer patterns on chart: Blue arrow signal on chart (see pictures). With P C, Mobile & Email alerts. Indicator "Hammer pattern" is excellent to combine with Support/Resistance Levels. // More great Expert Advisors and Indicators are available here: https://www.mql5.com/en/users/def1380/seller It is original
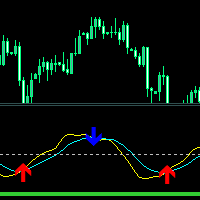
Crossing Line Indicator - An indicator designed for early detection of impulse movements in the direction of the trend.
Contains an oscillator built on the RVI indicator using smoothing and behavior modification. Two thin lines at the intersection of which a moment of price change occurs, the consequence of which may be an impulse or intensive movement.
The indicator for determining the trend direction is built on weighted MA indicators. A thick light green line, if it is below the central leve
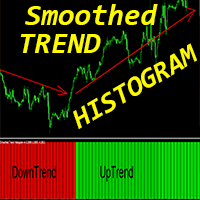
Crypto_Forex Indicator "Smoothed Trend Histogram " for MT4 , No Repaint. Smoothed Trend Histogram indicator is much more efficient than any standard Moving Averages cross. It is especially focused for big trends detection. Indicator has 2 colors: Red for bearish downtrend and Green for bullish uptrend (colors can be changed in settings). With Mobile and PC alerts. It is great idea to combine this indicator with any other trading methods: Price Action, Scalping, Momentum trading, other
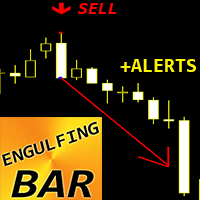
Crypto_Forex Indicator ENGULFING Bar Pattern for MT4. Indicator " ENGULFING Bar " is very powerful indicator for Price Action trading : No repaint, No delay. Indicator detects ENGULFING Bar patterns on chart: Bullish ENGULFING Bar - Blue arrow signal on chart (see pictures). Bearish ENGULFING Bar - Red arrow signal on chart (see pictures). With P C, Mobile & Email alerts. Indicator " ENGULFING Bar Pattern " is excellent to combine with Support/Resistance Levels. // More great
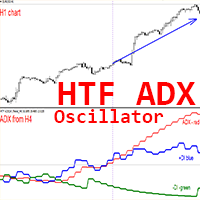
Crypto_Forex Indicator HTF ADX for MT4. Upgrade your trading methods with the professional HTF ADX indicator for MT4. H TF means - H igher Time Frame. ADX (red line) is used to measure trend strength - if ADX value is above 20 and has upstairs shape - trend is strong. If the +DMI (blue line) is above the -DMI (green one): price is moving up, and ADX measures the strength of the uptrend. If the -DMI (green line) is above the +DMI (blue one): price is moving down, and ADX meas
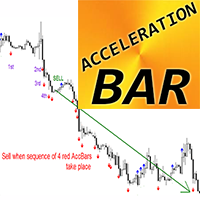
Crypto_Forex Indicator Acceleration Bar for MT4 - able to catch huge trends. Indicator " Acceleration Bar" is very powerful tool for Trend trading - market flat influence is minimized. Bullish Acceleration Bar (blue) is bar on chart which has Max higher than max of previous 5 bars and which has Min lower than min of next 5 bars. Bearish Acceleration Bar (red) is bar on chart which has Min lower than min of previous 5 bars and which has Max higher than max of next 5 bars. TREND TRADING: B
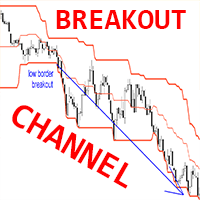
Crypto_Forex Indicator BREAKOUT CHANNEL for MT4, No Repaint. This indicator can be used as complete trading system based on High/Low breakouts. It has just 1 parameter - HYSTORY DEPTH, it reflects the number of candles which are taken into consideration by indicator. Parameter HYSTORY DEPTH recommended values: timeframe D1 - 20 (one month), H4 - 30 (one week), H1 - 24 (one day). BREAKOUT CHANNEL consist of 3 lines: High Border - max price of last N ( HYSTORY DEPTH parameter) candles, Low

The Volume Bar POC Indicator is an innovative tool that provides precise visualization of key price levels (Point of Control, POC) based on tick volume trades. This indicator analyzes each price point within individual candles and displays the most significant levels, which can be used as strong support and resistance zones. Ideal for both intraday and long-term trading strategies. How does the Volume Bar POC Indicator work? The indicator uses an advanced process to calculate the POC during the

Good dial indicator "Pigment"
Pointer indicator "Pigment"
This product is great for binary options.
Showed itself well on M5 M15 timeframes.
Multicurrency also works well in news releases.
Does not draw and the signal appears on the current candle
Blue arrow buy
red arrow sell
You can also set the signal frequency to your liking:
In the settings, simply change the Period, the default is Period 3.

Indicator for manual construction of maximum correction zones based on cycles according to Gann theory. Zones are determined by mathematical calculation using special coefficients for different timeframes.
Gives traders an understanding of the direction of price movement from the support zones of purchases/sales
Zones are built from significant high/low manually
To build a support zone of purchases, you need to place the mouse cursor on the high and press the "1" key
To build a support zone
Evolutionize Your Trading with the UT Alert Bot Indicator for MQL4 The UT Alert Bot Indicator is your ultimate trading companion, meticulously designed to give you an edge in the fast-paced world of financial markets. Powered by the renowned UT system, this cutting-edge tool combines advanced analytics, real-time alerts, and customizable features to ensure you never miss a profitable opportunity. Whether you’re trading forex, stocks, indices, or commodities, the UT Alert Bot Indicator is your k
FREE
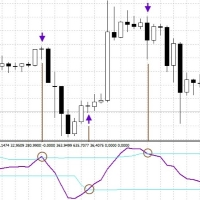
Cyclic Smoothed Relative Strength Indicator
The cyclic smoothed RSI indicator is an enhancement of the classic RSI, adding
additional smoothing according to the market vibration,
adaptive upper and lower bands according to the cyclic memory and
using the current dominant cycle length as input for the indicator. The cRSI is used like a standard indicator. The chart highlights trading signals where the signal line crosses above or below the adaptive lower/upper bands. It is much more responsive
FREE
Abraxis Indicator Discover our innovative Abraxis Indicator , a powerful tool designed for traders seeking to refine their chart analysis and maximize their trading opportunities. This indicator was developed to operate efficiently across different timeframes, allowing you to adjust your strategies according to your needs. Key Features Calculation of Lines Based on Previous Pillar: The indicator automatically calculates the high and low of the previous pillar, based on the configured perio

Adjustable Volume Profile Indicator The Adjustable Volume Profile is a custom MetaTrader 4 (MT4) indicator designed to visually display the volume distribution of a financial instrument across a specific price range and time period. This indicator allows traders to analyze the volume profile based on either real volume or tick volume, helping to identify key levels of support, resistance, and market activity. Key Features: Customizable Timeframe: The indicator can be set to any available timefra
FREE

The Colored MACD indicator is a versatile and powerful tool designed to enhance your technical analysis by providing an intuitive visualization of market momentum and trend changes. Built on the foundation of the popular Moving Average Convergence Divergence (MACD) indicator, this version introduces color-coded histograms to easily distinguish between bullish and bearish momentum. Key Features: Color-Coded Visualization : The indicator features a lime-colored histogram when the MACD is above the
FREE
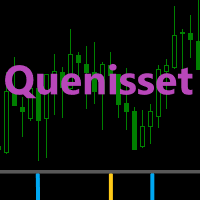
Quenisset
The Quenisset indicator is a powerful and accurate trend detection and trade management tool, an indicator designed for scalping and short-term trading.
Traders can use this indicator on all currency pairs and timeframes, M1, M5, M15, M30, H1 and H4.
By identifying reversal points, this indicator provides a highly effective solution for traders looking for accurate and timely trading signals.
The indicator displays, based on the trend direction at the H4 level, the blue bar indica

Trend Graf - это инструмент позволяющий видеть тренд текущего момента,имея стартовые диапозоны которые появляются каждые шесть часов ,способен давать нам уровень предела коррекции как по тренду так и на смену ему.Работает на всех валютных парах!В настройках мы имеем смещение для проекции стартового диапозона от текущей установки ,для каждой валютной пары можно подобрать то смещение, которое лучшим образом будет показывать предел коррекции.Следующее обновление будет включать сигнальные указатели!
FREE

This indicator is an analytical tool that helps you monitor market movements and make trading decisions based on specific signals. The indicator identifies different price levels on the chart and provides alerts when the price reaches these levels. What the indicator does: Identifies important levels : The indicator tracks price movement and identifies three key levels (Level 1, Level 2, Level 3) on the chart. These levels represent important points in the market that may indicate a trading opp
FREE

Vortex Ultimate input parameters Period (default = 14) — the Vortex indicator period. Smoothing (default = 0) — the smoothing period. Zero means no smoothing. TypeSmoothing (default = Simple) — the type of smoothing to apply. Can be one of the three modes: Simple — the simple moving average of the given period is applied. Exponential — the exponential moving average of the given period is applied. Triple exponential — the triple exponential moving average (TEMA) of the given period is applied.
FREE

Golden Trend Pulse — trend indicator developed specifically for Gold, also applicable to the Cryptocurrency and Stock markets. The indicator is designed for precise determination of market trends using advanced analytical methods. The tool combines multifactor analysis of price dynamics and adaptive filtering of market noise, ensuring high accuracy in identifying key entry and exit points. Thanks to its intelligent system, the indicator effectively handles market variability, minimizing false s
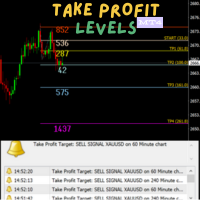
This indicator outlines take profit (TP) stations derived from the Dinapoli ABC price projections. The key levels identified include COP (the critical operation point) designated as TP1, OP (the optimal point) marked as TP3, and SXOP (the secondary operation point) noted as TP4.
This indicator proves to be especially beneficial for traders entering positions without clearly defined exit points. The Dinapoli levels provide precise price projections that highlight where the market is most likely

Индикатор ручного построения зон максимальных коррекций основанных на циклах по теории Ганна. Определяются зоны путем математического вычисления с применением особых коэффициентов для различных таймфреймов.
Даёт понимание трейдерам направление движения цены от опорных зон покупок/продаж
Строятся зоны от значимых хай/лоу вручную
Для построения опорной зоны покупок требуется установить курсор мыши на хай и нажать клавишу "2"
Для построения опорной зоны продаж требуется установить курсор мыши

The indicator defines the buy and sell arrows with high performance and consistent results. Suitable for trend trading or following the trend. Automatic analysis of market opportunities ; Never repaints, recalculates or backpaints signals; This is FREE demo version of the indicator and works only on "USDCHF M5, M15, H1". The demo version does not work on SUFFIX OR PREFIX brokers ! Forex Trend Commander full version: All details about the indicator here : Works in all symbols + Multi Currency
FREE
Analizer ZA - Advanced Multi-Timeframe Trading Tool for MetaTrader 4 Analizer ZA is a powerful and versatile trading indicator designed to help traders of all levels make informed decisions by combining RSI-based highlights , Support/Resistance levels , and SAR trend signals into one comprehensive tool. Whether you're a beginner or an experienced trader, Analizer ZA provides clear visual cues and actionable insights to enhance your trading strategy. Key Features RSI-Based Candle Hi
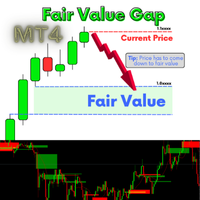
A fair value gap (FVG) is a temporary price gap that occurs when the price of a stock or security is out of line with its fair value. This gap is often caused by an imbalance between buyers and sellers. How it works Price imbalance When there is an imbalance between buyers and sellers, the price of a security can move too quickly. Price gap This creates an unadjusted area on the price chart, known as the fair value gap Price correction The price is often drawn back to the fair value gap, as i
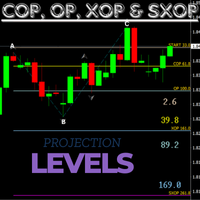
If you're familiar with COP, OP, and XOP levels, this indicator is definitely worth considering. There's no need to manually plot the ABC levels, as the indicator automatically calculates and displays the OP projection levels for you, updating regularly as the price changes.
This is an essential indicator for your trading toolkit. Please if you are unsual on how to use this indicator feel fell to ask me for help and i can assist you where i can.
Happy trading!

If you're familiar with trading using Dinapoli levels, then this indicator is definitely worth your attention. It automatically plots key levels such as COP (Change of Polarity), OP (Objective Price), and XOP (Extended Objective Price) on your charts, regardless of the timeframe you choose to work with.
One of the standout features of this indicator is its ability to generate alerts. Whenever a new ABC pattern is automatically identified and plotted by the indicator, you will receive a notifica
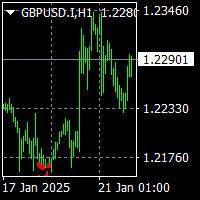
To get access to MT5 version please click here . This is the exact conversion from TradingView: "Fearzone - Contrarian Indicator" by " Zeiierman ". This is a light-load processing and non-repaint indicator. All input options are available. Buffers are available for processing in EAs. You can message in private chat for further changes you need. Thanks for downloading

Trump Arrow is for trading the trends of the markets. It uses convergence and divergence. Use it during active times to get behind a trend and follow it with MA filters or other strategies you have. The indicator works well for small time frames just and it suggests using 15 min. Others work too but for day trading 5-15 is best. 1 hr charts if you want to filter for longer term trends.
На графике EURUSD это БЕСПЛАТНО. Версия со всеми символами! Свяжитесь со мной по любым вопросам
Market Info Display — это универсальный индикатор, отображающий важную рыночную информацию, организованную в удобном интерфейсе прямо на графике. Его функции рассчитаны на эффективное отображение данных, которые помогают трейдерам принимать взвешенные решения. Он предоставляет данные о текущем спреде, времени до закрытия свечи, текущей торговой сессии, объеме, волатильности, изменении цены за де
FREE
Celebrate Vietnamese Tet 2025 with Special Offer : ALL TOOLS only $35 ! I. Introduction
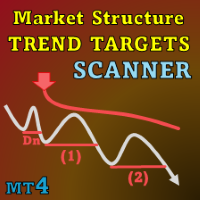
Market Structure Trend Targets Scanner is a powerful tool for analyzing market trends, identifying breakout points, and managing risk via a dynamic stop loss. By tracking previous highs and lows to pinpoint breakouts, this tool helps traders quickly recognize market trends and potential reversals in an intuitive manner. See more MT5 version at: Market Structure Trend Targets MT5 Scanner See more products
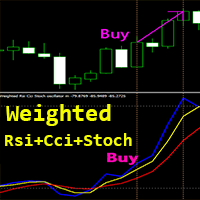
Crypto_Forex Indicator "Weighted Rsi Cci Stoch Oscillator" for MT4, No Repaint. This unique indicator combines 3 in 1: RSI, CCI and Stochastic for calculation! Precise momentum trading opportunities with this software - see examples on pictures. Indicator consist of 3 lines : Weighted Rsi Cci Stoch Oscillator itself ( Blue color ); Fast MA of oscillator ( Yellow color ); Slow MA of oscillator ( Red color ); Zone above 50 - overbought zone (Do not BUY there). Zone below -
"GYing"High profit trading system(高盈天眼交易系统OS版),Trading system indicator signal, no redraw, no drift, close confirmed.(系统指标信号收线确认不重绘、无未来、不飘不移不消失。) The whole set of system indicators is placed in Ali Shadowcloud server, users only need to download the "Shadowcloud computer", we provide one-to-one independent account password login can be used.Support computer version, mobile version.(系统指标整套放置于阿里无影云服务器,用户只需要下载“无影云电脑”,我们提供一对一独立的账号密码登录使用即可。支持电脑版、手机版。) The system is a homogenous trading idea, and the

The indicator automatically identifies and labels essential elements of market structure shift, including: Break of Structure (BoS): Detected when there is a significant price movement breaking previous structural points. It mark possible uptrend and downtrend lines(UP & DN, It means constantly update high and low ), and once the price breaks through these lines, mark the red (BEAR) and green (BULL) arrows. BoS typically occurs when the price decisively moves through swing lows or swing highs t
Trend AI Indicator Description:
Trend AI Indicator is a powerful market analysis tool that uses artificial intelligence to identify trends and key levels. The indicator automatically adapts to changing market conditions, providing accurate data for decision-making. Key Features: Trend Identification: The indicator uses machine learning algorithms to accurately determine the direction of the trend (uptrend, downtrend, sideways). Key Levels: Automatically builds support and resistance levels
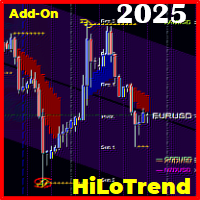
[Limited-time launch, download A.S.A.P. !] Disclaimer: This product " [#1] HiLoTrend CyberBot ", is available for complimentary download as one of the free add-on products, in addition to the free product " [#1] Oscillator CyberBot ", the operation of which can be observed in the accompanying presentation video. As a free add-on product, it cannot be activated independently; it is only functional when the Expert Advisor product is active. This initiative reflects our commitment to every client
FREE
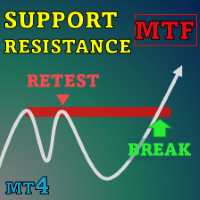
Celebrate Vietnamese Tet 2025 with Special Offer : ALL TOOLS only $35 ! In the ever-changing landscape of financial trading, accurately identifying and analyzing support and resistance levels is essential for making informed investment decisions. SnR Retest and Break Multi-Timeframe is a support and resistance indicator designed to enhance your trading analysis. Utilizing the innovative Timeframe Selector feature, this tool provides a comprehensive view of market dynamics across multiple timef

MT4 Version https://www.mql5.com/en/market/product/129411 MT5 Version https://www.mql5.com/en/market/product/129412
The Dashboard Scanner Kalman is an advanced multi-symbol and multi-timeframe scanning tool designed to simplify your trading process by leveraging the powerful Kalman trend level and support-resistance calculations. This indicator combines trend-following algorithms and precision support-resistance analysis to help you quickly identify optimal trading opportunities across multipl
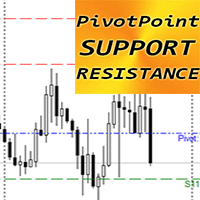
Crypto_Forex Indicator "PIVOT POINT Support Resistance" for MT4. Indicator "Pivot Point Support Resistance" is very powerful auxiliary indicator for Price Action trading. Pivot Levels are calculated as an average of significant prices from the performance of a market in the prior trading period. Pivot Levels itself represent a levels of highest resistance or support , depending on the overall market condition. Indicator " Pivot Point Support Resistance" shows you the most probable rever

Crypto_Forex Indicator " 3 Black Crows pattern" for MT4. Indicator "3 Black Crows pattern" is very powerful for Price Action trading: No repaint, No delay. Indicator detects bearish "3 Black Crows" patterns on chart: Red arrow signal on chart (see pictures). With P C, Mobile & Email alerts. Also its brother - bullish "3 White Soldiers pattern" indicator is available (follow the link below).
Indicator "3 Black Crows pattern" is excellent to combine with Support/Resistan
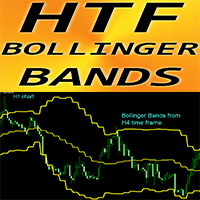
Crypto_Forex Indicator "HTF Bollinger Bands" for MT4. Upgrade your trading methods with the professional indicator "HTF Bollinger Bands" for MT4. H TF means - H igher Time Frame. Bollinger Bands is one of the best indicators on the market - perfect tool for trading. Approximately 90% of price action occurs between the two bands. HTF Bollinger Bands indicator is excellent for Multi-Time Frame trading systems with Price Action entries or in combination with other indicators. This indi
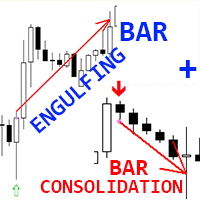
Crypto_Forex Indicator " Engulfing Bar and Consolidation Bar" patterns for MT4. "Engulfing Bar and Consolidation Bar" patterns is very powerful for Price Action trading. Indicator detects Engulfing Bars and Consolidation Bars on chart: Bullish Engulfing Bar pattern - Green arrow signal on chart. Bearish Engulfing Bar pattern - Orange arrow signal on chart. Bullish Consolidation Bar pattern - Blue arrow signal on chart. Bearish Consolidation Bar pattern - Red arrow signal on chart.
No r
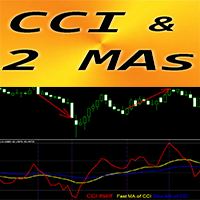
Crypto_Forex Indicator "CCI and 2 Moving Averages" for MT4 , No Repaint. Commodity_Channel_Index (CCI) is excellent for momentum trading into the trend direction. " CCI and 2 Moving Averages" Indicator allows you to see Fast and Slow Moving Averages of CCI indicator. Up trend - Fast MA is above Slow one; Down trend - Fast MA is below Slow one. CCI is one of the most popular oscillators for trading - it measures the difference between the current price and the historical average

Maximize your trading results with the Advanced RSI+EMA Trend Indicator! Discover a new level of precision in technical analysis with this powerful indicator, designed for traders seeking to identify trends with clarity and act at the right moment. Key Features : Visual Signals on the Chart : Instantly spot the best moments to buy and sell with clearly marked arrows directly on the chart. EMA and RSI Combination : Advanced technology that uses Exponential Moving Averages (EMA) and the R
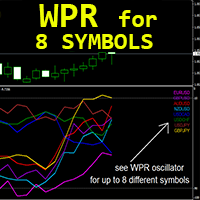
Forex Indicator "WPR for 8 Symbols" for MT4, No repaint. WPR itself is one of the best oscillators for scalping. It is great to take Sell entries from strong OverBought zone (above -10) and Buy entries from strong OverSold zone (below -90). "WPR for 8 Symbols" gives opportunity to control WPR values of up to 8 different symbols just on 1 chart.
This indicator is excellent to combine with Price Action entries from OverSold/Bought areas as well. // More great Expert Advisors and
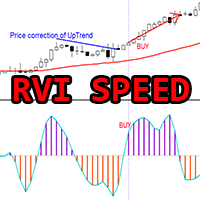
Crypto_Forex Indicator "RVI Speed" for MT4, No Repaint. The calculation of this indicator is based on equations from physics. RVI Speed is the 1st derivative of RVI itself. Relative_Vigor_Index (RVI) itself is a technical momentum indicator which is very useful on trend markets.
RVI Speed is good for momentum entries after price correction into the direction of main trend. Use it in combination with suitable trend indicator, for example standard EMA (as on pictures). RVI Speed indica
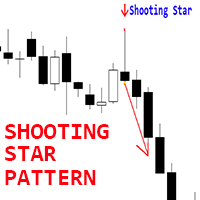
Crypto_Forex Indicator " Shooting Star pattern" for MT4. Indicator " Shooting Star pattern " is very powerful indicator for Price Action trading : No repaint, No delay. Indicator detects bearish Shooting Star patterns on chart: Red arrow signal on chart (see pictures). With P C, Mobile & Email alerts. Indicator " Shooting Star pattern" is excellent to combine with Support/Resistance Levels. // More great Expert Advisors and Indicators are available here: https://www.mql5.com

The Gann Scalping Gold Indicator is a robust technical analysis tool designed for precision trading in gold markets. It leverages Gann-based methodologies to identify key price levels, enabling traders to anticipate potential market reversals, breakouts, and areas of consolidation. Daily Reset Logic: Automatically resets touch statuses at the start of a new trading day, ensuring that the indicator aligns with fresh daily trends. How It Works: The indicator draws horizontal lines at predefined le
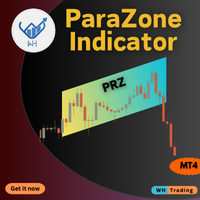
The ParaZone Indicator MT4 helps you spot areas where price trends are likely to reverse. It marks these zones on your chart using a unique parallelogram shape, making it easier to find the best points to enter or exit trades. Whether you’re a beginner or experienced trader, this tool can help improve your trading decisions. Key Features: Accurate Reversal Detection: Identifies key zones where price may change direction. Dynamic Zone Adaptation: Zones adjust in real-time to follow market

Overview:
The Coloured Parabolic SAR Indicator is a visually enhanced trading tool designed to make trend-following and trade identification easier. This customizable indicator provides clear visual cues with color-coded signals for bullish (buy) and bearish (sell) trends directly on your MT4 chart. Key Features: Color-Coded Signals : Lime green "o" symbol for Buy signals. Red "o" symbol for Sell signals. Customizable Inputs : Adjustable Step and Maximum parameters to fine-tune the Parabolic SA
FREE
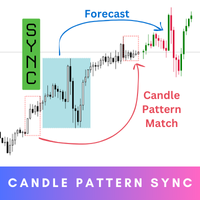
Candle Pattern Sync is your ultimate tool for precision and insight in trading. Step into the future of trading with this innovative indicator that’s designed to help you understand market behavior by analyzing historical patterns and giving you an idea of what might come next. While the forecasts provide valuable probabilities based on history, they’re not guarantees – think of them as a powerful guide to inform your decisions, not a definitive answer. MT5 Version - https://www.mql5.com/en/mar
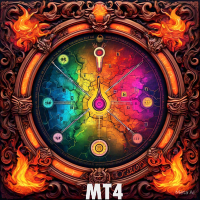
Here's the English version of the marketing content for the Heat Map Indicator:
# Heat Map Indicator - Advanced Volume Analysis
**Introducing the Heat Map Indicator - A Professional Tool for Market Volume Analysis!**
### Key Features
1. **Visual Heat Map** - Instant volume intensity visualization through colors - Blue: Low volume - Green: Medium volume - Yellow/Orange: Increasing volume - Red: Intense volume
2. **Intuitive Interface** - Dynamic color scale - Real-time percentage indicat
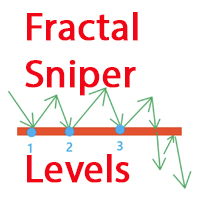
Fractal Sniper Levels is a powerful technical indicator that finds a rebound of fractal formations from one price zone. The main feature of the indicator is that it analyzes fractals not just as extremes, but as full-fledged reversal formations, which significantly increases the reliability of the determined levels.
Key advantages Working with fractals as reversal formations, and not just as local extremes Intelligent analysis of each fractal's rebound from the levels of the same price zone A

**"Discounted Price."**
We are always in pursuit of the perfect time to achieve the desired price, as timing is a pivotal factor in trading. This is exactly what the indicator does: It seamlessly combines time and price, dynamically mapping them onto the chart using two lines that represent both time and price together, introducing a completely innovative conept. • No more complex settings. Simply place the indicator on your chart, and it will handle everything for you. ---------------------

One of the key elements in trading is identifying zones or levels that allow traders to make buy or sell decisions during trading. أحد العناصر الأساسية في التداول هو تحديد المناطق أو المستويات التي تسمح للمتداولين باتخاذ قرارات الشراء أو البيع أثناء التداول. The indicator displays Fibonacci levels يعرض المؤشر مستويات فيبوناتشي drawing levels based on historical daily or weekly data. مستويات الرسم بناءً على البيانات التاريخية اليومية أو الأسبوعية. Daily levels update with each new day’s opening
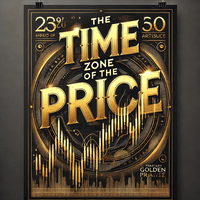
When time converges with price in a critical zone, it creates a pivotal area that simplifies decision-making. This is precisely the functionality of this indicator, as it integrates time and price to highlight a robust zone you can rely on.
Key Features of the Indicator: • Dynamic Time-Price Zones: The indicator draws a time-price zone determined by the user, based on customizable settings available in the configuration. • Customizable Day Selection: A dedicated field allows you to choose th
This indicator is free and shows you the trading volume on all timeframes. You can manage your open positions by time and volume by drawing a moving average based on the desired period, as well as adding multiple levels with a better understanding of the trading volume change.
But to fully use this indicator, you can visit the Utilities section of MQL5.com and download the "ّ Forex Time Zones " Expert Advisor and watch how to use it on our YouTube channel.
These two tools complement each other a
FREE

When geometric shapes meet with time and price, they give more confidence in the chart The indicator plots daily and weekly price triangles So that the weekly is kept until the end of the trading week While the Daily is changing with each opening The size of the triangles varies based on the previous data They will be an aid in decision-making, especially on both sides of the Triangle * Contains options to activate and disable triangles * Merge weekly and daily triangles together, each c
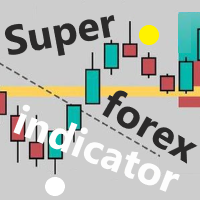
Super forex indicator
Super Forex Indicator is a unique, high-quality indicator and trading tool built from two complex and custom indicators.
This indicator is completely manual and can be used on all pairs and all time frames.
My recommendation is to use it especially for the M15 time slot, so that there is a balance between the frequency of the signals and their quality.
The signal to find the optimal entry point is simple and immediate: the white circle gives the signal to BUY, the yell

Enter/Exit indicator Try trading on signal change BUY/SELL to Sell SELL/BUY to buy or exit by signal change. Very good for trading news. - - - - - - - - - - Please leave positive comments. - - - - - - - - - - - - - - - - - - - - - - - - - - - - - - - - - - - - - - - - - - - - - - - - - - - - - - - - - Info: CalculatedBars = Indicator Calculated Bars; AlertConfirmation = true On false Off LongBarPoints = maximum point value for signal long bar size. Buffer0[] = Arrow Up; Buffer1[] = Arrow Down;
123456789101112131415161718192021222324252627282930313233343536373839404142434445464748495051525354555657585960616263646566676869707172737475767778798081828384858687888990919293949596979899100101102103104105106107108109110111112113114115116117118119120121122123124125126127128129130131132133134135136137138139140141142143144145
The MetaTrader Market is the best place to sell trading robots and technical indicators.
You only need to develop an application for the MetaTrader platform with an attractive design and a good description. We will explain you how to publish your product on the Market to offer it to millions of MetaTrader users.
You are missing trading opportunities:
- Free trading apps
- Over 8,000 signals for copying
- Economic news for exploring financial markets
Registration
Log in
If you do not have an account, please register
Allow the use of cookies to log in to the MQL5.com website.
Please enable the necessary setting in your browser, otherwise you will not be able to log in.