Watch the Market tutorial videos on YouTube
How to buy а trading robot or an indicator
Run your EA on
virtual hosting
virtual hosting
Test аn indicator/trading robot before buying
Want to earn in the Market?
How to present a product for a sell-through
New Technical Indicators for MetaTrader 4 - 12

RaysFX Strategy è un sofisticato strumento di trading che genera segnali di ACQUISTO e VENDITA basati su una combinazione di quattro indicatori tecnici: 3 SMA (Simple Moving Average), 1 StochasticRSI , 1 Choppy, e 1 DeMarker. Only M1 TimeFrame! **Segnale di VENDITA**
Quando la candela precedente è sotto i 3 SMA, sopra il livello 80 dello Stochastic, sotto il livello 38 del Choppy e sopra il livello 0.3 del DeMarker, l'indicatore genera un segnale di VENDITA, rappresentato da una freccia rossa.

The Book of Changes is a product of ancient civilization and a philosophical work that highly integrates natural and social sciences in China. The Book of Changes believes that all things in heaven and earth are constantly developing, and it explains the laws of nature. This law reveals the characteristics of the entire universe, covering the attributes of all things in heaven and earth. The Book of Changes is the crystallization of the wisdom of the Chinese nation. It is the crystallization of
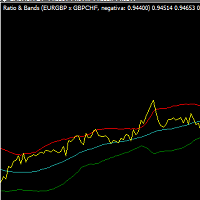
Hello everyone!
This incredible indicator for MT4 plataform calculates the ratio betwwen two symbols AND shows the bollinger bands for this ratio. It also considers if the two symbols have a positive or negative correlation for the calculations.
The result is a powerfull tool that brings very precious information to who that wants to trade in Forex based on correlation.
Enjoy!
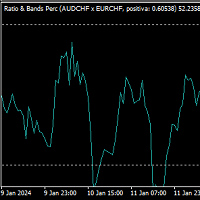
Hello everyone!
This incredible indicator for MT4 plataform calculates the ratio between two symbols, convert it into a percentual value and shows the result into a oscilation tunnel. It is derivated from the our other indicator (Ratio Bands). The basic diference is that instead of a bollinger bands, it uses a percentual oscillation that helps a lot during correlation trades.
It also considers if the two symbols have a positive or negative correlation for the calculations.
Good trades!

Classic Fractals indicator for MT4, with additional Trendlines connecting the latest couples of fractals
( fractals are showing highest high, and lowest low on each period)
Rules for trendlines:
-if new top fractal is below the last one = new resistance line
-if new bot fractal is above the last one = new support line
-Trendlines can be hidden
-Fractals can be hidden
Fractal Period = can be both even or uneven number, as it is setting for half (one side) of the bars sequence

Простой индикатор тренда в NRTR виде с отрисовкой линий стоплосса и тейпрофита, цвет и направление движения которых определяются действующим трендом. Индикатор имеет возможность подавать алерты, отправлять почтовые сообщения и push-сигналы при смене направления тренда. Следует учесть что значение входного параметра индикатора Deviation of the take profit line in points для каждого финансового актива на каждом таймфрейме необходимо подбирать индивидуально!

This is an arrow indicator without a future function,developed based on the most advanced profit trading algorithms.It has the most innovative and advanced dual trend analysis module, as well as the latest and highly effective market trend prediction algorithm.Trends are your friends, and following larger trends can earn the maximum profit in foreign exchange. This indicator helps traders identify current trends and track them. Someone once made a profit of 10 times in a week by relying on it.No

Introduction The Commodity Channel Index, commonly known as the CCI, is a versatile indicator used by traders and investors to identify cyclical trends in commodities, stocks, and other securities. It was developed by Donald Lambert in 1980, primarily for commodity trading, but has since found widespread application in various financial markets. The CCI is particularly favored for its ability to gauge overbought and oversold levels in price movements. Historical Background Donald Lambert, the

After 7 years I decided to release some of my own indicators and EAs for free.
If you find them useful please Show support with a 5-star rating! Your feedback keeps the free tools coming! See other my free tools as well here
_________________________________ Bollinger %B Indicator for Enhanced Forex Trading Analysis The Bollinger %B Indicator, expertly crafted in MQL4, is a dynamic tool designed to revolutionize forex trading analysis. Leveraging the power of Bollinger Bands
FREE

The Chart High Low Indicator is an indicator for META TRADER 4, with the function of analyzing and showing the weekly MAXIMUM, weekly MINIMUM, monthly MAXIMUM and monthly MINIMUM levels.
This can help a lot when creating TrendLine or even plotting your FIBONNACI line, as there is no need to access Internet sites to analyze the MAXIMUM/MINIMUM levels. In graphical analysis, it can assist in breaking HIGH/MIN levels, creating support and resistance breakOuts. There are "mark" functions on the i
FREE

After 7 years I decided to release some of my own indicators and EAs for free.
If you find them useful please Show support with a 5-star rating! Your feedback keeps the free tools coming! See other my free tools as well here
_________________________________ Bollinger Bandwidth Indicator for Advanced Market Volatility Analysis The Bollinger Bandwidth Indicator, meticulously developed in MQL4, is a sophisticated tool designed to elevate forex trading analysis. It harnesses th
FREE

After 7 years I decided to release some of my own indicators and EAs for free.
If you find them useful please Show support with a 5-star rating! Your feedback keeps the free tools coming! See other my free tools as well here
_________________________________ Intraday Intensity Index (III) for Precision Forex Trading The Intraday Intensity Index, meticulously developed in MQL4, is a cutting-edge tool designed for enhancing forex trading analysis. This indicator offers a deep
FREE

After 7 years I decided to release some of my own indicators and EAs for free.
If you find them useful please Show support with a 5-star rating! Your feedback keeps the free tools coming! See other my free tools as well here
_________________________________ Volume Moving Average (Volume MA) Indicator for Advanced Forex Market Analysis Introducing the Volume Moving Average (Volume MA) Indicator, meticulously developed in MQL4, a pivotal tool for enhancing your forex trading str
FREE

Do you want to truly improve your Forex trading? Then AI Adaptive Scalper is exactly what you need. This unique and innovative trend indicator is designed specifically for the EURUSD currency pair and the h1 time frame to provide you with the most accurate signals possible. AI Adaptive Scalper uses popular indicators such as Stochastic, MACD, Ichimoku, Bollinger and ZigZag to discover optimal entry and exit points for trades. You will be able to easily identify changes in the market trend and i

The Smart Liquidity Profile is color-coded based on the importance of the traded activity at specific price levels, allowing traders to identify significant price levels such as support and resistance levels, supply and demand zones, liquidity gaps, consolidation zones, Buy-Side/Sell-Side Liquidity and so on. Smart Liquidity Profile allows users to choose from a number of different time periods including 'Auto,' 'Fixed Range,' 'Swing High,' 'Swing Low,' 'Session,' 'Day,' 'Week,' 'Month,' 'Quar

What if you could see trouble from far, just imagine having some ability to foresee danger. This indicator has the ability to see consolidations before they are clear to everyone else. In the market everything is always fun until the market starts consolidating and often times by the time people realise it it's often too late. This Indicator will spot consolidations very fast and let you know at the top right of the chart so that you can either avoid losses by stopping to trade using trend follo
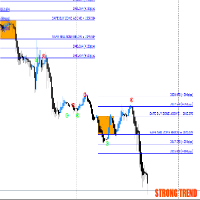
Introducing Breakout scalper system(BSS), an innovative and robust trading solution designed to elevate your trading experience to new heights. This sophisticated MetaTrader 4 compatible system is meticulously crafted to empower traders with precise buy and sell levels, strategic targets, and timely signals, all delivered with utmost accuracy and efficiency. Key Features: Buy and Sell Levels: Gain a competitive edge with carefully calculated buy and sell levels, providing you with clear entry an

O indicador é uma ferramenta desenvolvida para o MetaTrader, projetada para auxiliar na análise detalhada do comportamento do preço em relação a uma média móvel específica. Ao ser anexado ao timeframe diário, o ele realiza cálculos e monitora, em timeframes menores, quantas vezes o preço toca determinados níveis de afastamento durante o dias além de calcular a média dos toques.
MT5: https://www.mql5.com/pt/market/product/111710
FREE

Gobbo è un indicatore professionale che evidenzia il trend del mercato con un aspetto grafico chiaro e comprensibile, è basato sulla Moving Average e può essere impostato su qualsiasi periodo di intervallo, di default impostato sul periodo 14, scegliendo un periodo più alto evidenzierà meno cambi di tendenza per un approccio sul medio o lungo periodo, con un periodo più basso più cambi di tendenza per un approccio sul breve termine L'aggiornamento e l'adattamento al time frame scelto avviene in

Vision è un indicatore professionale che legge i dati storici del periodo impostato e in base a tali elabora una previsione scrivendo l'andamento sul grafico, l'impatto visivo eccellente rende chiaro l'andamento del prossimo trend e mette a fuoco il prezzo d'ingresso il posizionamento di ordini e la distanza per SL e TP, di default è impostato con un rapporto bilanciato 24 a 24 ciò significa che in base alle ultime 24 candele prevederà scrivendo sul grafico l'andamento delle 24 candele successiv

Key Features A key concept of technical analysis is that when a resistance or support level is broken, its role is reversed. If the price falls below a support level, that level will become resistant. If the price rises above a resistance level, it will often become support.
Horizontal support and resistance levels are the most basic type of these levels. They're simply identified by a horizontal line: Green Level in the chart, is Resistance Level. Red Level in the chart, is a Support Level.

The arrow indicator without redrawing shows potential entry points into the market in the form of arrows of the appropriate color: the up arrows (usually green) suggest opening a purchase, the red down arrows suggest selling. The appearance of arrows may be accompanied by beeps. It is usually assumed to enter at the next bar after the pointer, but there may be non-standard recommendations. Arrow indicators visually "unload" the price chart and save time for analysis: no signal – no deal, if ther

BBMA, which stands for Bollinger Bands and Moving Average , is a trading method that is quite popular and widely used not only in the forex market but also in the stock and commodity markets. This strategy is different from another version of BBMA called BBMA Oma Ally, which uses two Moving Averages. In the BBMA strategy, traders use the Bollinger Bands to spot possible changes in direction and the Moving Average to decide when it's a good time to get in on a trade .

The Liquidation Estimates (Real-Time) experimental indicator attempts to highlight real-time long and short liquidations on all timeframes. Here with liquidations, we refer to the process of forcibly closing a trader's position in the market.
By analyzing liquidation data, traders can gauge market sentiment, identify potential support and resistance levels, identify potential trend reversals, and make informed decisions about entry and exit points.
USAGE (Img 1) Liquidation ref
The Symbol Changer Indicator for MT4 is an amazing tool to switch and display any desired currency pair chart and any time frame. Forex traders can display the desired charts with the click of a mouse directly from any open chart. The symbol changer indicator for Metatrader is an essential tool for trend traders working with a top-down approach.
The symbol changer indicator shows all the available trading instruments in the market watch window. It also displays all the currency pairs as butto
FREE

O Afastamento da Média Móvel, é uma poderosa ferramenta de análise técnica projetada para fornecer uma representação visual do afastamento entre o preço atual e uma média móvel específica. Este indicador, desenvolvido para o MetaTrader, oferece aos traders uma perspectiva clara das mudanças na dinâmica de preço em relação à tendência de médio prazo. Versão MT5: https://www.mql5.com/pt/market/product/111704
FREE

1000% non-repaint high accuracy signal technical indicator. Solar wind Predator work on all pairs with high and low volatility Solar wind Predator work from the 1 minute timeframe to the Monthly timeframe Swing trading H1 to W1 Scalping M1 to M30 Blue arrows above the zero line look for buying(bullish) opportunities. Orange arrows below zero line look for selling(bearish) opportunities.

Discount for all previous purchasers of my products valid price at 75 $ only for today.The Swing Hit Perfect Master Indicator for MT4 displays accurate buy and sell signals on the chart and is no repaint and can be used on any pair, gold and indices. It's all in one the best indicator Swing and trend detection and is able to make precise entries. The indicator for MT4 points dots on the chart arrow after the swing high and low is maintained and takes perfect entries with the trend. The template

PYTHONFX
INCEPTION TRADING SYSTEM
THE BROKERS WORST NIGHTMARE...
IMPORTANT! After the purchase please send me a private message to receive the installation manual and the setup instructions.
We proudly introduce the PYTHONFX ROYAL CIRCLE Inception trading system, your key to financial freedom. This is the brokers worst nightmare. Seriously! Modern market conditions require modern solutions & if you are still struggling to analyse the charts and struggling to find consistency in the

BUY INDICATOR AND GET EA FOR FREE AS A BONUS + SOME OTHER GIFTS! ITALO LEVELS INDICATOR is the best levels indicator ever created, and why is that? Using high volume zones on the market and Fibonacci the Indicator works on all time-frames and assets, indicator built after 7 years of experience on forex and many other markets. You know many levels indicators around the internet are not complete, does not help, and it's difficult to trade, but the Italo Levels Indicator is different , the Ital

Are you an investor looking for long-term opportunities in the financial market?
I present to you the Custom Long-Term Trend Indicator. This indicator is designed for traders who wish to trade positions on longer timeframes than daily, weekly, and monthly charts.
With clear and precise signals, you will have the assistance you need to make informed decisions.
Key features:
Long-Term Strategy: This indicator is perfect for investors committed to long-term trading.
Recommended Timefr

TMA - Triangular Moving Average Indicator The TMA - Triangular Moving Average indicator is a powerful tool for traders seeking to analyze and identify trends in the financial markets. This indicator intelligently calculates triangular moving averages, providing valuable insights into market direction. Key Features: Ideal for longer timeframes: Recommended for use on periods above D1/W1/MN, offering a comprehensive view of long-term trends. Universal: Applicable to all currency pairs, offering v

Fnix Ma colored. This is a custom indicator designed to assist traders in identifying trends in financial markets. The MA - Master Trend Position Trade is a tool that calculates and displays moving averages to aid in the analysis of asset trends.
Key Features:
Calculates moving averages for trend identification. Recommended for use on timeframes above D1/W1/MN (Daily/Weekly/Monthly). Suggests the use of pending orders for analysis. Compatible with all currency pairs. Additional Details:

Introducing the Gold Massive Arrow indicator, exclusively designed for gold traders in both long-term and short-term markets. This cutting-edge tool provides high-probability trading signals without the need for numerous indicators, streamlining your trading experience in the dynamic gold market.
Tailored for traders of all styles, this 15-minute signal indicator offers the potential for both long-term and short-term traders to maximize profits within a single tool.
Crucially, the indicators

The Accurate Gold indicator is a user-friendly tool that is both intuitive and simple to use , regardless of traders' level of experience. It is designed for traders seeking precise signals on the M5 timeframe in the gold market. This indicator employs advanced mathematical algorithms to analyze price movements and volume dynamics, generating accurate buy and sell signals. The distinctive features of this indicator, including its non-repainting nature, provide traders with valuable insights in
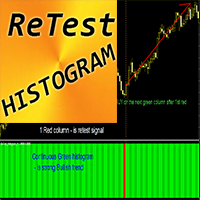
Forex Indicator "ReTest Histogram" for MT4 ReTest_Histogram indicator can be used for search of entry signals into the main trend direction after the retesting of strong S/R level ReTest Histogram can be in 2 colors: red for bearish trend and green for bullish one. Once you see steady consecutive histogram columns of the same color it means new trend takes place ReTest signal is 1 column with opposite color in histogram and next column with trend color (see the pictures) Indicator has built-i

All in one Indicator. Multiple market analysis tools. Non-Repaint Oscillator signals, Trend lines, Price channel, Fibonacci levels, Support and Resistance, Regression, Pivot levels, Candle Strength and Oversold/Overbought line detector. Includes buttons to hide or show. Advanced algorithms to detect important reversal points and draw trend lines or shapes automatically in appropriate areas. A simple and professional chart display, user friendly and easier to understand for faster and accurately

Only 20 days left! Don't miss the chance to s ecure your lifetime access at just $69. Enhance your trading experience with the Hydra Trend Rider Indicator, meticulously designed by MQL5 silver award winning developer to provide you with unparalleled market insights and empower your decision-making process. This advanced tool is perfect for traders seeking precision and efficiency in their trading strategies. Join our MQL5 Channel On purchasing our product, you will receive a comprehensive

The indicator shows the Fibonaccia golden ratio levels and the price balance line Has three different sensitivity options Allows you to visually navigate what state the market is in and where trend reversals are possible Works on all timeframes, on any currency pairs, metals and cryptocurrencies Can be used when working with binary options Distinctive features Based on the golden Fibonacci value; Determines the balance line of price equilibrium Has three different sensitivity settings; Simple an
FREE

MA MTF Overlay Chart is software that allows you to overlay the candlestick chart of a financial instrument with a second candlestick chart of the same one, or of another, financial instrument, by setting a different timeframe from that of the basic chart. The software is very simple to use and the input parameters are listed below.
Input parameters: Overlay chart set-up Financial instrument : financial instrument that you want to overlay on the base chart Time period : secondary instrum
FREE

Simple Trading System Update !!! Follow this link to see our 2024 Strategy !!! ( Download the EAs scanner )
INTRODUCTION : The strength meter is an trading tool that is used to identify trending and consolidating markets based on the percentage rate.
HOW TO USE IT :
You can use this indicator with Deal Trading Trend >> Click Here << To use this trading tool to identify trending and consolidating markets (the most important part)
FREE

The GGP Chandelier Exit Alert MT4 Indicator is a volatility-based indicator that identifies stop loss exit points for long and short trading positions. Chandelier Exit is based on the Average True Range (ATR) indicator. It is designed to keep traders in the trend until a defined trend reversal happens. Traders use CE to maximize their returns in a trade and make stop loss exit decisions. It is based on the principle that a trend reversal is highly probable when the price of an asset moves ag

The Buyside & Sellside Liquidity indicator aims to detect & highlight the first and arguably most important concept within the ICT trading methodology, Liquidity levels. SETTINGS
Liquidity Levels
Detection Length: Lookback period
Margin: Sets margin/sensitivity for a liquidity level detection
Liquidity Zones
Buyside Liquidity Zones: Enables display of the buyside liquidity zones.
Margin: Sets margin/sensitivity for the liquidity zone boundaries.
Color: Color option

Exclusive Limited Time Offer! Grab this useful indicator for a lifetime at just $49. Volatility indicator dashboard designed to revolutionize how traders perceive and navigate market volatility. Track volatile for multiple currency pairs one at time for multiple timeframes. Works best with Forex Market, Gold, Silver, Oil. Available in MT4, MT5. Indicator Features: Multi-Symbol, Multi-Timeframe Dashboard: Gain a strategic advantage by simultaneously monitoring volatility across various currenc

The GGP Trendlines with Breaks Alert MT4 Indicator is a technical analysis tool that can assist investors in identifying market trends. The indicator returns pivot point based trendlines with highlighted breakouts. Users can control the steepness of the trendlines as well as their slope calculation method. This indicator is MT4 conversion of the Trendlines with Breaks Indicator by “ LuxAlgo “ in Trading View website and some alert methods are added to provide real-time alerts when a trading sign

Fisher Yur4ik Indicator is a momentum indicator originated by Yuri Prokiev (Russian). I combined the Fisher Test indicator with other indicators to sieve/filter signals. It is not used as a standalone indicator but in combination to filter out Price Action signals. I have uploaded this indicator (Fisher test) for download alongside the 3Bar_Play signal indicator for signals to appear. It is free.
FREE

The "Angel Algo" indicator, designed for the TradingView platform, is a powerful technical analysis tool that assists traders in identifying dynamic support and resistance levels in real-time. It provides valuable insights into potential breakout points and market regimes.
At its core, the "Angel Algo" indicator utilizes a rolling window of price data to calculate maximum and minimum price levels. It then dynamically identifies support and resistance levels by examining specific conditions re
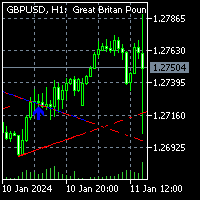
To get access to MT5 version click here . This is the exact conversion from TradingView: "Trendlines with Breaks" by LuxAlgo
This is a REPAINT indicator. Buffers are available for processing. However there are objects on chart to process also. All input fields are available. Alerts are generated based on bars closure. You can message in private chat for further changes you need. Thanks for downloading
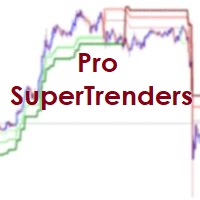
Dear traders! This indicator automatically plots SuperTrends across 3 timeframes. SuperTrend is a trend following indicator. However, it is not much useful on single timeframe, as that gives many whipsaws. Professionals analysis across multi timeframes before taking trades. This adds confluence to trade setups.For the same purpose, Pro SuperTrends shows trend (or absence of trend) on 3 timeframes. Our trading odds improve, when positions are aligned with higher timeframes. Further, SuperTren
Indicador de Trading UltraPreciso para MetaTrader 4: "Mr Beast Signals no Repaint with alerts" Descubra la revolución en el análisis técnico con nuestro indicador Quantum Precision Pro diseñado para MetaTrader 4. Este avanzado indicador combina algoritmos de vanguardia con inteligencia artificial para ofrecer señales de compra y venta extremadamente precisas en tiempo real. Características destacadas: Precisión sin Igual: Nuestro algoritmo utiliza una combinación de análisis técnico y patrones d

The 5X target indicator is an indicator that plots the optimal entry zone and the target for the trading day. It also plots a level where the stoploss can be moved to breakeven for a risk free trade which is 2X. This indicator has time window inputs. The default settings are from 02:00 to 19:00 CET+1 time zone. This indicator is based used with a direction bias for the day. I post the direction bias for several pairs in the comments section. Added a new feature Time Zone to help trade the highes
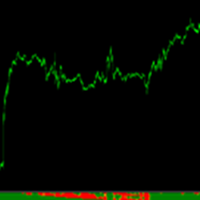
Power Real Trend es un indicador que no repinta y que muestra la dirección real que tiene el mercado, ofreciendo una clara manera de confirmar entradas. Es un indicador que para su constitución se realizan múltiples operaciones para formar los distintos rangos que se utilizan para su creación. Tiene un manejo muy sencillo dando sólo tres posibles valores (1,0,-1) altamente visual y de muy sencilla comprensión. La parte superior del mismo es la zona más sensible y la inferior corresponde a la te
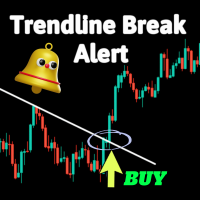
This is a simple indicator that provides an alert on trendline breaks. It can be useful if you are accustomed to using trendlines in your trading.Adjustable parameters include: Candle identifier: at which candle to signal after a breakout And three types of alerts: Send Email Audible Alerts Push Notifications
Watch this video to learn how to set up notification alerts on your phone: Settings Install guide: https://www.mql5.com/en/blogs/post/739828 https://www.mql5.com/en/blogs/post/751762

Product is converted from another platform and original created by TradeMaster Lite . Indicator basically uses MACD concept but enforces its abilities by different types of Averaging techniques. It is powerful for Trend and reversal identifying. Indicator is Multi-TF. Here is some details from original owner: We present a customizable MACD indicator, with the following features:
Multi-timeframe
Deviation bands to spot unusual volatility
9 Moving Average types
Conditional coloring and line c

If you are searching for a reliable indicator to trade the ICT concept,The ICT Market Structure provide a user manual for traders using more advanced strategies. This all-in-one indicator focuses on ICT Concepts(Smart Money Concepts). ICT Market Structure trying to understand how institutions trade, helping predict their moves. By understanding and utilizing this strategy, traders can gain valuable insights into market movements and finding more practical entries & exits based on price action. H
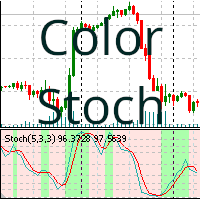
Stochastic Oscillator with Coloring
This indicator colors the background according to the trend of the indicator. The indicator colors the background according to the value of the stochastic oscillator, whether it is an uptrend or a downtrend. The background color is determined by the parameters of the stochastic oscillator, painting only the last 400 bars (see notes). Parameters that you can modify:
%K Period : The %K period %D Period: The %D period Slowing: The slowing period Price Field :
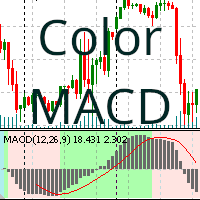
MACD Indicator with color background based on buy or sell trend
This indicator colors the background based on the value of the MACD (Moving Average Convergence Divergence) indicator, depending on its buying or selling tendency. The background color is determined based on the stochastic oscillator parameters, painting only the last 400 bars (see notes) and is used to measure the strength of a trend and the probability of a reversal.
The parameters you can modify are the same as those prov

This Indicator does not repaint itself at all, it's identifies a new TREND in the bud, this indicator examines the volatility, volumes and momentum to identify the moment in which there is an explosion of one or more of these data and therefore the moment in which prices have strong probability of following a new TREND.
CandleBarColorate never misses a beat, he always identifies a new TREND in the bud without error. This indicator facilitates the reading of charts on METATRADER; on a single wi

''A professional trader is a greedy trader: he buys at lows and sells at highs with minimal risks and high returns,,
Pips Slayer is developed exactly for such trading approach . It's a universal indicator for tracking reversals and uses price action patterns, discrepancy of custom indicators and a multi-layered formula for identifying reversal structures. The indicator is very easy to use; it only shows arrows where is recommended to buy or sell and recommended take-profit and stop-loss pric
FREE
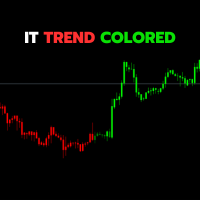
The IT Trend Colored indicator is a powerful tool designed by IT Trading (InfiniteTrades Software Corp) to assist traders in visually and effectively identifying market trends. This version is a custom indicator for the MetaTrader 4 trading platform.
Key Features:
• Trend Identification: The indicator uses a combination of simple moving averages (SMA) to determine the direction of the market trend.
• Intuitive Coloring: Upward trends are represented by bold green histograms, downward tren
FREE

ForexAnalysis Indicator that shows a whole series of information that the broker doesn't tell me, i.e.: volumes, swaps, that is, what I spend every day to leave it open, then you see the pivot with a suggestion on the operation and the stop loss to adopt. We see that with this new indicator, when the price approaches the zero line of the trade, which is automatically suggested, generally with Price Action signals on the screen, we are at an advantage because in the lower bar we have an indicati

The " Comfort Zone Signal " indicator identifies a daily zone that, when broken, has a high probability of the market continuing the established trend .
Upon signal, the indicator calculates stop loss and take profit, which can be set by you.
You can also set the trend. If the price is above the MA, it looks only for long positions, if below, it looks only for short positions.
You can choose to ignore the moving average and display all signals.
Additionally, you have the risk percentage d
FREE
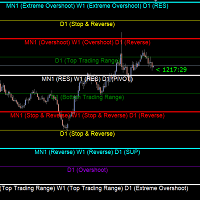
Gold Levels MTF - this is a fine stock technical indicator. The indicator algorithm analyzes the movement of the asset price, displays price levels of support and resistance from all time frames (TF) using the Murray method based on the Gann theory. The indicator indicates overbought and oversold fields, giving an idea of possible reversal points and at the same time giving some idea of the strength of the current trend. Description of levels: (Extreme Overshoot) - these levels are the ultimat

Donchian channels are a tool in technical analysis used to determine the relative volatility of a market and the potential for price breakouts.
Can help identify potential breakouts and reversals in price, which are the moments when traders are called on to make strategic decisions. These strategies can help you capitalize on price trends while having pre-defined entry and exit points to secure gains or limit losses. Using the Donchian channel can thus be part of a disciplined approach to manag
FREE

Candle size oscillator is an easy to use tool to figure out candle size from highest to lowest price of each candle. It's a powerful tool for price action analysts specifically for those who works intraday charts and also a perfect tool for short term swing traders. Kindly note that you can also edit the Bullish and Bearish candles with different colors.
#Tags: Candle size, oscillator, price action, price range, high to low, candle ticks _________________________________________________________
FREE

MP Price Change Indicator is a tool to calculate the price movement by percentage. The Value of this indicator can be adjusted to look back of the percent of price change within certain timeframes. This is a powerful tool when used by other indicators as well, such as ATR and ADR, for understanding price fluctuations and tolerance in different strategies. ___________________________________________________________________________________ Disclaimer:
Do NOT trade or invest based upon the analys
FREE

LLAMA MACD has been made from the same formula that creates regular MACD. The only difference is that both smoothing alogrithms has been replaced by the LLAMA (LagLess Adaptive Moving Average)
Main parameters are the same : 2) LLAMA Period (Fast) 1) LLAMA Period (Slow) 3) LLAMA Signal Period
and the LLAMA Parameters are the same as with the single AMA: 1) ActiveBar : computes last bar as well in Realtime (higher CPU usage) 2) ATRPeriod 3) ATRDistMul =: Multiplier1 (Detect) 4) ATRDistMul2 :

LLAMA BB has been made from the same formula that creates regular BB. The only difference is that the smoothing alogrithms have been replaced by the LLAMA (LagLess Adaptive Moving Average)
Main parameters are the same :
2) LLAMA Period
1) STDDEV Period
3) STDDEV Multiplier
and the LLAMA Parameters are the same as with the single AMA:
1) ActiveBar : computes last bar as well in Realtime (higher CPU usage)
2) ATRPeriod
3) ATRDistMul =: Multiplier1 (Detect)
4) ATRDistMul

Старый, добрый "AP" в версии трендового осциллятора. Это простой индикатор, который использует максимум возможностей языка MQL4. Но при этом он работает достаточно быстро даже на процессорах 1 Гигагерц и менее. При анализе следует обращать внимание на пересечение уровня 50, если вы намеренны использовать его как трендовый индикатор. Индикатор не перерисовывает, и работает на всех типах графиков и таймфреймах. Сделаны основные возможности оповещения, оповещения работают в обоих направлениях

This is a trend Predictor. Honestly I have to give some credit to some few developers I know personally because they helped pulled this off. The trend indicator uses special optics to direct the flow of price . it detects where the trend is moving into It uses price action and a few other embedded custom indicator. You can use it in all timeframes and will be available at a much cooler price.
Please test this Indicator before buying to make sure you like what you see. I can't guarantee th
The MetaTrader Market is the best place to sell trading robots and technical indicators.
You only need to develop an application for the MetaTrader platform with an attractive design and a good description. We will explain you how to publish your product on the Market to offer it to millions of MetaTrader users.
You are missing trading opportunities:
- Free trading apps
- Over 8,000 signals for copying
- Economic news for exploring financial markets
Registration
Log in
If you do not have an account, please register
Allow the use of cookies to log in to the MQL5.com website.
Please enable the necessary setting in your browser, otherwise you will not be able to log in.