Watch the Market tutorial videos on YouTube
How to buy а trading robot or an indicator
Run your EA on
virtual hosting
virtual hosting
Test аn indicator/trading robot before buying
Want to earn in the Market?
How to present a product for a sell-through
New Technical Indicators for MetaTrader 4 - 59
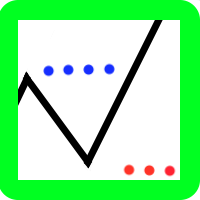
The indicator is a polyline (ZigZag segment) that tracks and connects the extreme points of the chart price that are at least a specified size apart from each other in points on the price scale.
The one and only setting is the minimum size (in points) of a ZigZag segment. The indicator displays levels to determine a possible trend reversal:
level "LevelForUp" - the breaking of this level determines the possible reversal of the trend up (to buy);
level " LevelForDown " - the breaking o

The Kolmogorov-Zhurbenko filter can be considered as a special window function designed to eliminate spectral leakage. This filter is optimal for smoothing stochastic (including financial) time series. The indicator based on this filter contains the following parameters: iLength - the period of the original rectangular window used to build the filter. Valid value is 2 - 255. iDegree - filter order. If iDegree=0, then a simple moving average will be obtained. If iDegree=1, then you get a triangu

Master Scalping M1 is an innovative indicator that uses an algorithm to quickly and accurately determine the trend.The indicator calculates the time of opening and closing positions, the indicator's algorithms allow you to find the ideal moments to enter a deal (buy or sell an asset), which increase the success of transactions for most traders. Benefits of the indicator: Easy to assemble, does not overload the chart with unnecessary information. Can be used as a filter for any strategy. Works on

Indicator of EARLY determination of the beginning of a new trend.
In addition, the indicator determines the global direction of the trend by the number of points: if there are more green dots (parameter Calculation of the global trend) - the trend is up; if there are more red dots, the trend is down.
The indicator does not redraw on the first candle.
The indicator can be used as an independent trading system, and as an addition to any other trading system.
The indicator can be used on any t
Ready trading strategy. The indicator shows price reversal points on the chart. In places of a possible price reversal, the indicator draws an arrow. If the indicator draws a green arrow, then the price will move up. If the indicator draws a red arrow, then the price will move down. The indicator also draws an average line on the chart. It is displayed in yellow. With a probability of 95%, if the indicator draws a green arrow, and the price is below the line, then in the near future the price w

OCTO TACK TREND INDICATOR
Summary/Description: Trend indicator showing signals to execute orders in favor of the current trend Get ready to have the best trend indicator you've ever tried. No repainting in any way, guaranteed It generates clear signals and always in favor of the trend (see screenshots) You just have to wait for the alert to indicate it and earn pip Are you tired of indicators that never work? Here we have the solution, try the free version and if you want to have more signals
FREE

OCTO TACK TREND PRO INDICATOR Summary/Description: Trend indicator Shows signals that tell you the current market trend Shows different signals to execute orders in favor of the current trend
Get ready to have the best trend indicator you've ever tried. It does not repaint in any way, once a signal has been captured, it remains there until it is finalized. It generates clear signals and always in favor of the trend (see screenshots) Just be attentive and wait for the alert to tell you when a ne
An indicator for you follow the trend. We are providing a group of indicators that can support you decisions...
At this one you are having access to the trend indicator. Please review the others indicators for trend availables... That you give you the ability to understand the market flow and also you will be developing your pacience...
Trend the market as professional... We are using the Average True Range Indicator! Hope you enjoy.
An indicator for you follow the trend candles.
We are providing a group of indicators that can support your decisions...
At this one you are having access to the candle trend indicator. Please review the others indicators for trend availables...
That you give you the ability to understand the market flow and also you will be developing your pacience... Trend the market as professional...
We are using the Average True Range Indicator! Hope you enjoy.

The Strategy Tester product is an indicator where you can both test and run strategies. There are 64 strategies in total in this indicator. It uses 3 indicators. You can test tens of thousands of strategies by changing the parameter settings of these indicators. You can run 6 strategies at the same time. With this product, you will now create your own signals.
Recommendations and Features Used indicators: Macd, Bulls power, Bears power It works on all time frame Recommended time fram
The Strategy Tester product is an indicator where you can both test and run strategies. There are 64 strategies in total in this indicator. It uses 3 indicators. You can test tens of thousands of strategies by changing the parameter settings of these indicators. You can run 6 strategies at the same time. With this product, you will now create your own signals.
Recommendations and Features Used indicators: Osma, Money Flow index, Stochastic It works on all time frame Recommended time

The Strategy Tester product is an indicator where you can both test and run strategies. There are 64 strategies in total in this indicator. It uses 3 indicators. You can test tens of thousands of strategies by changing the parameter settings of these indicators. You can run 6 strategies at the same time. With this product, you will now create your own signals.
Recommendations and Features Used indicators: Rsi, Bears power, Stochastic It works on all time frame Recommended time frame

The Strategy Tester product is an indicator where you can both test and run strategies. There are 64 strategies in total in this indicator. It uses 3 indicators. You can test tens of thousands of strategies by changing the parameter settings of these indicators. You can run 6 strategies at the same time. With this product, you will now create your own signals.
Recommendations and Features Used indicators: Rsi, Osma, DeMarker It works on all time frame Recommended time frame H1 You

The Strategy Tester product is an indicator where you can both test and run strategies. There are 64 strategies in total in this indicator. It uses 3 indicators. You can test tens of thousands of strategies by changing the parameter settings of these indicators. You can run 6 strategies at the same time. With this product, you will now create your own signals.
Recommendations and Features Used indicators: Stochastic, Macd, Williams Percent Range It works on all time frame Recommended time fr
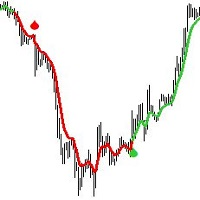
Introducing the Tear Drop Indicator: Your Gateway to Confident Forex Trading.
The Tear Drop Indicator is a powerful MetaTrader 4 tool designed to simplify trend identification and streamline entry point selection. Built upon customized Moving Average principles, this intuitive indicator offers traders an unparalleled advantage in navigating the forex market.
Key Features: 1. Customized Moving Average: The Tear Drop Indicator harnesses the power of customized Moving Averages, providing traders
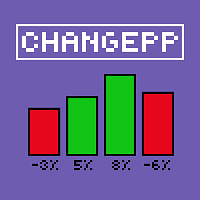
About the ChangePP indicator
The ChangePP indicator displays the percentage price change for the selected period according to the selected parameters and builds the corresponding bars in the indicator subwindow.
Clicking on a bar or pair name opens the corresponding chart with the period specified in the input parameters.
Without a doubt, the ChangePP trading indicator will be useful for traders using the correlation of currency pairs, as well as for analyzing the situation on the market.
FREE
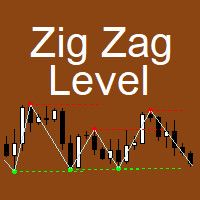
The indicator implements the author's approach to the construction of the popular "Zig-Zag" indicator.
The advantages of the "ZIgZag Level" indicator is that it filters out market noise and shows levels.
"ZIg Zag Level" is based on peaks and troughs, displays levels.
These levels can be disabled and configured.
The indicator displays the price of the level, the price tag can be disabled.
The "zigzag" line between the points can also be disabled.
The indicator has a built-in notification s

TrendMMK is an extremely simple indicator. The Buy and Sell signal changes as soon as the indicator flips over the closing price. When the TrendMMK closes below the Price, a Buy signal is generated, and when the TrendMMK closes above the Price, a Sell signal is generated.
TrendMMK is a trending indicator, and like all trending indicators it works well in trending markets. However, it does give lesser false signals than a lot of other indicators and hence if you are an intraday trader who want
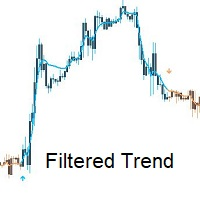
Introducing Filtered Trend: Your Reliable Companion in Forex Trading.
Filtered Trend is a powerful MetaTrader 4 indicator that revolutionizes trend identification and entry point selection in the forex market. Built upon customized Moving Average principles, this intuitive indicator offers traders a simple yet effective tool for navigating the complexities of currency trading.
Key Features: 1. Customized Moving Average: Filtered Trend leverages customized Moving Averages to provide traders wit

This indicator is very useful for day traders or short term traders. No need to calculate the number of pips manually, just look at the chart and you will see the Virtual Take Profit / Virtual Stop Loss target line and evaluate whether the entry point is feasible to reach the intended target or not.
Enter the intended Take Profit / Stop Loss pips for your trade. The indicator will display Virtual Take Profit / Virtual Stop Loss lines for you to easily see if the target is feasible or not.
FREE
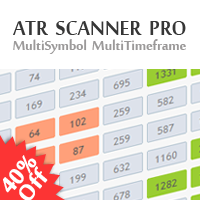
40% off. Original price: $50
ATR Scanner Pro is a multi symbol multi timeframe volatility scanner that monitors and analyzes Average True Range indicator value in up to 28 symbols and 9 timeframes in 3 modes : ATR value: As a volatility dashboard it shows the ATR indicator value in all pairs and timeframes and signals when the ATR value reaches a maximum or minimum in a given duration. Short term ATR/Long term ATR ratio: It shows ratio of 2 ATRs with different periods. It's useful in detecti
MACD Pro - Features a built-from-scratch overhauled MACD indicator - Signals Buy and Sell Zones - Uses an exceptional noise cancelling filter - Signals up trends and down trends - Precise and accurate signals
MACD Pro is an indicator built from the ground up and is designed to signal optimal buy and sell zones. Take buy trades in the buy zones and sell trades in the sell zones. It includes a noise cancelation feature which rivals the best products on the market.
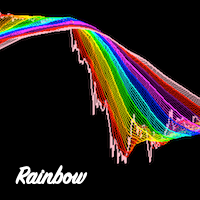
Rainbow Ribbon - Rainbow MA bands - Useful for spotting trend changes - Useful for spotting trend slopes - Useful for spotting trend acceleration - Ability to choose ribbon colors, moving averages, and distances - Provides colorful rainbow ribbons to show an array of moving averages
Rainbow Ribbon is an extremely useful indicator, it has been designed to make it easy to spot the trend and also changes within the trend before they occur. It can be used many different ways and provides the abili

KT Candlestick Patterns Scanner is a Multi-Symbol and Multi-Timeframe scanner that fetches and shows various candlestick patterns on 28 currency pairs and 9 time-frames concurrently . The scanner finds the candlestick patterns by loading the KT Candlestick Patterns indicator as a resource in the background.
Features
The scanner can find the candlestick patterns on 252* combinations of symbols and time-frames from a single chart. Open the signal's chart loaded with a predefined template with a s
Индикатор "TakeOver" простой в использовании, создавался он для удобства определения разницы между открытием и закрытием текущей свечи. "TakeOver" рекомендуется применять в скальпинге с различными стандартными индикаторами МТ4, к примеру Envelopes, ZigZag, RSI и т.д. В настройках по умолчанию установлены уровни 200 и -200, но вы можете самостоятельно изменить. Один из примеров обнаружения входа в открытие сделки изображено на скриншоте, SELL если свеча закрылась выше уровня Envelopes и гистогра
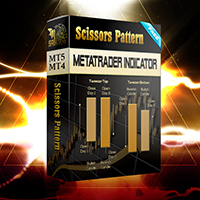
Configure scaffolding charts and signals based on the scissor pattern, which works great at low times.
Buy and sell signs based on 2 previous candle patterns
It works on the active time form, and when detecting the pattern in 4 time frames, 5 minutes, 15 minutes, 30 minutes and one hour, the alert can be set to notify us of the formation of this pattern.
MetaTrader version 5 click here
How to use:
When there is an opportunity to buy or sell, the marker places a scissors mark on the candlest

Moving averages change on the move. The indicator automatically selects the period for calculating moving averages. The more directional the movement, the longer the averaging period. When the trend slows down, the period of the moving averages decreases and they become faster. This allows you to react faster to a trend change.
The indicator works well in a trend or at a trend reversal point. In the sideways direction, the indicator can be used the other way around, for example, when a fast m
FREE
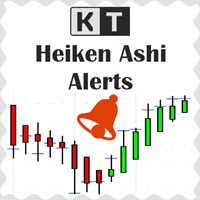
KT Heiken Ashi Alert plots the buy and sell arrows and generate alerts based on the standard Heiken Ashi candles. Its a must use tool for the traders who want to incorporate Heiken Ashi in their trading strategy. A buy arrow plotted when Heiken Ashi change to a bullish state from bearish state. A sell arrow plotted when Heiken Ashi change to a bearish state from bullish state. Mobile notifications, Email, Sound and Pop-up alerts included.
What exactly is Heiken Ashi? In Japanese, the term Heike
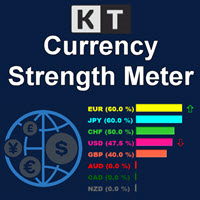
The KT Currency Strength Meter measures the individual currencies' strength and weakness by applying an aggregated mathematical formula over the major FX pairs. The strength is calculated using the bullish and bearish candles over a fixed period. After filling up the strength data, an algorithm sorts out the strongest and weakest currencies in a stack and updates their orders using the real-time incoming data.
Advantages
Improve your trading strategy instantly by filtering out the signals that
KT Aroon oscillator is the modified version of the original Aroon oscillator initially developed by Tushar Chande in 1995. It measures the time interval between the ongoing highs and lows and uses this deduction to calculate the market trend's direction and strength. It works on the notion that the price will form new highs consecutively during an uptrend, and during a downtrend, new lows will be formed. Buy Signal: When Aroon Up line cross above the Aroon Down line.
Sell Signal: When Aroon Dow
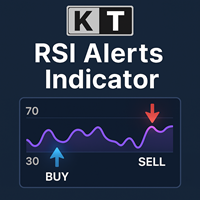
KT RSI Alerts is a personal implementation of the Relative Strength Index (RSI) oscillator that provide signals and alerts on four custom events: When RSI enter in an overbought zone. When RSI exit from an overbought zone. When RSI enter in an oversold zone. When RSI exit from an oversold zone.
Features A perfect choice for traders who speculate the RSI movements within an overbought/oversold zone. It's a lightly coded indicator without using extensive memory and resources. It implements all Me

Trading with the help of the MACD indicator has become even more convenient. Flexible settings will help you choose what you really need in your trading. Use the strategy that you need - the indicator uses 3 strategies. Download the demo right now! I recommend watching my advisor - Night Zen EA Subscribe to my telegram channel, link in my profile contacts - my profile See also my other products on mql5.com - my products Advantages of the indicator: In this indicator, the interpretation of th
FREE

MACD divergence indicator finds divergences between price chart and MACD indicator and informs you with alerts (popup, mobile notification or email). Its main use is to find trend reversals in the chart. Always use the divergence indicators with other technical assets like support resistance zones, candlestick patterns and price action to have a higher possibility to find trend reversals. Three confirmation type for MACD divergences: MACD line cross zero level Price returns to previous H/L Creat
FREE
Simple indicator that supports decision makers. You will have the candles directions for different timeframes on your screen. That will allowed you to be one more scenario to analyze before you open your orders. In case you would like to have more details, just let me know.. so we can add it to the chart. Multicurrency that in inform you the directions for multi-timeframes!
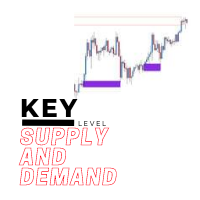
The key level supply and demand indicator is the first supply and demand indicator with options to change settings to show different zones, giving you the choice to pick the zones you see are being respected the most and saving the settings.
Advantages
The key level supply and demand DOES NOT REPAINT unlike other supply and demand currently in the market. This gives you a massive advantage to scroll back and see how price reacted on previous levels. The key level supply and demand has the opt

About the Lyne indicator
Lyne is a Metatrader 4 (MT4) indicator, the essence of which is to transform the accumulated historical data.
The Lyne indicator makes it possible to detect various features and patterns in price dynamics that are invisible to the naked eye.
Based on this information, traders can anticipate further price movement and adjust their strategy accordingly.
This indicator has proven itself in the scalping strategy. The indicator works without repainting.

Levels Pro System рассчитывает канал движения цены, учитывая волатильность инструмента, бары и тренд, - и на основании расчетных данных показывает тренд и чертит уровни поддержки/сопротивления в очень удобном визуальном представлении. В индикатор встроена система определения критических точек (критических баров), которая позволяет трейдеру значительно проще выявлять истинный пробой уровня, ложный пробой, отскок от уровня, возможный сигнал на ранней стадии движения цены итд. Таким образом, торгов
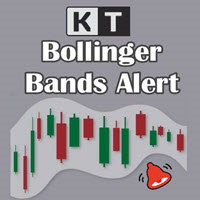
KT Bollinger Bands Alert is a modified version of the classic Bollinger Bands added with price touch alerts and visible price tags for each band separately.
Alert Events
When the current price touches the upper Bollinger band. When the current price touches the middle Bollinger band. When the current price touches the lower Bollinger band.
Features Separate alert events for each band. Ability to specify a custom interval between each alert to prevent repetitive and annoying alerts. Added price
Этот индикатор является уникальным в своём роде, больше всего подходит для скальпинга на XAUUSD а также для торговли на более старших таймфреймах!
Уведомление сообщит самые важные точки входа, поэтому следует торговать по тренду. Идеален для скальпинга! The Best Trend Signals - трендовый мультивалютный индикатор, может использоваться на любых финансовых инструментах валюта, криптовалюта, металлы, акции, индексы. Рекомендуемый тайм-фрейм M15, M30, H1, H4, D1.
Как торговать с помощью индикатора
FREE
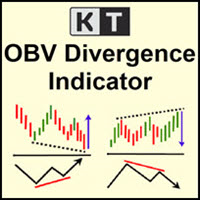
KT OBV Divergence shows the regular and hidden divergences build between the price and OBV - On Balance Volume oscillator.
Features
Unsymmetrical divergences are discarded for better accuracy and lesser clutter. Support trading strategies for trend reversal and trend continuation. Fully compatible and ready to embed in an Expert Advisor. Can be used for entries as well as for exits. All Metatrader alerts are available.
What is a Divergence exactly?
In the context of technical analysis, if the
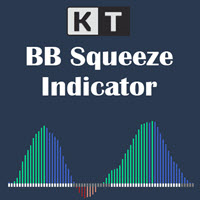
KT BB Squeeze measures the contraction and expansion of market volatility with a momentum oscillator, which can be used to decide a trading direction. It measures the squeeze in volatility by deducing the relationship between the Bollinger Bands and Keltner channels. Buy Trade: A white dot after the series of gray dots + Rising momentum above the zero line.
Sell Trade: A white dot after the series of gray dots + Rising momentum below the zero line. Markets tend to move from a period of low vola
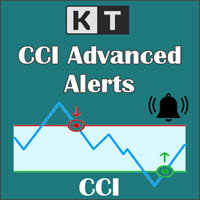
KT CCI Alerts is a personal implementation of the Commodity Channel Index (CCI) oscillator that provide signals and alerts on four custom events: When CCI enter in an overbought zone. When CCI exit from an overbought zone. When CCI enter in an oversold zone. When CCI exit from an oversold zone.
Features A perfect choice for traders who speculate the CCI movements within an overbought/oversold zone. Lightly coded without using extensive memory and resources. It implements all Metatrader alerts.
The KT QQE Advanced is a modified version of the classic QQE oscillator to depict it more accurately using the colored histogram with fast and slow Trailing Line(TL).
Unlike the classic QQE, the KT QQE Advanced consists of a histogram with overbought/oversold levels.
Applications
Find quick buy/sell signals across all the timeframes using the MTF scanner. Find the trend direction more accurately. Detects overbought/oversold market. Shows the price momentum.
Inputs RSI Period Smooth Period MT
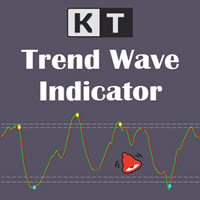
KT Trend Wave is an oscillator based on the combination of Price, Exponential, and Simple moving averages. It usually works great to catch the short term price reversals during the ongoing trending market. The bullish and bearish crossovers of the main and signal lines can be used as buy/sell signals (blue and yellow dot). It can also be used to find the overbought and oversold market. The buy and sell signals that appear within the overbought and oversold region are usually stronger.
Features
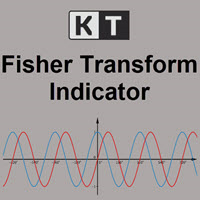
KT Fisher Transform is an advanced version of the original Fisher Transform oscillator equipped with divergence detection, crossover alerts, and many more features. Originally it was developed by John F. Ehlers. It converts the asset's price into a Gaussian normal distribution to find the local extremes in a price wave.
Features
A light-weighted oscillator that efficiently identifies the upward and downward crossovers and marks them using vertical lines. It also finds regular and hidden diverg

This indicator detects trade direction and sends notification to your mobile phone so that you can enter/exit a trade without having to be seated in front of desktop computer all day and night. Although you have to execute/send an order yourself, you can setup rules through the setting made available for proper lots size base on the available balance/fund you are trading with. The opportunity to take a profit at the right time and set reasonable stop loss that will not be overwhelming and gett

DayNight HighLow is base on support and resistance levels, as well as averages of highs and lows. It detects trade direction and sends notification to your mobile phone so that you can enter/exit a trade without having to be seated in front of desktop computer all day and night. Although you have to execute/send an order yourself, you can setup rules through the setting made available for proper lots size base on the available balance/fund you are trading with. The opportunity to take a profit

DayNight moving averages along with support and resistance make a remarkable difference if properly utilized This indicator detects trade direction and sends notification to your mobile phone so that you can enter/exit a trade without having to be seated in front of desktop computer all day and night. Although you have to execute/send an order yourself, you can setup rules through the setting made available for proper lots size base on the available balance/fund you are trading with. The opport
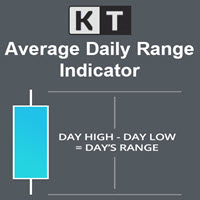
KT Average Daily Range(ADR) shows the upper and lower levels using the average daily range covered by the currency pair or the instrument. The average daily range is calculated using the chosen period in the input settings. ADR High: ADR upper level is found by adding the average daily range value to the current day's low.
ADR Low: ADR lower level is found by subtracting the ADR value from the current day's high.
Features
It shows the ADR levels with several other helpful information benefici

KT MACD Alerts is a personal implementation of the standard MACD indicator available in Metatrader. It provides alerts and also draws vertical lines for the below two events: When MACD crosses above the zero line. When MACD crosses below the zero line.
Features It comes with an inbuilt MTF scanner, which shows the MACD direction on every time frame. A perfect choice for traders who speculate the MACD crossovers above/below the zero line. Along with the alerts, it also draws the vertical lines
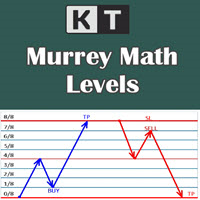
It shows the Murrey Math levels on chart and also provides an alert when price touch a particular level. T. Henning Murrey, in 1995, presented a trading system called Murrey Math Trading System, which is based on the observations made by W.D Gann.
Applications
For Murrey Math lovers, this is a must-have indicator in their arsenal. There is no need to be present on the screen all the time. Whenever the price touches a level, it will send an alert. Spot upcoming reversals in advance by speculatin
KT Pip Counter is a simple and informative indicator that shows some essential data and numbers on a real-time basis. Such critical information and data can benefit a trader during an intense trading session.
Features
Shows the current profit/loss in currency, pips, and percentage. Shows the current spreads. Shows the remaining time in the closing of the current bar. The different color schemes for profit/loss scenario. The text position and layout can be fully customized. It uses minimum CPU

KT Pivot Points automatically plots the daily, weekly, and monthly pivot levels on a chart with the precise calculation based on the latest data. Pivot points is a widely used indicator in technical analysis, particularly in the Forex market.
Features
Send alerts when the price touches the pivot level. It offers complete customization for each kind of pivot level. Shows daily, weekly, and monthly pivot levels without any fuss. It uses minimum CPU resources for faster calculation. Compatible
KT Candle Timer shows the remaining time in the closing of the current bar. You can use the bar closing time for multiple purposes, including time and trade management during the trading hours.
Features
It also shows the Symbol spreads along with the remaining time. It offers two convenient timer display positions, i.e., chart corner or next to the current bar. From colors to text size, it offers full customization according to user preferences. It is optimized to work without using extensive c
KT Bullish Bearish shows the bullish/bearish regime of the market in the form of a colored histogram representing both of the market states alternately. Bull Market (Blue Histogram): A bull market indicates an uptrend when an instrument price rises over a continued period like days, months, or years. Bear Market (Red Histogram): A bear market indicates a downtrend when an instrument price rises over a continued period like days, months, or years.
Applications
It prevents trading against the big
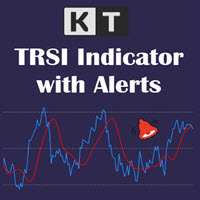
KT TRSI is an oscillator built using a combination of RSI (Relative Strength Index), EMA (Exponential Moving Average), and SMA (Simple Moving Average). Compared to the classic RSI, a TRSI is less susceptible to false signals due to the SMA's smoothing factor. Moreover, it is also equipped with all kinds of Metatrader alerts.
Simple Entry Rules
Buy: When the Blue line(RSI) crosses above the Red line(TRSI). Sell: When the Blue line(RSI) crosses below the Red line(TRSI).
Advance Entry Rules Buy:

KT SuperTrend is a modified version of the classic SuperTrend indicator with new useful features. Whether its Equities, Futures, and Forex, the beginners' traders widely use the Supertrend indicator. Buy Signal: When price close above the supertrend line.
Sell Signal: When price close below the supertrend line.
Features
A multi-featured SuperTrend coded from scratch. Equipped with a multi-timeframe scanner. The last signal direction and entry price showed on the chart. All kinds of MetaTrader

"The trend is your friend" is one of the oldest and best-known sayings in financial markets. However, this message only represents half of the picture. The correct saying should be, "The trend is your friend only until it ends." KT Trend Filter solves this problem by clearly indicating the start of an Uptrend and Downtrend using an averaging equation on the price series. If the trend direction is not clear, it shows the trend as sideways showing the uncertainty in the market.
Features
Get a big

The Vortex Indicator was first presented by Douglas Siepman and Etienne Botes in January 2010 edition of Technical Analysis of Stocks & Commodities. Despite its based on a complex implosion phenomenon, the vortex is quite simple to interpret. A bullish signal is generated when +VI line cross above the -VI line and vice versa. The indicator is mostly used as a confirmation for trend trading strategies. The Vortex was inspired by the work of Viktor Schauberger, who studied the flow of water in tur
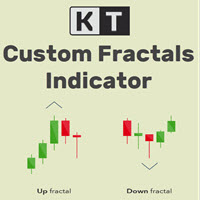
KT Custom Fractals is a personal implementation of the Fractal indicator first introduced by Bill Williams. With KT Custom Fractals you can choose a custom number of bars to allow to the left and right side of the fractal. For example, you can display the fractals that have "three" successive bars with the highest high in the middle and one lower high on both sides , or you can display the fractals that have "Eleven" consecutive bars with the lowest low in the middle and five higher lows on bot

KT Fractal Channel Breakout draws a continuous channel by connecting the successive Up and Down fractals. It provides alerts and also plots the Up and Down arrows representing the bullish and bearish breakout of the fractal channel.
Features
If you use Bill Williams fractals in your technical analysis, you must also include it in your trading arsenal. It can be very effective and useful for stop-loss trailing. A new market trend often emerges after a fractal channel breakout in a new direction.

KT Forex Volume shows the buying and selling volume of a currency pair in the form of a colored histogram. The volume is made of buying and selling transactions in an asset. In FX market: If the buying volume gets bigger than the selling volume, the price of a currency pair would go up. If the selling volume gets bigger than the buying volume, the price of a currency pair would go down.
Features Avoid the bad trades by confirming them using the tick volume data. It helps you to stay on the side

Day Trader Master is a complete trading system for traders who prefer intraday trading. The system consists of two indicators. The main indicator is the one which is represented by arrows of two colors for BUY and SELL signals. This is the indicator which you actually pay for. I provide the second indicator to my clients absolutely for free. This second indicator is actually a good trend filter indicator which works with any time frame. THE INDICATORS DO NOT REPAINT AND DO NOT LAG! The system is

Market Trend Catcher indicator analyzes the duration of trend movements and, with a certain development of the current trend, offers market entry points in the form of arrows with recommended profit targets. The indicator is very easy to use and does not require a lot of information to understand how it works. It has a minimum of settings and is transparent in understanding the principle of its operation, fully displaying the information on the basis of which it makes decisions on recommending e
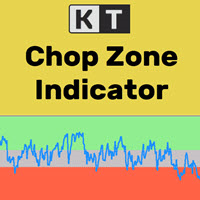
It's a well-known fact that most of the financial markets trend only 30% of the time while moving in a closed range rest 70% of the time. However, most beginner traders find it difficult to see whether the markets are trending or stuck in a range. KT Chop Zone solves this problem by explicitly highlighting the market phase into three zones as Bearish Zone, Bullish Zone, and Chop Zone.
Features
Instantly improve your trading by avoiding trade during the sideways market (Chop Zone). You can also

KT Volume Profile shows the volume accumulation data as a histogram on the y-axis providing an ability to find out the trading activity over specified time periods and price levels.
Point of Control (POC) in a Volume Profile
POC represents a price level that coincides with the highest traded volume within the whole volume profile histogram. POC is mostly used as a support/resistance or as an essential price level where market retest before going in a specific direction.
Features Very easy to u

The Quality trend indicator expresses the ratio of the strength of a trend or the speed of its growth (fall) to the degree of its noisiness or a certain norm of amplitudes of chaotic fluctuations of a growing (falling) price. The position of the indicator line above zero shows an increasing trend, below zero - a falling trend, the fluctuation of the indicator line near zero shows a flat. If the indicator line begins to fluctuate rapidly around zero and approach it, then this indica
Buy Sell Signal Low TF gives buy/sell signals and alerts with up and down arrow at potential reversal of a pullback or a trend continuation pattern in low timeframe. This is an indicator which gives signals based on trend => It works best in trend market with the principle is to ride on the trend not trade against the trend.
The components of Buy Sell Signal Low TF: - The trend is determined by SMMA 13 , SMMA 21 and SMMA 35 ( can be changed manually to suit your preference). - The signal is b
FREE
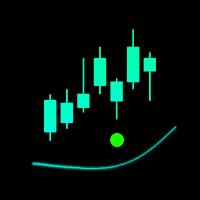
The indicator is designed for fast scalping. The principle of operation of the indicator is based on the direction of the Moving Average.
The period and sensitivity of the Moving Average can be adjusted for yourself in the indicator settings. I recommend watching my advisor - Night Zen EA
Subscribe to my telegram channel, link in my profile contacts. Advantages of the indicator: The free version is full, there are no additional purchases The arrows are not redrawn, the signal comes after co
FREE
Transition Angle is an arrow indicator for identifying potential entry points. I like it, first of all, because it has a simple mechanism of work, adaptation to all time periods and trading tactics. Suitable for trading on low timeframes because it ignores sudden price spikes or corrections in price action by reducing market noise around the average price. Works on all currency pairs and on all timeframes. Ready trading system. Take Profit is bigger than Stop Loss! Works on all currency pairs an
MetaTrader Market - trading robots and technical indicators for traders are available right in your trading terminal.
The MQL5.community payment system is available to all registered users of the MQL5.com site for transactions on MetaTrader Services. You can deposit and withdraw money using WebMoney, PayPal or a bank card.
You are missing trading opportunities:
- Free trading apps
- Over 8,000 signals for copying
- Economic news for exploring financial markets
Registration
Log in
If you do not have an account, please register
Allow the use of cookies to log in to the MQL5.com website.
Please enable the necessary setting in your browser, otherwise you will not be able to log in.