Watch the Market tutorial videos on YouTube
How to buy а trading robot or an indicator
Run your EA on
virtual hosting
virtual hosting
Test аn indicator/trading robot before buying
Want to earn in the Market?
How to present a product for a sell-through
New Technical Indicators for MetaTrader 4 - 39

Description: The CCI Arrow Indicator is a powerful trading tool designed to offer clear buy and sell signals based on the Commodity Channel Index (CCI). Buffer 0 signifies the buy signal, while Buffer 1 represents the sell signal, providing a straightforward visual representation of market conditions. Users can easily install and apply the indicator to their MetaTrader platform, where arrows indicate potential entry and exit points, aiding in informed trading decisions. A green arrow (Buffer 0)
This is Non-Repaint Indicator with Buy and Sell signals. Tradable Instruments: Forex, Cryptocurrency, Gold Signal GPT Indicator allows analysis to help traders identify entry and exit points in the market data.It's important to note that buy and sell indicators should not be used in isolation, but in conjunction with other forms of analysis, such as fundamental analysis and market sentiment. Traders should also be aware that no indicator is foolproof and that market conditions can change rapidl

Welcome to the world of trading and technical analysis. In today's fast-paced markets, understanding market sentiment and identifying potential entry and exit points is crucial for
successful trading.
One essential tool in a trader's arsenal is the Relative Strength Index, or RSI. And now, we introduce the Free RSI Heat Map, a powerful visualization tool that brings RSI data to life.
RSI Heat Map offers a comprehensive overview of the RSI values across multiple instruments, allowing traders
FREE

The Bar Size MA Indicator is a powerful tool designed to assist traders in identifying market volatility and price dynamics by offering a unique perspective on bar sizes. Developed for the MetaTrader 4 platform, this indicator can provide valuable insights for different trading strategies and can help in enhancing your trading decision-making process. The Bar Size MA Indicator calculates the moving average of bar sizes for a user-specified period. The 'bar size' is defined as the difference betw

[V 1.70] MTF NRPA 5 Moving Average RTD has been released! ( New algo 2025 ) Non repaint arrow real time dashboard. If you are looking for the best moving average indicator then you are on the right page. Generally people will install two moving averages because the intersection of the two moving averages (the crossover) will determine the direction of the next price trend. If the fast moving average intersects with the slow moving average and fast > slow then the trend is up. Conversely, if the

The Choppines robot is loaded as an indicator in the MT4 indicators folder
It is recommended to use a candle timing of 5 minutes, the recommended robot expiration time is 5 minutes.
The robot can be configured to send signals to MT2, MX2, PRICEPRO platforms. To send signals, you must use the connector program of the platform we want to work with.
To install on the connector, perform the following procedure (an image is attached describing the configuration with the MT2 platform connector):
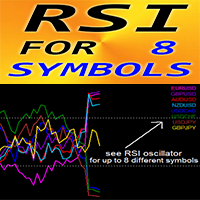
Forex Indicator "RSI for 8 Symbols" for MT4. No repaint. RSI is one of the most popular oscillators for trading. It is great to take Sell entries from strong OverBought zone (above 70) and Buy entries from strong OverSold zone (below 30). RSI is very useful for divergence detection. "RSI for 8 Symbols" gives opportunity to control RSI values of up to 8 different symbols just on 1 chart.
This indicator is excellent to combine with Price Action entries from OverSold/Bought

ICT Silver Bullet
If you are searching for a reliable indicator to trade the ICT Silver Bullet concept, or ICT concepts, Smart Money Concepts, or SMC, this indicator will respond to your need! This indicator will help you identify the following: FVG - fair value gaps Market structure: BOS and CHOCH. It is based on ZIGZAG as it is the most subjective way to do it. ICT Silver Bullet windows and related notifications when it starts and when an FVG appears Swing High and low that are potential bu

The Visual Volatility Clustering indicator clusters the market based on volatility. The indicator does not redraw and gives accurate data, does not use closing prices. Uses the opening prices or the highs or lows of the previous completed bar. Therefore, all information will be clear and unambiguous. The essence of the indicator is to divide the price market into certain areas according to a similar type of volatility. This can be done in any way. In this example, the indicator is configured fo

The Visual Volatility Clustering indicator clusters the market based on volatility. The indicator does not redraw and gives accurate data, does not use closing prices. Uses the opening prices or the highs or lows of the previous completed bar. Therefore, all information will be clear and unambiguous. The essence of the indicator is to divide the price market into certain areas according to a similar type of volatility. This can be done in any way. In this example, the indicator is configure

MP Squeeze Momentum is a volatility and momentum indicator derivated of "TTM Squeeze" volatility indicator introduced by John Carter. It capitalizes on the tendency for price to break out strongly after consolidating in a tight range. Introduction: The volatility component of MP Squeeze Momentum measures price compression using Bollinger Bands and Keltner Channels. If the Bollinger Bands are completely enclosed within the Keltner Channels, that indicates a period of very low volatility. This st
FREE

Description: The "Divergence Strategy Indicator" is an advanced technical analysis tool designed to identify potential trend reversals and continuation opportunities in the market through the powerful concept of divergence. By detecting divergences between price and all kinds of oscillators like MACD, RSI, ATR or Stochastic ... the indicator helps traders uncover hidden opportunities, signaling potential trend shifts. Real-time alerts keep users informed when new opportunities are detected. th
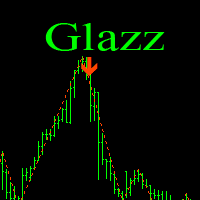
Glazz is a great mix of standard Bollinger Bands and ZigZag . The essence of the strategy - is the search for extreme points - possible reversals. When building a signal, we use Bands of a large period and a small ZigZag period. When the indicator has calculated the entire value for signal search, it shows an arrow to buy/sell and gives a sound signal. Simply put, ZigZag is looking for a possible reversal, and Bollinger Bands confirms this reversal.
The indicator settings are simple. By defaul
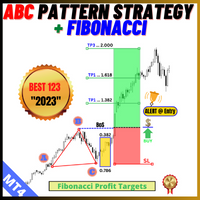
Description: The "ABC Pattern Strategy With Fibonacci" Indicator is a sophisticated technical analysis tool meticulously designed to recognize and leverage the power of the ABC chart patterns in combination with Fibonacci levels. This cutting-edge strategy empowers traders to make well-informed decisions in the dynamic forex market. By making spotting ABC patterns on price charts an easy task, the indicator offers insights into potential trend reversals or continuations. It seamlessly incorpor
The MT4 trend arrow indicator is a powerful tool for technical analysis that will help traders determine the direction of the trend in financial markets. This indicator is based on the use of several mathematical algorithms and methods of price analysis, which allows you to give accurate and transparent signals to enter the market.
The working timeframe is H1.
The description of the indicator includes up and down arrows that indicate the future direction of price movement. In addition, the i

Real Trade Entry indicator is designed for signal trading. This indicator generates trend signals.
It uses many algorithms and indicators to generate this signal. It tries to generate a signal from the points with the highest trend potential.
This indicator is a complete trading product. This indicator does not need any additional indicators.
The indicator certainly does not repaint. The point at which the signal is given does not change. Signals are sent at the beginning of new candles.

Manuscript is a time-tested indicator, many tests have been conducted in its use, I will tell all buyers my recommendations on using forex, cryptocurrency or binary options
This indicator gives a signal exactly at the close of the candle of the selected period
The arrow does not disappear after the signal, you can set up email notifications
I recommend using it on the period H1,H4,daily If you are aware of its work, you will be able to trade in a plus
In the future I will give you my recomm

This all-in-one indicator displays real-time market structure (internal & swing BOS / CHoCH), order blocks, premium & discount zones, equal highs & lows, and much more...allowing traders to automatically mark up their charts with widely used price action methodologies. Following the release of our Fair Value Gap script, we received numerous requests from our community to release more features in the same category. //------------------------------------// Version 1.x has missing functions + PDAr

This trend scanner indicator is using two main indicators to identify trends. Frist the EMAs to provide a view on Bullish / Bearish momentum. When the shorter EMA (calculated off more recent price action) crosses, or is above, the slower moving EMA (calculated off a longer period of price action), it suggests that the market is in an uptrend. Second the Stochastic RSI, When RSI is < 20 it is considered oversold, and when > 80 it is overbought. These conditions suggests that momentum is very str
FREE
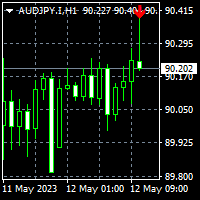
To get access to MT5 version please click here . This is the exact conversion from TradingView: "Hammer & ShootingStar Candle Detector" by "MoriFX". This is a light-load processing and non-repaint indicator. All input options are available. Buffers are available for processing in EAs. You can message in private chat for further changes you need. Thanks.
FREE

The indicator is based on the concept of price channels, which are formed by plotting the highest high and lowest low prices over a specified period of time. The Donchian Channel Indicator consists of three lines: an upper channel line, a lower channel line, and a middle channel line. The upper channel line represents the highest high over a specified period, while the lower channel line represents the lowest low. The middle channel line is the average of the two and can be used as a reference f
FREE
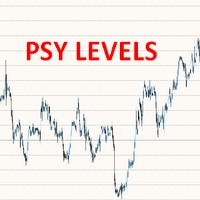
This free MT4 indicator allows you to automatically display psychological price levels on your chart It's very powerful when you combine it with other tools such as Fibs levels, Supports & Resistance levels, Moving Averages, Wyckoff schematics, etc. For example, you can use this indi to display horizontal levels every 100 points on your GER40 chart, or 500 points on your BTC chart, etc. ***Please comment, rate and share it to your friends if you like it***
FREE

THIS FREE INDICATOR ALLOWS YOU TO SET THE TIMEFRAME OF THE MA YOU WANT ON YOUR CHART For example, it's very useful if you want to trade the H4 200 SMA using a lower timeframe chart, to identify price reactions such as reversals, Wyckoff schematics, etc. ***Please comment, rate and share it to your friends if you like it*** ------------------------------------------------------------------------- Moving averages are popular technical indicators used to identify trends, support and resistance leve
FREE

基于股票软件黄金线指标改编。可根据需要调整参数值。具体使用规则请参考相关股票软件说明。 ////////////////////////////////////////////////////////////////////////////////////////// //股票公式源码如下:
VAR1:=(HIGH+LOW+OPEN+CLOSE)/4;
黄金线:EMA(3*VAR1-2*SMA(VAR1,2,1),13); //////////////////////////////////////////////////////////////////////////////////////////
声明 1 指标计算均基于价格变化而来, 不保证使用此指标的盈利性,作者不对使用此指标的任何损益负责。 2 本指标免费使用。
FREE

Description: For a comprehensive understanding of our indicators, we invite you to explore the entire Q&A section within this MQL5 blog post here . The "Divergence Strategy Indicator" is an advanced technical analysis tool designed to identify potential trend reversals and trend continuation opportunities in the market. It leverages the concept of divergence, a powerful phenomenon that occurs when price action diverges from an oscillator, indicating underlying shifts in market sentiment. Spot
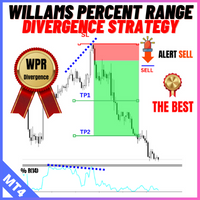
Description: For a comprehensive understanding of our indicators, we invite you to explore the entire Q&A section within this MQL5 blog post here . The "Divergence Strategy Indicator" is an advanced technical analysis tool designed to identify potential trend reversals and trend continuation opportunities in the market. It leverages the concept of divergence, a powerful phenomenon that occurs when price action diverges from an oscillator, indicating underlying shifts in market sentiment. Spo
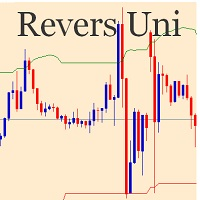
Индикатор разворота цены основанный на анализе трех таймфреймов. Когда вы выбираете параметр PERIOD, индикатор проводит рассчет по выбранному периоду и на два периода выше. Период М30 в рассчетах никак не участвует и его выбирать не рекомендуется. Максимальный верхний период для правильного рассчета применяйте не выше D1, т.к. в него уже войдут периоды W1 и MN. Период для установки индикатора выбирайте произвольно, а для более точного входа, я рекомендую М1,М5 и М15.
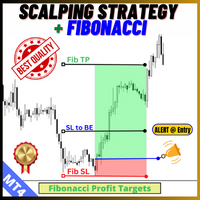
Description: For a comprehensive understanding of our indicators, we invite you to explore the entire Q&A section within this MQL5 blog post here . The "Scalping Strategy" Indicator is a cutting-edge technical analysis tool designed specifically for short-term traders who prefer to seize quick opportunities in fast-moving markets. As a scalping tool, it focuses on identifying rapid price fluctuations and generating concise yet actionable signals. Scalping Signals: Benefit from timely signals
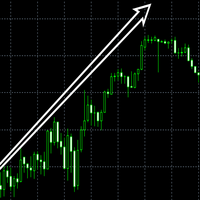
Absolute High Low indicator is a discretionary tool for assessing extremes in the price. It is very self-explanatory, and you can test against other default oscillators to see the difference. Combine with your trend following systems to master entry and exit at extremes. Back test and study the indicator to see the results up against a system or indicator. The indicator calculates a number of max bars so a gap will appear at the end, and it will restart. MT5 Version: https://www.mql5.com/en

The indicator offers a comprehensive suite of features for identifying key market areas, including: Supply Zones Demand Zones Fair Value Gaps (FVG) and provides alerts whenever price reaches a supply or demand zone. Key Features: Historical Zones: In addition to active zones, the indicator now includes historical supply, demand, and FVG zones, allowing for a deeper analysis of past price behavior. Flexible Zone Timeframes: Zones can be plotted independently of the chart's timeframe, enabling sce

A Clean and Easy to Use indicator, this indicator will Turn Lightblue when Price is Trending Up and LightRed when Price is Trending down. this indicator is one part of a set of three and when combined creates a full Trading Strategy. When used with Mint Channels and Mint RSi-CD you will take buy signals when price hits LightBlue upper channel and RSi-CD shows a LightBlue Bar Above Signal Line But only if Trend Indicator is Blue / if Price touches Bottom Red Channel and RSi-CD shows a red bar be

A Clean and Easy to Use indicator, this indicator will Draw a Lightblue channel and a LightRed Channel that you can use as a signal when price touches these lines. it can also be used to set stop loss and take profit values / Hint: set stoploss outside the channels and TakeProfit inside the channels. this indicator is one part of a set of three and when combined creates a full Trading Strategy. When used with Mint Channels and Mint RSi-CD you will take buy signals when price hits LightBlue uppe

A Clean and Easy to Use indicator, this indicator Shows a Lightblue Bar when price is headed up and a LightRed Bar when price is headed down for a Buy signal you want a Blue bar to show above the signal line / for a sell signal you want a Red bar to show below the signal line. this indicator is one part of a set of three and when combined creates a full Trading Strategy. When used with Mint Channels and Mint Trend you will take buy signals when price hits LightBlue upper channel and RSi-CD sho

PSI - индикатор скорости цены. Он основан на измерении длинны каждого поступающего тика в терминал. Таким образом мы можем понять насколько сильно (с какой скоростью) цена движется вверх или вниз, и видеть остановку движения цены.
При увеличенной тиковой скорости цены вверх (тики вверх имеют большую длину чем тики вниз) - индикатор показывает зеленую гистограмму, при увеличенной скорости цены вниз (тики вниз имеют большую длину чем тики вверх) - индикатор показывает красную гистограмму. Индикат

DAO HIDDEN CODE FX This offer is unique. We have not searched for the Holy Grail in the Amazon delta or dug out an Egyptian tomb. We assembled a warehouse and ordered indicators from programmers. Under a concept that was little noticed. Everyone but Tesla. And the ancient Taoists. 1.The logical concept is this: · The stock chart has only two dimensions - up or down. Buy or sell.Two vectors of movement. · The chart gives a third dimension - time. It moves from left to right.
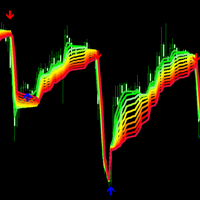
"Gradient adaptive rsi mt4" - adaptive forex indicator RSI, which is displayed on the price chart as a gradient. This indicator helps the trader determine the direction of the current trend, the strength of the trend, trend reversal points. "Gradient adaptive rsi mt4" - created for the Metatrader4 platform and can work on all currency pairs and timeframes. With the help of settings, this "Gradient adaptive rsi mt4" indicator can be adapted to work with different trading strategies. The "Gradien
" Mt4 neutral market indicator " indicator with arrows shows price reversal points. The lines show the direction of the trend or correction. If you look closely at the chart, you can easily notice that the accuracy of the arrows is quite high. The indicator shows signals well on all timeframes and currency pairs. When this indicator was created in conjunction with ChatGPT. Throughout the work on writing this indicator, we turned to the chat to create code and work algorithms. The joint work sho

BUY INDICATOR AND GET A PIVOT POINT EA FOR FREE AS A BONUS + SOME OTHER GIFTS! ITALO PIVOTS INDICATOR is the best pivot point indicator for strong price reversals and continuations of price movements ever created , and why is that? You will have for the first time inside a pivot point indicator the pivots above the monthly, so, you will have the 3-month pivot lines, 6 months, 1 year, 2 years, 3 years, 5 years and 10 years, very strong support and resistances. Not only that but for the fi

Using the Trend alternate indicator algorithm, you can quickly understand what kind of trend is currently developing on the market. The Trend Alternate Indicator accompanies lengths, can be used without instruments or timframes. With this indicator, you can try to predict future values. But the main application of the indicator is to generate signals for the purchase and sale. The indicator monitors the market trend with ignoring the sharp fluctuations in the market and the noise around the aver
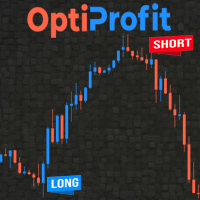
This indicator is a unique, high quality and affordable trading tool. The calculation is made according to the author's formula for the beginning of a possible trend.
An accurate MT4 indicator that gives signals to enter trades without redrawing! Download EA for this indicator https://www.mql5.com/ru/market/product/98089 Ideal trade entry points for currencies, cryptocurrencies, metals, stocks, indices! The indicator builds buy/sell arrows and generates an alert. Graphically displays the entr

Introducing our groundbreaking Forex indicator, specifically designed to help traders master the art of identifying critical support and resistance zones, as well as double top and double bottom patterns with unprecedented accuracy. Say goodbye to guesswork and hello to a powerful tool that will revolutionize your trading experience. Our proprietary indicator leverages cutting-edge technology to recognize key price levels where buying and selling pressures are poised to shift the market dynamic
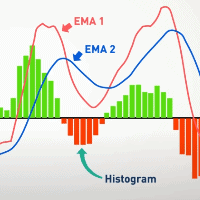
"Macdio trigger forex indicator for mt4" is a technical indicator that is used in trading on the foreign exchange market to determine when to enter and exit a position. This indicator is based on the signals received from the MACD indicator, which is one of the most popular indicators in technical analysis. The "Macdio trigger forex indicator for mt4" indicator can also be used to identify support and resistance levels, as well as identify overbought and oversold markets. If the indicator is in

Based on data from the Bank for International Settlements, 78.8% of the world's major 8 currency pairs can be checked instantly. It tells you whether the U.S. dollar is being bought or sold in a matter of seconds. So, even in the fast-moving phase after the release of economic indicators, you can see the flow and pushes of the U.S. dollar,
We are live-streaming the actual operation of the system. Please check for yourself if it is usable. Please check it out for yourself. https://www.youtube.c

Max Min Reversal Arrows - an arrow reversal indicator for predicting price movement. The indicator is built on the support and resistance levels at the local lows and highs of the price. Product features
Arrows appear on the current candle. The indicator does not redraw.
Can be used on all time frames and trading instruments. Recommended timeframes to use M30, H1, H4.
The dotted lines are the support and resistance levels within the signal. Price movement from these levels means a reversal.
Pr
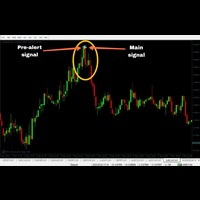
This Indicator has a accuracy in between 70-90% but it will work one time in a day. The timing is (MT4 time 18:00 to 18:05) Tickmill, Alpari, Amarket MT4 recommended. Although it will work on most of the MT4.
MT2 Auto trading supported: Buy buffer = 0 // Sell buffer = 1
Intrabar
Candle TF = M1
Trade Expiry = 1 minute or 5 minutes
No martingale required, but if you wish then you can take 1 step martingale.
Features: Neural Network based Advance price action algorithms Advance consolidation fi

The Trend Finding Channels indicator was developed to help you determine the trend direction by drawing channels on the graphical screen. It draws all channels that can be trending autonomously. It helps you determine the direction of your trend. This indicator makes it easy for you to implement your strategies. The indicator has Down trend lines and Up trend lines. You can determine the price direction according to the multiplicity of the trend lines. For example , if the Down trend lines s
FREE

Nice Stable Arrow indicator is designed for signal trading. This indicator generates trend signals.
It uses many algorithms and indicators to generate this signal. It tries to generate a signal from the points with the highest trend potential.
This indicator is a complete trading product. This indicator does not need any additional indicators.
The indicator certainly does not repaint. The point at which the signal is given does not change. Signals are sent at the beginning of new candles.

* All Symbols x All Timeframes scan just by pressing scanner button ** *** Contact me to send you instructions and add you in "Candle Scanner group" for sharing or seeing experiences with other users. Introduction: Candles tell their story. When looking at a candle, it’s best viewed as a contest between buyers and sellers. Candlestick patterns are used to predict the future direction of price movement. Candlesticks are an easy way to understand the price action. You can use candlesticks to decid

Description: For a comprehensive understanding of our indicators, we invite you to explore the entire Q&A section within this MQL5 blog post here . The "Divergence Strategy Indicator" is an advanced technical analysis tool designed to identify potential trend reversals and trend continuation opportunities in the market. It leverages the concept of divergence, a powerful phenomenon that occurs when price action diverges from an oscillator, indicating underlying shifts in market sentiment. Spo
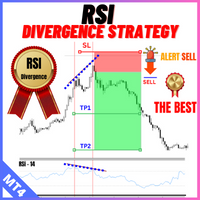
Description: For a comprehensive understanding of our indicators, we invite you to explore the entire Q&A section within this MQL5 blog post here . The "Divergence Strategy Indicator" is an advanced technical analysis tool designed to identify potential trend reversals and trend continuation opportunities in the market. It leverages the concept of divergence, a powerful phenomenon that occurs when price action diverges from an oscillator, indicating underlying shifts in market sentiment. Spot
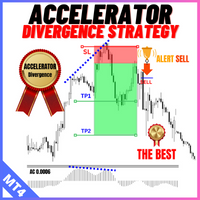
Description: For a comprehensive understanding of our indicators, we invite you to explore the entire Q&A section within this MQL5 blog post here . The "Divergence Strategy Indicator" is an advanced technical analysis tool designed to identify potential trend reversals and trend continuation opportunities in the market. It leverages the concept of divergence, a powerful phenomenon that occurs when price action diverges from an oscillator, indicating underlying shifts in market sentiment. Spo

Description: For a comprehensive understanding of our indicators, we invite you to explore the entire Q&A section within this MQL5 blog post here . The "Divergence Strategy Indicator" is an advanced technical analysis tool designed to identify potential trend reversals and trend continuation opportunities in the market. It leverages the concept of divergence, a powerful phenomenon that occurs when price action diverges from an oscillator, indicating underlying shifts in market sentiment. Spot
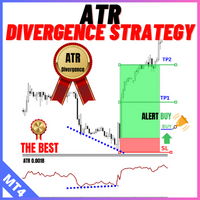
Description: For a comprehensive understanding of our indicators, we invite you to explore the entire Q&A section within this MQL5 blog post here . The "Divergence Strategy Indicator" is an advanced technical analysis tool designed to identify potential trend reversals and trend continuation opportunities in the market. It leverages the concept of divergence, a powerful phenomenon that occurs when price action diverges from an oscillator, indicating underlying shifts in market sentiment. Spo

Description: For a comprehensive understanding of our indicators, we invite you to explore the entire Q&A section within this MQL5 blog post here . The "Divergence Strategy Indicator" is an advanced technical analysis tool designed to identify potential trend reversals and trend continuation opportunities in the market. It leverages the concept of divergence, a powerful phenomenon that occurs when price action diverges from an oscillator, indicating underlying shifts in market sentiment. Spo
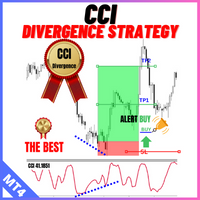
Description: For a comprehensive understanding of our indicators, we invite you to explore the entire Q&A section within this MQL5 blog post here . The "Divergence Strategy Indicator" is an advanced technical analysis tool designed to identify potential trend reversals and trend continuation opportunities in the market. It leverages the concept of divergence, a powerful phenomenon that occurs when price action diverges from an oscillator, indicating underlying shifts in market sentiment. Spo
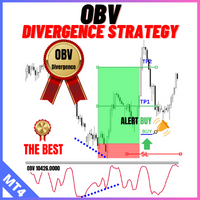
Description: For a comprehensive understanding of our indicators, we invite you to explore the entire Q&A section within this MQL5 blog post here . The "Divergence Strategy Indicator" is an advanced technical analysis tool designed to identify potential trend reversals and trend continuation opportunities in the market. It leverages the concept of divergence, a powerful phenomenon that occurs when price action diverges from an oscillator, indicating underlying shifts in market sentiment. Spot

Description: For a comprehensive understanding of our indicators, we invite you to explore the entire Q&A section within this MQL5 blog post here . The "Divergence Strategy Indicator" is an advanced technical analysis tool designed to identify potential trend reversals and trend continuation opportunities in the market. It leverages the concept of divergence, a powerful phenomenon that occurs when price action diverges from an oscillator, indicating underlying shifts in market sentiment. Spot
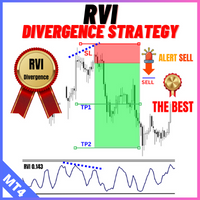
Description: For a comprehensive understanding of our indicators, we invite you to explore the entire Q&A section within this MQL5 blog post here . The "Divergence Strategy Indicator" is an advanced technical analysis tool designed to identify potential trend reversals and trend continuation opportunities in the market. It leverages the concept of divergence, a powerful phenomenon that occurs when price action diverges from an oscillator, indicating underlying shifts in market sentiment. Spo
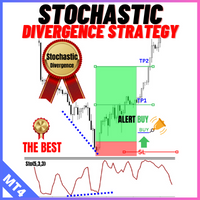
Description: For a comprehensive understanding of our indicators, we invite you to explore the entire Q&A section within this MQL5 blog post here . The "Divergence Strategy Indicator" is an advanced technical analysis tool designed to identify potential trend reversals and trend continuation opportunities in the market. It leverages the concept of divergence, a powerful phenomenon that occurs when price action diverges from an oscillator, indicating underlying shifts in market sentiment. Spo
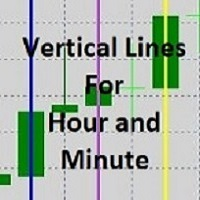
MT4 Indicator that puts up to 4 vertical lines for each selected hour and minute. Vertical line color and thickness are adjustable Input parameters: lineEnabled1 = true lineEnabled2 = true lineEnabled3 = true lineEnabled4 = true lineColor1 = Red lineColor2 = Blue lineColor3 = Green lineColor4 = Yellow lineTime1 = "12:00" lineTime2 = "14:00" lineTime3 = "16:00" lineTime4 = "18:00" lineWidth1 = 1 lineWidth2 = 1 lineWidth3 = 1 lineWidth4 = 1

hello friend, there is an active adx based indicator for binary options, it only operates on 1 currency (eurusd) on TF M1, it operates the signal on the next candle. indicator test results within 2 months are very satisfactory, accuracy exceeds 85%. very optimal run in markets that issue news (medium impact and high impact). so of course it is very optimal, only a 1 month and lifetime trial is available.For orders, please go to the telegram developer: https://t.me/AgresivetradingSupport (@agresi

Market Viewer gives a quick glance on correlation and direction. This indicator takes a list of symbols (max 8) Leave a symbol setting empty if you wish not to use that many - like in the defaults… It will check for each timeframe (Monthly, Weekly, Daily, H4, H1, 30min, 15min, 5min and 1min) if the current candle on that timeframe is bullish or bearish. This will give a good indication of the direction for us to trade in. We need to be in sync with the bigger timeframes.

The Moving Average Convergence Divergence (MACD) trading strategy is a popular technical analysis tool that is used to identify changes in momentum and trend direction. The MACD is calculated by subtracting the 26-period exponential moving average (EMA) from the 12-period EMA. A 9-period EMA, called the "signal line," is then plotted on top of the MACD to act as a trigger for buy and sell signals.
The MACD is considered to be in bullish territory when the MACD line is above the signal line and
FREE

Save time and make more informed decisions with Sweet VWAP Aux If you haven't already downloaded our free VWAP indicator for Metatrader 4 , do it now and experience its incredible capabilities for visualizing anchored vwap. Then come back here and get to know Sweet VWAP Aux - the perfect extension for your Sweet VWAP indicator. With just one click, Sweet VWAP allows you to anchor the VWAP indicator at the point of your choice, saving time and eliminating the need to set it up manually. In additi

Available for MT4 and MT5 . Join the Market Structure Patterns channel to download materials available for study and/or additional informations.
Related posts: Market Structure Patterns - Introduction Market Structure Patterns is an indicator based on smart money concepts that displays SMC/ICT elements that can take your trading decisions to the next level. Take advantage of the alerts , push notifications and email messages to keep informed from when an element is fo

Introducing Auto Trendline, the innovative MT4 indicator that automates the process of
drawing trendlines on your charts.Say goodbye to the tedious and time-consuming task of manually drawing trendlines,
and let Auto Trendline do the work for you!
*Contact me after the purchase to send you instructions and step by step guide.
With its advanced algorithm, Auto Trendline automatically detects and draws trendlines for you,
saving you time and effort.Simply attach the indicator to your chart, and
Presenting the SMT Divergence indicator, a versatile tool designed to aid in analyzing market dynamics.
The indicator helps identify divergences between the highs and lows of two correlated major currency pairs during specific market periods ("killzones" abbrev. KZ). These periods are characterized by increased market activity, allowing traders to observe market behavior more closely.
The indicator provides customizable options to adjust time settings and visually display the divergences and

The best instrument for scalping. It allows you to always be correctly positioned in the price. It's a simple and extraordinarily powerful visual reference. Very suitable for price action. It consists of four components. 1. Fork. There are two levels that surround the price and mark the rebound points. They can be varied independently with 4 associated controls, two for each level. Its amplitude is indicated in pips in the indicator data. The minimum fork is updated with each tick. It has

The MACD (Moving Average Convergence Divergence) indicator is one of the most widely used technical analysis tools by traders worldwide. Created by Gerald Appel in the 1970s, the MACD is an indicator that helps investors identify the trend direction, trend strength, and possible trend reversal points. The MACD indicator is composed of a histogram that shows the difference between the 12-period exponential moving average and the 26-period exponential moving average. The top part of the histogram
FREE
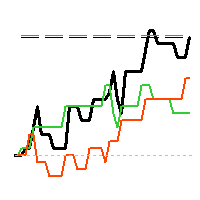
"AV Monitor" is an indicator for MetaTrader 4, which alowes a history analysis of the closed orders. It helps to achieve a quick visual analysis of your own trading or different expert advisors among themselves. Compare and analyze your expert advisors: Which one is the best?
I use an "AV Monitor MT5" indicator per running expert advisor chart to track its performance split into long & short, as well as an index chart e.g. DOW with this indicator and the setting "Show Balance & Equity" to track
The MetaTrader Market is the only store where you can download a free demo trading robot for testing and optimization using historical data.
Read the application overview and reviews from other customers, download it right to your terminal and test a trading robot before you buy. Only on the MetaTrader Market you can test an application absolutely free of charge.
You are missing trading opportunities:
- Free trading apps
- Over 8,000 signals for copying
- Economic news for exploring financial markets
Registration
Log in
If you do not have an account, please register
Allow the use of cookies to log in to the MQL5.com website.
Please enable the necessary setting in your browser, otherwise you will not be able to log in.