Watch the Market tutorial videos on YouTube
How to buy а trading robot or an indicator
Run your EA on
virtual hosting
virtual hosting
Test аn indicator/trading robot before buying
Want to earn in the Market?
How to present a product for a sell-through
New Technical Indicators for MetaTrader 4 - 62

Toroid - The indicator reflects information in a visual form, it can be used both for pipsing on small periods and for long-term trading. It generates fairly frequent and accurate signals. The indicator can be used as the main one for determining the trend. The indicator can work both for entry points and as a filter. Uses two parameters for settings. The smart indicator algorithm detects the trend, filters out market noise and generates input signals. It is based on the signals of elementary in
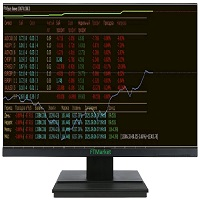
Are you looking for monitoring services to watch trading in the terminal?? You don't need it anymore!! Full monitoring is right in your terminal. There are a couple of strokes left and you can buy it both for real and for a demo test Параметры Parameters:
Max///Statistics Month///Statistics A week///Statistics Day///Statistics
For an open pair:
Symbol Number of orders To buy In villages Density separation Buy profit Sell profit Weekly profit Total profit Drawdown
There is also a built-i

See RSI values turned into colored candles
This indicator provides both colored candles and a colored moving average. 6 drawaing styles are provided to allow customization of the color coding.
Applying coding to the chart may help in conceptualizing price trend and impulse movements defined through RSI values.
Features - optional colored candles - optional colored ma - 6 draw styles; RSI slope RSI above/below overbought/oversold levels RSI above/below level 50 RSI above/below it's moving aver
FREE

Know2fly - unique modular add-ons for Metatrader 4
The quickest therefore the first of a series of as fun as strong modules thoroughly designed to give you a more deep insight into the dynamics of the financial markets and, as a result, improve your trading performance in case you are into this.
Module 1:
fun fast alround leightweight ask bid spread rsi dynamics on-onchart visualisation indicator
fun = imagine a quickly flying dog with carpet ... leaving a trail of fire and smoke ... f
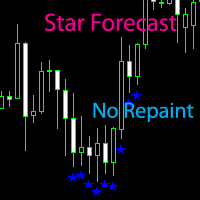
Star forecast is an analytical toolkit used to help currency traders with foreign exchange trading analysis through technical charts and indicators. Forex forecasting which help analysts and traders to determine appropriate and profitable entry and exit points for their forex trades. *Non-Repainting *For Desktop MT4 Only *Great For Intraday
*Great For Swing Trading *Star Appears at The "Close Of The Candle" *Attach On H1 Timeframe for see Daily Trend
*Works On Any Mt4 Pair *Perfect For New Tr
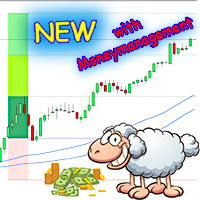
Bring the "sheep" into the dry.
The blue channel represents the river. The "sheep" have to be brought into the dry over this river so that they can graze on the pasture. Whereby the "sheep" are the candles and the "grazing" are the profit.
Entry for long trades is the high of the first candle, which closes completely above the channel. Reversed accordingly for shorts.
Stop Loss as you please. It is best to be below the last low. Take Profit can either be set according to CRV, according

A flexible 2-Line MACD indicator The default MACD indicator inside MT4, limits you to using the MACD with a fast-EMA, slow-EMA, and signal-SMA. This MACD indicator allows you to set your own MA-Method choices for these 3 components, separately! You can select from SMA-EMA-SMMA-LWMA-DEMA-TEMA, and can even use a separate method for each 3 fast-slow-signal periods. On-chart colored candles, with drawing condition types is included, with a show/hide button too.
Features - MA Methods: SMA, EMA, S

Supply and Demand indicator does not repaint as it counts the number of tests/retests occurred in the past x number of times. As a trader you need a path to be able to place your buy and sell trades such as: Supply and Demand, Falling & raising channels . Experienced trades will draw the key levels and channels around the timeframes. But, they will not be able to draw them on the small time frames as the price changes too frequent. This indicator is based on Shved supply and demand indicator, b
FREE

A flexible 2-Line MACD indicator The default MACD indicator inside MT4, limits you to using the MACD with a fast-EMA, slow-EMA, and signal-SMA. This MACD indicator allows you to set your own MA-Method choices for these 3 components, separately! You can select from SMA-EMA-SMMA-LWMA, and can even use a separate method for each 3 fast-slow-signal periods. A more featured version is available with colored candles+conditions, full alerts+conditions, line coloring, DEMA and TEMA options; MACD MAX
FREE

Indicator support for only: Entry Point to Trend Pro Link indicator support : https://www.mql5.com/en/market/product/70867
Supports all currency pairs declared in the definition. Help investors do not need to open many charts. Notice the DEAL: multiple time frames confluence M15, H1, H4.
Entry Point to Trend Pro The indicator helps investors to identify the earliest and perfect reversal point. Easy to make decision to trade with the trend Price action trading. support resistance
FREE
What is a tool ? This indicator use for forecast direction of the 28 pairs, Calculates from multiple pairs and timeframes and present by percentage as 70-79% , 80-89% , 90-100% is a little, medium and strong trend. How to use Place the indicator on any pair and any timeframe. Pair : Any Timeframe : Any Input Parameter No Visit my products Target Profit Magic Target Profit All The Profit Tracker Currency Scoring Pair Direction
FREE

a novel indicator by the maker of velvet.
FREE

What is a tool ? This indicator use for comparison of 8 major currency from 28 pairs and multiple timeframes and calculates a score of strength from 0-100. How to use Place the indicator on any pair any timeframe, And entering only the value of X Y position to be displayed in the graph. Pair : Any Timeframe : Any Input Parameter Start X Position : Value of X on chart Start Y Position : Value of Y on chart Visit my products Target Profit Magic Target Profit All The Profit Tracker Currency
FREE
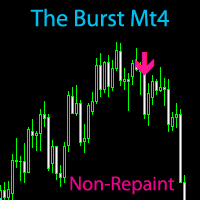
The Burst MT4 Hurry and Buy Before Price Doubles Tomorrow! *Non-Repainting Indicator "The Burst" is an indicator that shows precise Buy and Sell Trades. A great arsenal to add to any chart. It's Best to Use The D1,H4 or H1 chart "The Burst" is designed to alert BUY and SELLS. So Of course, For the best take The Arrows In a Uptrend or Downtrend Only For Confirmation
*Non-Repainting *For Desktop MT4 Only *Great For Scalping *Great For Intraday
*Great For Swing Trading *Arrow Appears at The "Clo
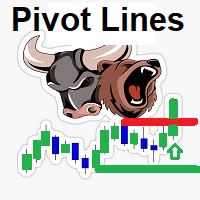
::: FREE FOR A LIMITED TIME !!!! the Smart Pivot Lines detection indicator It detects market direction By identifying super candles and major support resistance levels It detects the major breakout Candles amplified by the volume and Candle body size and shows it in a separate window to give a great indication of market power and direction Support resistance lines are detected by a unique strategy using tick volumes , bars patterns and bars size
- if Bears dominates :: Price will be below

Индикатор предназначен для переключения ТФ. Если у вас стоит советник который зависит от текущего ТФ, тогда это вещица вам необходима. Выставление ТФ происходит по количеству ордеров или по набранной лотности. К примеру, для ясности, если ваш советник начинает просаживаться, набирая сетку, то индикатор переключает ТФ автоматически, на увеличение ТФ и не даёт набирать лотность. Как только он закрыл сетку, происходит автопереключение на М1 и по новой. Так ваш советник торгует как скальпер и далее
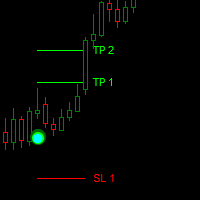
Dark Point is an Indicator for intraday trading. This Indicator is based on Trend Following strategy, also adopting the use of the atr to determine the right volatility. We can enter in good price with this Indicator, in order to follow the strong trend on the current instrument. If you love Dark Point, consider adding some power: Dark Power
Key benefits
Easily visible take profit/stop loss lines Intuitive directional points/arrows by colors Useful statistics , which indicate the win
FREE

Scalping dynamic system - a dynamic system for determining price reversals. The indicator looks for price reversal points on the chart and puts arrows in these places. When the indicator draws a blue arrow, there is a high probability that the price will reverse up. When the indicator draws a red arrow, there is a high probability that the price will reverse down. The use of this indicator in the trading process is very simple. In the video below the description, we will show in detail how to t

3 strategies with RSI! Alerts! Signal freshness check! The indicator is based on the classic RSI. I recommend watching my advisor - Night Zen EA It includes 3 strategies: Entry of the RSI indicator into the overbought zone (for buy trades) / oversold (for sell trades) Exit of the RSI indicator from the overbought zone (for sell trades) / oversold (for buy trades) Touching the overbought limit (for sell trades) / oversold (for buy trades) The indicator provides alerts. To enable them in the s
FREE

Story - arrow indicator Forex without redrawing. When a suitable moment for buying appears, the indicator generates a signal exactly at the moment of its appearance and not below or above the current candle. The arrow will be exactly at the price where the signal appears and will not change its position. When the price changes, the indicator does not redraw its signals. As a result, a trader, having opened a position, may not worry that the indicator will suddenly change his "opinion" regarding

Fargo does not change its readings, it is a technical indicator in the Forex market without redrawing. It combines several filters to display market entry arrows on the chart. You can note the accuracy and clarity of the signals of this pointer indicator. When a suitable moment for buying appears, the indicator generates a signal exactly at the moment of its appearance and not below or above the current candle. The arrow will be exactly at the price where the signal appears and will not change

Emergency trend technical indicator is used to analyze price movements in the Forex market. It is included in the so-called arrow indicators. And it is very practical in that it forms arrows in places where buy signals appear, or, conversely, sell signals.
Naturally, do not forget that any indicator is just an assistant, not a magical tool, by the will of which you will become fabulously rich.
Unfortunately, many novice traders forget about this, they see a potential grail in each indicator
Channel indicator Forex Signal Jurassic is designed for the fact that the price will continue to move within the channel, but not for a long time. The channel does not always intersect with the price, when the price goes beyond the channel boundaries, it can be closed with stops. The indicator assumes selling when the resistance level is reached and buying at the support level. Also, the required points are indicated by arrows, and the indicator uses a custom filter to limit some signals. Positi

The Joker trend step indicator analyzes the state of the market, the phase of its movement and largely determines the success of a trader in his difficult work. Many newcomers who first enter the market are often more fortunate than a professional who has spent years learning. The reason for this phenomenon is the unconscious falling of newcomers into the trend, when, even without any indicators, it becomes clear where the market is heading. But the Joker indicator will give you stability if you

City Lights monitors the formation of the trend and helps the user to identify the entry points. Thanks to this data, the investor is able to predict the situation and form a strategy for the game. It is trend signals that allow clients of brokerage companies to achieve the efficiency of using trading instruments and achieve the best profitability.
Correct calculation of the current trend is the key to successful asset trading in the foreign exchange market. It is important to understand that

The Nuremberg tool presents a channel-like algorithm. The best arrow algorithms use channels without redrawing. Its settings indicate the parameters of the length and width of the channel. The indicator was created in such a way that you can fix the reaction to the channel breakout and display it in the form of an arrow. Arrow indicator Nuremberg on Forex indicates points of entry into transactions without redrawing. It generates fairly frequent and accurate signals.
When an upward arrow appe

Unchained is intended for scalping trading. It is used to trade on five and fifteen-minute timeframes. But it works on H1 and higher too. According to the traders themselves, the best arrow indicator is the one that does not redraw, i.e. does not imply changes in indicators.
When an upward arrow appears on the chart, the trader opens a buy order. If a downward arrow appears during trading, the buy order is closed. After analyzing the situation in this case, you can open a sell position. It is

Trading with the Uniq Trend indicator is as simple as possible, if a blue arrow pointing up appears on the chart, a buy trade is opened. In the same case, if you see a red arrow pointing in the downward direction, open a sell order.
That is, everything is as simple as possible, positions are closed in the opposite way, that is, as soon as a signal is received to open an order in the direction opposite to your position. For example, you opened a long position (for sale), close it when a red ar

Quatre is a trend indicator, it indicates well the points of the beginning of the trend and its completion or reversal. This indicator is characterized by the following behavior: After a trend movement appears on the market, the indicator sends a signal of its beginning in the form of arrows. Quatre is a mathematical averaging of prices, and based on this, one can assume the direction of price movement (trend) in the future. Against the background of insignificant fluctuations, it is possible t

Citizen Trend defines the mainstream of the market. Easy to set up and works on all pairs and all time frames. The Citizen Trend indicator provides an opportunity to classify the direction of price movement by determining its strength. It is easy to trade on it, watch how the line changes and act accordingly.
It is extremely important for any trader to correctly determine the direction and strength of the trend movement. Unfortunately, there is no single correct solution to this problem. Many

Visually, Capernaum, on the chart, appears as small arrows indicating the direction of the trend movement and the opening of trading positions. The appearance of a blue up arrow indicates that the market is beginning to rise and it is time to buy. And the appearance of a red down arrow means that the market is falling and it is high time to sell. When a suitable moment for buying appears, the indicator generates a signal exactly at the moment of its appearance and not below or above the current
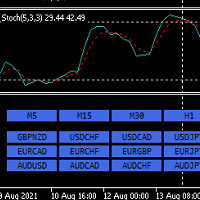
Hello,
This is an easy symbol change panel.
The free version only can change major pairs which are "AUDUSD, EURUSD, GBPUSD, USDCHF, USDCAD, USDJPY, NZDUSD"
The full version can add your symbols.
FULL version here:
https://www.mql5.com/en/market/product/71176?source=Site+Market+MT4+Indicator+New+Rating005
Also, can change the TimeFrame as well.
Symbols must be active on your Market Watch list.
Parameters:
ratio - change the size LineNumber - you can set that how many symbols
FREE

The advantage of working with the Gladiator signal indicator is that the trader does not need to conduct technical analysis of the chart on his own. The tool generates ready-made signals in the form of directional arrows. The indicator is considered effective as it does not redraw its signals. This tool is an arrow (signal) one and works without redrawing. Its signals are based on a robust algorithm.
Gladiator does not change its readings. Daily and session ranges can be useful for confirming

Signal Casablanca - Arrow technical indicator in the Forex market without redrawing. Able to give hints with minimal errors. It combines several filters, displaying market entry points with arrows on the chart. You can note the accuracy and clarity of the signals of this pointer indicator. Having seen a signal to buy, a trader opens an order without expecting that after a while the initial hint may change to the completely opposite one or simply disappear, having lost its relevance. The signal w
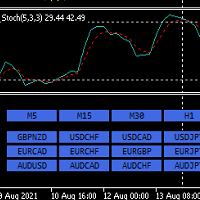
Hello,
This is an easy symbol change panel.
This is a full version of Symbol1 2Changer
Symbols must be active on your Market Watch list.
Parameters:
SymbolList - you can add more symbols with a comma(,) ratio - change the size LineNumber - you can set that how many symbols are displayed per line. button_width - modify the button size button_height - modify the button size
Thank you.

Signal Switched is a channel indicator designed to work with support and resistance levels and help traders find opportunities to enter the market. It is also protected by arrows that help to enter the market correctly.
Channel indicators are among the most popular technical analysis tools on Forex and Signal Switched is a promising market analysis tool. Signal Switched can be used as a base for building a strategy or as an addition to an existing one.
Signal Switched is a limited range (co

PSI tools delivers new special look aimed to bring Detailed Account Statement for all important statistics. The integrated MT4 is not accurate. It does not account correctly for Deposits, Withdrawals and completely ignores cases like hedged trades, break-even trades, other broker related credits, bonuses and so on events and as a result all statistics like draw-down, total trades, average win size, rate and so on are totally skewed. PSI corrects these mistakes. In the example below a demo accou

For anyone studying forex charts, the aim is to identify trends, and spot reversals. If you have years of experience it may be easy, but most of us need something to make the trend apparent. If you're familiar with the popular renko charting method, you know that it was developed for this purpose. But renko charting has a flaw; the trend is often broken by false reversals. So I developed my own version - the Kenko Trend Indicator. The kenko trend indicator draws renko style trend following blo

Gendel Gendut is Binary Option Indicator From @realTatino Trade with expaired time Pairs : All Forex Pair Time Frame : M5 only Trade Time All Time Alert : Alert Message, Alert Email, Alerts Push Buffer : 4 Buffer (0,2 (Buy) || 1,3 (Sell) Broker Suitable : All Broker Binary With Forex Pair Auto Trade : Yes Repaint : NO Delay : NO Other Binary Indicator : https://www.mql5.com/en/market/product/70915 https://www.mql5.com/en/market/product/71054
https://www.mql5.com/en/market/product/57755
etc I
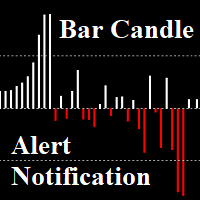
Bar Candle with Alert: Is Candlestick charts are arranged differently. The length of the candles, showing the strength of the trend When the length of the candle is short, advice is not to trade. We can put an alert on the indicator and then find an entry point You can set the value Alert, Notification. Set different values for each pair. And On OFF Alert on Terminal, Notification on Smartphone. Notifications - Client Terminal Settings - MetaTrader 4 Help
How to Setup MT4/MT5 Mobile A
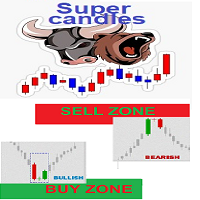
Simple indicator for possible BUY / Sell Zones based on smart volumes indicator two levels of buy/Sell Zones : Main BUY/SELL area and current BUY/SELL area and medium range BUY SELL Levels SELL Levels in Red BUY levels in Green Sell levels(RED) are transformed to buy levels (GREEN) when price is crosses above BUY levels(GREEN) are transformed to SELL levels (RED) when price is crossed Below
your strategy can vary : 1- you can Buy when price is above a green BUY area 2- you can Buy by approa
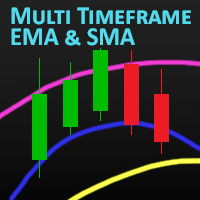
MT Moving Average
MT Moving Average is an easy to use multi time frame moving average indicator. It shows moving averages (SMA or EMA) of current symbol from all time frames (higher and lower). No need to switch between time frames anymore. With help of the indicator panel you can select which timeframe should be shown on the chart. I.e. your current timeframe is M5 and you can turn on M15 to see the the moving average of period M15. Indicator settings
Dark interface --> Set to true to use dar

Simple Indicator based on VWAP and Moving Average. Volume Weighted Average Price (VWAP) is a technical analysis tool used to measure the average price weighted by volume. VWAP is typically used with intraday charts as a way to determine the general direction of intraday prices. It's similar to a moving average in that when price is above VWAP, prices are rising and when price is below VWAP, prices are falling. VWAP is primarily used by technical analysts to identify market trend. Best for timefr

Auto Order Block with break of structure based on ICT and Smart Money Concepts (SMC)
Futures Break of Structure ( BoS )
Order block ( OB )
Higher time frame Order block / Point of Interest ( POI ) shown on current chart
Fair value Gap ( FVG ) / Imbalance - MTF ( Multi Time Frame )
HH/LL/HL/LH - MTF ( Multi Time Frame )
Choch MTF ( Multi Time Frame )
Volume Imbalance , MTF vIMB
Gap’s Power of 3
Equal High

Please contact me at telegram https://t.me/SmartForex777 SMART FOREX Indicator Read the complete data of Previous Day High/Low and Previous Day Open/Close Positions and gives you Advance Buy or Sell Order. The Indicator Starts Its Work 1 Hour After The Market Is Opened. Trading Rules
1st You Select Intra-Day wise Refresh option. So This Indicator gives you Day-Wise Advance Buy and Sell order, Now you know about trend of any pair. 1st Waiting For Up or Down Arrow- It's Zone. Zone is

The indicator based on (Williams` Percent Range) analyzes the signal line touches along the channel walls and forms zones for deciding on the direction of the price movement. For convenience, an alert function is built in. You can also enable and disable the desired zones. Several indicators with different settings can be used on one chart. This will help you choose the best strategy.
FREE
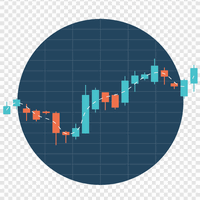
Some traders are guided by trading sessions during trading. Figure 1 shows the average price swing over one week. It can be seen that trading sessions on different days differ in their duration and activity. This indicator is designed to estimate the average price movement at certain intervals within a weekly cycle. It takes into account price movements up and down separately from each other and makes it possible to determine the moments when high volatility is possible in the market. On the ch
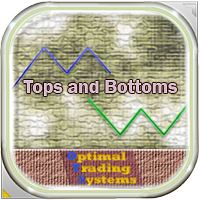
This indicator finds the "Double Bottom" and "Double Top" technical analysis patterns, shows them on the chart of the currency pair and can signal if the pattern was formed recently. These patterns are reversal, often after the emergence of the trend turns back or a correction occurs. In order not to search for them yourself, it is enough to add the indicator to the chart, after that, you can change different timeframes in order to quickly find such figures on one of the timeframes. There are so
FREE

+ 2 bonus strategies! Alerts! I recommend watching my advisor - Night Zen EA The indicator combines the most popular moving average strategies: Simple moving average crossover. Moving average crossover relative to the position of the slower moving average. 2 bonus strategies : The crossing of the fast moving average with the calculation of the opening prices of the slow moving average with the calculation of the closing prices taking into account the slower moving average. (The settings for th
FREE

The Trinity indicator will tell you whether you have configured the indicator correctly, while you can specify the history interval in the bars that interests you. Look at the numbers on the chart near the arrows! These are pips of profit from a series of entries on the indicator. Profit pips are calculated at the specified interval. The signal can be read without any problems by any bot. Trading within the volatility range has always attracted traders, because most often it is simple instrumen

Master Binary is Binary Indicator Highly Winrate No Repaint, No Delay Result look on https://t.me/BonosuProBinary Pair : All Forex Pairs Time Frame : M1 Expaired : 2 Minutes Trade Time Once Time a Day Backtester, Alert Avaliable Average Signals Generate 5 - 20 Signals All Pair A Day Broker Time Zone GMT+3 Default Setting [Example Broker GMT+3 : Alpari, ICMarkets] Support Broker : Deriv, IQOption, Alpari, Binomo Olymtrade, etc Support Auto Trading : MT2 Trading, Binary Bot, Intrade Bot, Binomo B
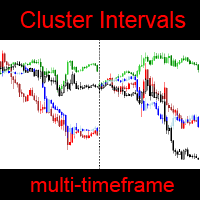
MT5 version — https://www.mql5.com/en/market/product/70988 With this indicator, you will be able to observe the relative price changes of other instruments on the current chart. Settings : refreshEveryTick — updates every tick. sym1 — The Name of the instrument. If empty or equal to "0", then it is ignored. numberOfIntervals — number of intervals. i ndicatorMode — display mode. Sets the value of each interval: by4h (4 hours), by6h (6 hours), etc. Mode byDeep - the interval is eq

Bonosu Toon is Binary Indicator Highly Winrate No Repaint, No Delay from BONOSU SYSTEM Result look on https://t.me/BonosuProBinary Pair : All Forex Pairs Time Frame : M1 Expaired : 1-2 Minutes Trade Time Once Time a Day Backtester, Alert Avaliable Average Signals Generate 5 - 20 Signals All Pair A Day Broker Time Zone GMT+3 Default Setting [Example Broker GMT+3 : Alpari, ICMarkets] Support Broker : Deriv, IQOption, Alpari, Binomo Olymtrade, etc Support Auto Trading : MT2 Trading, Binary Bot, I
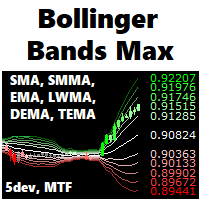
A fully featured BB indicator You're no longer limited to the built in default of using BB off a SMA method, now you can choose from SMA - EMA - SMMA - LWMA - DEMA - TEMA. You now also have up to 5 standard deviation levels, with price labels, and deviation-colored candles are provided.
Options: - MTF - moving average type SMA - EMA - SMMA - LWMA - DEMA - TEMA - 5 adjustable deviation levels
- color gradients to BB lines, candles, and texts - show-hide button to declutter the chart - full a
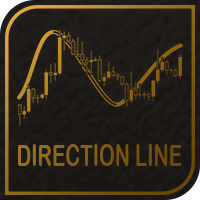
The Direction Line indicator shows you if the current market is in a up trend or uf ut's in a down trend. The sensitivity of the trend calculation ist customizable. You can adjust it till it fit's your strategy. Even as a beginner is this indicator easy to use and you'll see every trend.
Key Features of Direction Line Real-time trend calculations of all time frames Graphical Interface Identical calculation for all time frames Customizable trend sensivity No repainting
Settings / Inputs
Sen
FREE

The Relative Trend Index or RTI , is a technical indicator that is used to identify trend changes in the price of an asset, as well as the Strength of that trend. The RTI fluctuate between zero and 100, with values close to 100 indicating a strong sell and values near zero indicating a strong buy Indicator Parameters: RTI : the indicator is typically applied to 14 periods of data, so the indicator is showing how many periods it has been since a 14 period high or low Signal : Cross signal occur

Em uma negociação no Mercado Financeiro nada é mais importante que saber o momento certo de entrar em uma negociação. O AndInvest Impulse auxilia traders a capturar o momento exato de abrir uma negociação, para isto ele desenha topos e fundos facilitando a leitura do Price Action e após um breve momento de realização do mercado ele identifica o retorno da ponta compradora ou vendedora de força antecipada e sem repintura. Comprovação de Resultados: https://youtu.be/CA1_ZtZY0vk Funciona em qualque

Only work on Crude Oil H1 time frame Swing follow trend. do not trade against trends Specifies the first destination and entry and exit points For 16 years, I only traded on CrudeOil. Crude oil is one of the most extreme combinations in the world and it is safe to say that such a good indicator has never been made before. This indicator will save you a lot of money because it introduces a new type of approach, Good luck
COMPLETE VISUAL TRADING SYSTEM WITH THE BUY SELL SIGNALS - USING MULTI TIME FRAME TREND ANALYSIS
TREND STRENGTH POWER SIGNALS DASHBOARD.
TRADE INTRADAY, SHORT OR MEDIUM OR LONG TIME FRAME .
ALL THE SIGNALS WITH A MULTIPLE TIME FRAME TREND CONFLUENCE - INDICATES A STRONG MOVE AND CAN BE EASILY TRADED AS HIGH PROBABILITY TRADES.
COMPLE TRADING SYSTEM - WITH THE LOGICAL ENTRY , TARGETS AND STOP LOSS .
THE ALERTS ON THE DISPLAY SIDE OF THE ALERTS PANEL AREA , WILL INDICATE CLEARLY ALL T

A BB indicator with MA options
You're no longer limited to the built in default of using BB off a SMA method, now you can choose from SMA-EMA-SMMA-LWMA. You now also have up to 3 standard deviation levels, with price labels.
Options: - MTF - moving average type SMA-EMA-SMMA-LWMA - 3 adjustable deviation levels
- separate coloring to lines and texts
Troubleshooting: - If there are any issues or suggestions for the indicator, please comment and let me know. The feedback will be noted and c
FREE

Tick Speed Free povides a on-chart label of tick speed to allow you to see the ebb and flow of market activity. Observing rises and falls in tick speed may allow you to better time entries to reduce slippage and re-quotes.
Options include: - colores for low-mid-high tick speeds - placement and styling - prefix & suffix to customise the speed label
Troubleshooting: - Note, in the tester environment, tick timings are limited to what is supplied by the tester environment and it's speed
- If
FREE

Power Scalping Indicator is based on a very complex mathematical model that can capture market movements and identify the current start of a trend & finds the exact price to enter the market whether buy/sell with instant alerts. GIVE ME A GOOD RATING!
MARKET ORDERS Get Instant trades Buy/Sell with Entry, Target and Stop loss
ACCURATE ANALYSIS
MULTIPLE TIME FRAME Now supports Multi-Time frame analysis and trades
MARKET SESSION Know which trading session is going on on same dashboard windo

Entry Point to Trend Pro The indicator helps investors to identify the earliest and perfect reversal point. Easy to make decision to trade with the trend Price action trading. support resistance and market trends. By technical analysis, the robot creates a short-term strategy to determine the most optimal entry position. Optimal usage: 1. Wait for the trend reversal arrow to appear, we can enter an order to start a new trend. 2. The corresponding arrow in the bar that appears in the same directi

Simple to read and powerful, no fancy lines and drawings to clutter your chart or distract you. The trend probability oscillator estimates how likely a trend will continue in a certain period. The cummulator period controls how many bars in the past to use and is a proxy for the timescale the trend probability should hold. The use of a Max Line improves this further by indicating when a trend is likely to reverse. In most cases a trend must lose momentum before reversing. Hence, a trend probabil
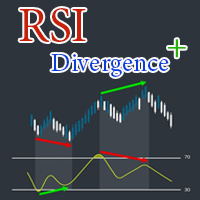
- RSI Divergence Plus is an RSI indicator which also detects divergences & Reversal candlestick pattern & Trend (Moving Average). - RSI Divergence Plus Send Arrows signal on the chart where you should buy and sell. Input parameters : - Rsi Period (Default 8) - True=Close/Open, False=High/Low (Default true) - Alerts (Default true) Return parameters: - 0 = Divergence Up Signal ---> iCustom(Symbol,TimeFrame,"RSI Divergence Plus",8,true,false,0,1) - 1 = Divergence Down Signal --->

Macd Four Color is an advanced Macd indicator that can filter Trend and Sideway. - It is an ideal tool for Long term trading and scalping - Filter trends and sideways with special techniques - Can be used for any time frame - Can be used on all currency pairs Color Signal : - Dark Green = Trend Up Strong - Light Green = Trend Up Weak - Red = Trend Down Strong - Orange = Trend Down Weak Return parameters: - 0 = Macd Main - 1 = Macd Signal - 2 = Tren

Reversal Patterns Pro
Reversal Patterns Pro is a Price Action (PA) analytical tool that scans the reversal patterns. - Finds and marks the most dependable Japanese candlestick patterns in real-time. - Supports all time frames (Best for Scalping) - Doesn't repaint making it an exceptional indicator for Expert Advisors. Input parameters :
- Support & Resistance Mode ( true or false ) for enabling advanced filtering - Donchian Period - RSI Period - RSI Oversold Level - RSI Overbought Level -

Tick Speed Pro povides a charted record of tick speed to allow you to see the ebb and flow of market activity. Observing patterns in tick speed may allow you to better time entries to reduce slippage and re-quotes.
The tick speed plot updates it's entire position to show you only the last N seconds you choose, ideal for scalping and HFT approaches. An alert is provided to signal when the instrument is getting ticks at a higher rate than the alert limit. Multiple loadings are supported to compar

IBB Candles is a tool that is based on the concept of Inverse Bollinger Bands. It compares price relative to state of the bands and plots candles with different colors defining the current state of the market i.e range | trend | strong trend. As the name suggests IBB(Inverse Bollinger Bands) is a technique which is completely different from the traditional Bollinger Bands and proves to be much more effective in analyzing market. This personal implementation makes this tool a more reliable option

Deal Trading SPT (Super Trend) is an indicator, shows the market trend direction, entry position, take profit level, stop loss level and trend strength.
Utility Help to further filter and develop strategy to trade Market overview on the chart Stop loss and take profit calculation with market volatility Resistance and support for trialing stop No repaint after the finished bar Works in any timeframe and financial instrument, including forex, CFD and crypto etc. Message pop-up, notification wi
The MetaTrader Market is a simple and convenient site where developers can sell their trading applications.
We will help you post your product and explain you how to prepare your product description for the Market. All applications on the Market are encryption-protected and can only be run on a buyer's computer. Illegal copying is impossible.
You are missing trading opportunities:
- Free trading apps
- Over 8,000 signals for copying
- Economic news for exploring financial markets
Registration
Log in
If you do not have an account, please register
Allow the use of cookies to log in to the MQL5.com website.
Please enable the necessary setting in your browser, otherwise you will not be able to log in.