Watch the Market tutorial videos on YouTube
How to buy а trading robot or an indicator
Run your EA on
virtual hosting
virtual hosting
Test аn indicator/trading robot before buying
Want to earn in the Market?
How to present a product for a sell-through
New Technical Indicators for MetaTrader 4 - 75

LIMITED TIME SALE - 30% OFF!
WAS $50 - NOW JUST $35! A symmetrical triangle chart pattern represents a period of contraction & consolidation before the price is forced to breakout to the upside or breakdown. A breakdown from the lower trendline marks the start of a new bearish trend, while a breakout from the upper trendline indicates the start of a new bullish trend. Get the dashboard to monitor all instruments and time frames you trade for symmetrical triangle patterns at once!
https:

The arithmetic mean or median can be used to determine the measure of the central trend of a time series. Both methods have some disadvantages. The arithmetic mean is calculated by the Simple Moving Average indicator. It is sensitive to emissions and noise. The median behaves more steadily, but there is a loss of information at the boundaries of the interval. In order to reduce these disadvantages, pseudo-median signal filtering can be used. To do this, take the median of a small length and rec
Globex 360 Scalping is a unique scalping indicator that shows price reversal points. With the help of this indicator, you will see on the chart when the price is reversing, and at this moment you can open deals in the direction of the signal. This is an indispensable assistant for both novice traders and professionals. This indicator shows the trader important and valuable information for effective trading. Globex 360 Scalping - Applies smooth scanning technology for market analysis. The indica

Description
Trend Influencer is an indicator that determines the potential dynamics of the influence of trend wave movements on the market. The indicator is based on the value of moving averages corrected by the standard deviation. The indicator is displayed as a main dash-dotted moving average and a signal solid moving average. The signal moving average is colored blue or red depending on what type of trend is currently observed in the market. The indicator also draws inhibition levels - blue a

Use the indicator only in retest zones The newly formed zone should be used for scalping only New zones are repainted or recalculated When supports and resistances are violated, they are deleted as they no longer function. Recommended on M30 and higher timeframes You will see the trading zones and identify the most profitable points to open positions. The indicator marks the supply and demand zones. With this show you will now make profitable trades that will set the trends. Shows all support a
FREE

The volume weighted average price (VWAP) is a trading benchmark used by traders that gives the average price a security has traded at throughout the day, based on both volume and price. VWAP is calculated by adding up the dollars traded for every transaction (price multiplied by the number of shares traded) and then dividing by the total shares traded. You can see more of my publications here: https://www.mql5.com/en/users/joaquinmetayer/seller
FREE

Nermal Round Levels is an indicator of round numbers in the form of a grid drawing horizontal lines. You can use it in many ways ... as it could be activating for an expert advisor to enter the market, confirmation of entry for your strategy, entrance area, mark areas of important levels, possible rebounds and others. Place it in your chart and verify as the price respects those round levels.
Inputs GridSpace linecolor lineStyle
FREE

LordChannel is an indicator for META TRADER 4 for all forex pairs and financial market metals.
The indicator is used to make detections of high/low channels, implementing a technical analysis on possible breakouts and making correct order entries.
LordChannel sends signals such as buy and sell in the graphical analysis, it is important to emphasize that the importance of these signals are safe in TIME FRAMES M30, H1, H4.
The indicator was created for using bullish/downtrend channels to compl

The Stochastic RSI indicator (StochRSI) is essentially an indicator of an indicator. It is used in technical analysis to provide a stochastic calculation to the RSI indicator. This means that it is a measure of RSI relative to its own high/low range over a user defined period of time. The Stochastic RSI is an oscillator that calculates a value between 0 and 1 which is then plotted as a line. This indicator is primarily used for identifying overbought and oversold conditions.
FREE

Arlene Sessions Background is an indicator that draws colored vertical background on the chart depending on your session. You can see the version 1 here: https://www.mql5.com/en/market/product/68822 You can see more of my publications here: https://www.mql5.com/en/users/joaquinmetayer/seller If you only want to paint a session on your chart, you must set the color "none" to deactivate it.
FREE

Arlene Sessions Background is an indicator that draws colored rectangles on the chart depending on your session, within the price range that has moved and when the sessions overlap, it will be painted in a color that will be the mixture of the colors of the respective sessions. You can see the version 2 here: https://www.mql5.com/en/market/product/68934
Inputs NumberOfDays AsiaBegin AsiaEnd AsiaColor EurBegin EurEnd EurColor USABegin USAEnd USAColor
If you only want to paint a session on your
FREE

Привет! Предлагаю тебе индикатор который не требует больших знаний и умений. Нужно просто им пользоваться как удобным инструментом.
Индикатор создавался как механизм позволяющий взять максимум от тренда и с этой задачей он прекрасно справляется. Для работы с индикатором подойдут все подвижные инструменты EUR/JPY золото фунты. Таймфрейм можно выбрать любой, но лучший результат индикатор показывает на маленьких, от 5 минут до часового.

Идея индикатора очень проста и скорее всего пригодится тем, кто используют линейный график для технического анализа. Что-бы устранить "неровности" (-: линейного графика и был написан этот индикатор. Линия графика соединяет цены закрытия свечей, как и в классическом линейном графике, но игнорирует цены, которые шли в направлении линии и новый экстремум возникает только тогда, когда цена закрытия последней свечи явно ниже или выше предыдущего значения. Это облегчает визуальное восприятие при поиск
FREE

In this indicator, Heiken Ashi candles are calculated with the most optimal method. You can also customize the results by adjusting the amount of period and method input. But the most important advantage of this indicator is the adjustment of the time frame value. You can use this to calculate the Heiken Ashi chandels to See in time frames with lottery in the lower time chart. In this case, you get the best signal to buy or sell using two or more Heiken Ashi indicators with different timeframes

This indicator is profitable on 28/28 forex pairs on H1 timeframe WITHOUT SPREAD. You need to substract the spread to the profit amounts shown The code is robust with a high chance to continue being profitable no matter how the price action evolves. But profitable on 28 pairs doesn't mean you should trade all the pairs all the time: On less popular ones, liquidity is low, so spread will usually be high and will eat all the profits. You have to be careful and trade only when the spread is low
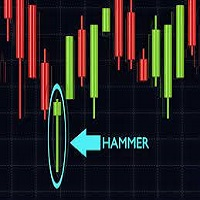
Japanese candlesticks can be used for any time frame, whether it be one day, one hour, 30-minutes ….whatever you want! They are used to describe the price action during the given time frame. Japanese candlesticks are formed using the open, high, low, and close of the chosen time period. CandleStick Scanner X provides market analysis through the detection and analysis of Japanese candlestick patterns. Candlestick based market analysis is one of the most popular technical analysis methods. Combina

CityScape summarizes prices into an easy to read pattern that oscillates between 0 and 1. Repetition of CityScape pattern may indicate that the price pattern will also be repeated. CityScape pattern can be used as a quick reference to predict what the price may do by looking for a similar CityScape Pattern in the recent past. Cross currency pairs and cross timescale pattern comparisons may also provide insight into what the price will do.
Inputs Local Max period: Controls the width of the CityS
Anchor Line is a fast acting trendline indicator using proprietary algorithm to identify possible reversals. Tunable sensitivity and smoothing period helps to filter out small fluctuations
Buffers Buffer0: Moving Average Buffer (not displayed) Buffer1:Anchor Line Uptrend Buffer (Blue) Buffer2: Anchor Line Downtrend Buffer (Red) Buffer3:Reversal Buffer 1=Uptrend, -1=Downtrend (not displayed) Buffer4: Anchor Line Up and Down trends combined (Gray) *NEW*
Inputs Smooth Period: Period for Moving

This is MetaTrader 4 Professional Auto Pivot Indicator that you can use for any currency pairs. It's very professional strategy and it has higher accuracy if you know how to use it. It is built with mql4 language.
Features: It will change Pivot types according to your Timeframe. It has good accuracy to find out signals Daily Pivot is for H1 Timeframe. It has Daily Pivot with 3 Daily Support Resistance Level. It has Weekly Pivot with 3 Weekly Support Resistance Level. It has Monthly Pivot with 3

MA Cross indicator by 4Umbella
Create for traders both experienced and inexperienced to use it because it is a basic indicator
How to use : 1. MA Fast : Moving Average fast (Period 4 upto 50) 2. MA Middle : Moving Average Middle (Period 10 upto 100) 3. MA Slow : Moving Average Slow (Period 50 upto 200) to control trend markets.
and trader can be set for Apply to price (Close, Open,Low,High,Median,Typical,weightd)
For alert you can set to alert Next bar or instant bars.
The work is very
Mastery CDS is a trend indicator based on the BB Mastery Technical Analysis. This Mastery CDS indicator is specially designed for the practitioner of BB Mastery Technical Analysis. This indicator helps you to setup BB Mastery Indicators and label all the CDS signals. The CDS signals including TRZ, CT, and CC. What is so special with this indicator? This indicator able to label TRZ, CT and CC signal all all time frames. You can one glance all the signals without spending time to identify each of
FREE

Volume Profile Indicator / Market Profile Indicator What this is not : FMP is not the classic letter-coded TPO display , does not display the overall chart data profile calculation , and , it does not segment the chart into periods and calculate them. What it does : Most importantly ,the FMP indicator will process data that resides between the left edge of the user defined spectrum and the right edge of the user defined spectrum. User can define the spectrum by just pulling each end of the indi
FREE

The trend allows you to predict the price movement and determine the main directions of the conclusion of transactions. The construction of trend lines is possible using various methods suitable for the trader's trading style. This indicator calculates the parameters of the trend movement based on the von Mises distribution. Using this distribution makes it possible to obtain stable values of the trend equation. In addition to calculating the trend, the levels of possible deviations up and do

The indicator identifies when a divergence occurs between price and an indicator or oscillator. It identifies bullish and bearish hidden or regular (classical) divergences. Combined with your own rules and techniques, this indicator will allow you to create (or enhance) your own powerful system. Features
Can detect divergences for the following indicators/oscillators: MACD, OsMA (Moving average of Oscillator), Stochastics, RSI, CCI, RVI, Awesome (AO), ADX, ATR, OBV, MFI, Momentum and Composit
FREE
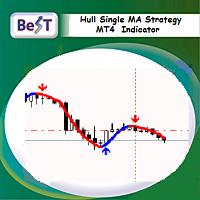
BeST_Hull Single MA Strategy is an Metatrader Indicator based on the famous indicator Hull Mov.Average . This indicator can display the Single HMA Strategy of just 1 Hull MAvg. It uses added internal filters locating the most likely Entries while it can be used as a standalone system or as an add-on to other ones.
Generally the Hull Moving Average (HMA - developed by Alan Hull) is a directional trend indicator . It captures the current state of the market and uses recent price action to determin
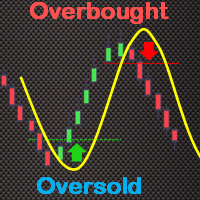
The True Oversold Overbought indicator provides you with ability to swiftly check whether the asset is oversold or overbought. Other than complementing your trading with True Oversold Overbought, you can use the indicator as your only trading system. It works with all forex instruments and will save you the headache of estimating when the market is due for a reversal or retracement. When the "Super Charge" feature is enabled, the areas where the price is in oversold/overbought status are ampl

RoboS Indicator Version 1.5 The RoboS Indicator is a trading tool designed to enhance your market analysis. With advanced features such as Buy and Sell signals, it simplifies decision-making for traders across all experience levels. This indicator is compatible with all symbols and timeframes, making it a versatile addition to any trading strategy.
Features Signal Arrows: Clearly identify Buy and Sell opportunities with optional arrows. Customizable Alerts: Receive notifications on your mobile
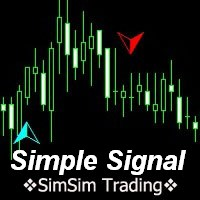
MT4 trend indicator works without redrawing. Provides signals for entering trades, works on charts of any instrument. Трендовый индикатор МТ4, работает без перерисовки. Выдает сигналы для входа в сделки, работает на графиках любого инструмента. Input parameters are for styling and messages only. / Входные параметры только для оформления и сообщений. All original signal calculations do not need additional parameters. / Все оригинальные расчеты сигнала, не нуждаются в дополнительных параметрах.
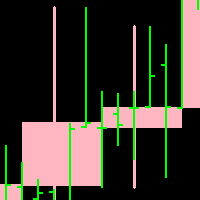
Candleline: candleline indicator. According to the specified period, draw the candle line of the specified period on the current chart. In addition, the new candlelight line is superimposed with the candlelight line of the current chart.
Note: the period of the current chart must be less than the period of the candle line to be drawn.
For the specific effect of self drawing candle line, please see the attached picture below. Parameter: 1.TimeFrame; 2. NumberOfBar; 3.Up candle li
FREE
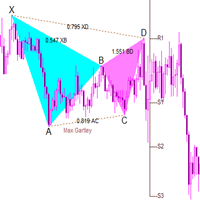
The full purchase discount is currently in progress! The best partner for any trader! This indicator is a classic butterfly indicator (harmonic trading). By default, it can identify 20 patterns and give prompts. You can also add custom shape parameters for custom prompts , prompting appropriate stop loss and profit levels. The built-in algorithm of this indicator is unique and is a unique band algorithm. Index characteristics Gartley pattern, also known as Gartley "222", was

Sends price alerts conveniently to your Android/IOS device. Make sure push notifications are enabled in Metatrader settings and the PC/VPS is online 24/7. Price levels are updated automatically, but you can modify them in global variables, if needed. Suitable for any market instrument, but if notifications are too frequent, increase point value of the indicator parameter.
FREE

Indicator values are in the range 0-100.
The greater is the indicator value, the greater is the market stability,
so the more likely we have trend.
The smaller is the indicator value - the less probable the trend is.
Tips:
Trading on unstable market:
Buy, when moving average (blue line) of the CMI indicator is below 40 and the histogram is red.
Sell when moving average (blue line) of the CMI indicator is below 40 and the histogram is green.
Close positions when CMI histogram is
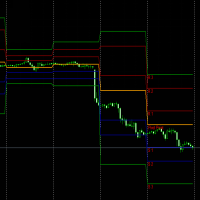
Instructions:
1. Pivot has an attractive effect. In the absence of large longs or shorts entering the market, the price moves around the axis between r1 and s1, but the movement may be irregular. Someone specializes in trading in this range, called floor trader.
2. Under the strong push of longs or shorts, the price will break through the s1-r1 area, and there will be a trend at this time, but it is still within the normal price movement range. Within this range, there will be a strong sense

Hypershot is a channel indicator that has the ability to do a commodity channel index. It is designed for short-term trading. This indicator can activate with the range of -150 and 150 in terms of value. The solid width for the histogram is 2. After backtesting it with currency pairs EURUSD, GBPUSD, USDCHF, and USDJPY, the histogram shows blue when the candlesticks go up and purple when they go down. Please invest at your own risk as this indicator does not promise any satisfactory results. With

Track Trend Triumph is a moving average indicator that allows you see candlesticks in multiple colors. It lets you see a trend in both short term and long term trading. Focus is the input of the indicator with the value of 5 and Focus 2 is the other input with 40 as it's value. This indicator is for anyone who enjoys moving average movement. It is set for current but can be use for all timeframes. When I backtested the product with currency pairs USDCAD, AUDUSD, GBPUSD,and EURUSD, it shows a div

Support and Resistance Levels Arrow Indicator please leave 5 stars to me A support level is a level where the price tends to find support as it falls. This means that the price is more likely to "bounce" off this level rather than break through it. However, once the price has breached this level, by an amount exceeding some noise, it is likely to continue falling until meeting another support level. A resistance level is the opposite of a support level. It is where the price tends to find re

Double Smoothed Price Momentum Oscillator
The Momentum Oscillator measures the amount that a security’s price has changed over a given period of time. The Momentum Oscillator is the current price divided by the price of a previous period, and the quotient is multiplied by 100. The result is an indicator that oscillates around 100. Values less than 100 indicate negative momentum, or decreasing price, and vice versa. Double Smoothed Price Momentum Oscillator examines the price changes in the deter

FUNDING DEVIL INDICATOR has been developed by traders for traders and is not another combination out of existing indicators or a "magic, solve all situations" tool.
PASS THE FUNDED ACCOUNTS WITH IT.
It is the answer for beginners and experienced traders about the misleading concepts of the mainstream, causing 90% of retail traders, never making a living out of trading.
Successful traders are "following the smart money" and do NOT try to catch every move from start to end. Consistent traders
FREE

MACD ColorBars paints bar frames according to a trend, as well as changes the histogram color when MACD bars are rising or falling (if Color Bars is enabled in the inputs window). The growth of bars indicates a divergence between the fast and slow moving averages, while the decrease indicates their convergence.
Parameters
Fast Moving Average - period of the fast moving average; Slow Moving Average - period of the slow moving average; MA method - moving average smoothing method (simpl
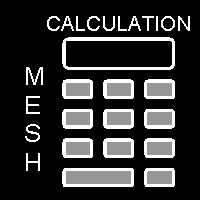
Graphing calculator for quick calculation of order grids or averaging strategies. This is an improved English version of the "Grid calculator" program, which shows order volumes by level (lot), martingale ratio (MG), grid step (step), drawdown of each order and the entire grid, breakeven level (Line Breakeven). For the program to perform calculations, it is enough to pull the grid onto the chart by dragging the initial (Level 1) or control (Control line) levels with the mouse. The default param
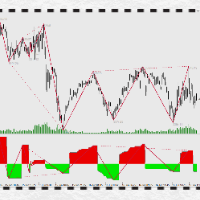
Introduction to PowerTrapezoid:
The application of market Power deviation system is not a secret, such as volume price deviation, MACD deviation, Chanlun deviation and so on. However, how to correctly understand and calculate, and accurately judge the increase or decrease of POWER is a threshold in application, which is difficult to cross with the conventional system. How to avoid reciting? How to implement multi level backflow parallel computing? How to intuitively show the range of backtrack
FREE

Smart Multi Systems
21 STRATEGIES IN 1
INPUT
FileComment = "";- trade log file EntryOnly = false;- "TRUE"- SIGNAL TO SIGNAL MODE Can Exit by Opposite Signal = false; IndicatorAlerts = false;- EntryAlerts = true; ExitAlerts = true; Reentry=false( ENABLE reentries) ENTRY SETTING PARAMETERS EntryStyle = EP-SIG+Rev Alert ( 21strategies ) ExitStyle = Rev Alert ( 8 EXITS strategies )
ENTRY and EXIT SETTINGS ===== KPeriod = 100; DPeriod = 12; Slowing = 3; method = 0; price = 0; äëÿ

What Is Market Imbalance? Market Imbalance, also known as "IPA" or Improper Price Action, is when price moves so quick in one direction with no orders on the other side of the market to mitigate the price movement. We all know Big Banks, or "Smart Money", can move the market by placing huge orders which in turn can move price significantly. They can do this because Big Banks are the top 10 Forex traders in the world . But unfortunately, the Big Banks cannot leave these orders in drawdown and mus

Indicator from the Real Non RePaint MultiTimeFrame (Real NRP MTF) series. Specially designed to display the RSI standard indicator reading from the Senior TimeFrame (TF) to the Junior. The indicator differs from the standard scale - symmetrical relative to 0. Add 50.0 to the readings to get the standard values. Does not look into the future for history at the senior TF. DOES NOT DIFFER from the standard real-time indicator readings (including bias), but shows the actual indicator readings on th

Hello!
Tired of constantly subscribing to other people's signals and earning pennies?
Want to manage your own trading?
Then you are on the right page!
It's very simple ==> buy my indicator ==> put it on the chart ==> blue arrow - buy ==> red arrow - sell. Even an infant can do it!
A handy histogram to trace the market direction.
Are you still here? Then read the parameter descriptions and take a look at the screenshots: Stoch K period - period for calculating the% K oscillator line. Stoch

Indicator from the Real Non RePaint MultiTimeFrame (Real NRP MTF) series. The indicator is based on the standard one. Does not redraw in any mode: the last closed candle is a rock. Does not look into the future for history at the senior TF. The formula for sensitivity enhancement has been changed (disabled in settings). It works on the current TF or older ones with the display on the current one. The last closed Heiken Ashi candle of the current timeframe before the opening of the new senior

Indicator from the Real Non RePaint MultiTimeFrame (Real NRP MTF) series.
Specially designed to display the standard Stohastic indicator from the senior timeframe (TF) to the junior. The indicator differs from the standard scale - symmetrical relative to 0. Add 50.0 to the readings to get the standard values.
Does not look into the future for history at the senior TF. DOES NOT DIFFER from the real-time standard indicator (offset-based), but shows the actual indicator counts on the history f

Currency Weight FX ( CW8) You are going to see the Forex Treasure If you think in Forex Trading you are dealing with one chart only, then you are on your way to be plunged into misery. The weight of one's currency will affect other currency or currencies. This Currency Weight FX is a breakthrough in trading tools
With Currency Weight FX ( CW8 ) indicator you will see each weight of major currency. This currency WEIGHT is very much different from currency STRENGTH most people usually mean.
CW
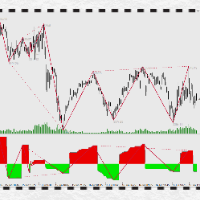
万能背驰指标简介(DivergenceLines) 注意注意,这个指标不能单独运作,对以下两个指标有依赖,请确保先获得以下两个指标后才购买本指标! 1) 动力之梯(PowerTrapezoid) (力度评估副图指标,本指标) 2) 万能分段(LinesSegment) (线段划分主图指标) 。 3)万能背驰(DivergenceLines,本指标) (比较力度背离主图指标)。 指标原理: 通过获取动力之梯指标的筹码堆积值,依照万能分段指标为依据,对同向线段向前回朔,进行一一对比,当后面线段力度比前面力度小时,定义为背驰(背离),背驰的两个高点(或两个低点)之间可以连接一条背驰线,当某个高点(或低点)连接的背驰线越多,这个点就构成了多个单级别背驰区间套。
FREE

Tom DeMark developed TD Sequential by hand, through a process of trial and error, in the 1970s. It never ceases to amaze me how something originally created to analyze daily price data can be applied so effectively, more than thirty years later, to any time frame—from one minute to one year—and to any market. The indicator has two components: TD Setup, which relies on momentum to define price ranges, and TD Countdown, which is trend based, and looks for low-risk opportunities to fade establishe
Scalper Signals Trader
Best and simple Indicator for clear and safe entry and exits. Predefines- multiple targets and stop loss, as per risk reward ratios Signals can be set – based on aggressive or safe algorithm Aggressive entries are also profitable but are raw signals without checking the higher time frame trends Safe entry meanwhile will check if the lower and the higher time frame are both in same direction, thereby having lesser trade entries and more quality. The very robust macd leve

万能线段划分指标简介: 万能线段划分是依照两根相互缠绕的均线,依金死叉为标准,将金死叉两边的高低点进行连接开成线段划分。本指标可以设定不同参数多级别叠加使用。 万能分段的原理: 在任意一组均线组成的均线系统中,均线之间的相互缠绕,形成的金死叉是有位次关系的。这点,作者在这里算是首次对外公开这个秘密。上图的均线系统中,走势处于一个较大级别的振荡行情中,均线之间相互缠绕比较频繁,金死叉的数量较多,所以,情况比较复杂。 我们知道,均线可按其周期大小进行位次排序。上图均线依照周期从小到大排序为:MA10,MA30,MA60,MA144,MA233,依照这组均线的位次关系,将每相邻两根均线金死叉做上标注。如:MA10&MA30金死叉标注为“1”,MA30&MA60金死叉标注为“2”,MA60&MA144金死叉标注为“3”,MA144&MA233金死叉标注为“4”。我们将两相邻均线金死叉完全标注完毕后,发现图上还有部份金死叉并未被标注到,这些未被标注到的金死叉全部是非相邻均线之间发生的金死叉。我们依照以上方法,可以识别出均线组之间金死叉的级别位次关系。市场行情的发展是依照此级别位次关系,从小到大
FREE

This incredible indicator allows you to overlay many moving averages to create a ribbon-like pattern. You can now easily visualize trend strength and determine pivot points by simply looking at the ribbon. Fully customizable Supports Simple , Exponential , Smoothed , and Linear Weighted moving average types Ability to use typical and median and weighted prices as input. Draw up to 32 (user-settable) moving average plots, with customizable period spacing (use length and start settings) Enable or

Woodies CCI is a momentum indicator that was developed by Ken Woods. It's based on a 14 period Commodity Channel Index (CCI) . It's a fully unbounded oscillator with a base value of 0 and has no lower or upper limit. Some traders use the indicator to spot a number of tradable CCI patterns both with and against the trend, such as the zero line reject, the reverse divergence and the trendline break. The 200 level signals an extreme reading. The indicator is often used in combination with other sig
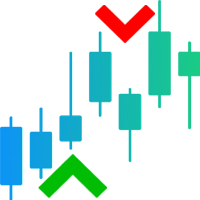
The Price Action Alert Indicator MT4 is a custom indicator made for the traders which help the traders to distinguish the price ticks that make the market price action understood. This indicator utilizes bearish or bullish signs at its cost rates. This Price Action Strategy gives open doors for different examples in elements that are undetectable to the unaided eye. This indicator is exceptionally intended for Meta trader 4 .
You can undoubtedly make benefits by understanding this indicator
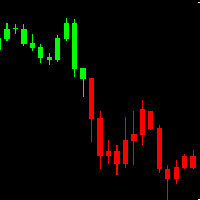
AH Candles MT4 AH Candles MT4 is a new product that allows identifying the current market phase (uptrend and downtrend ).
This indicator paints bars in different colors depending on the current state of the market trend ( Green and Red )
AH Candles MT4 is use for trading currencies
Advantages Suitable for intraday and swing trading. The indicator base on EMA method to calculate Period Parameters It can be used as a standalone tool or together with other indicators.
How to use the prod
FREE
This indicator: 1. Does not provide any signal for trading. 2. Shows chart symbol and timeframe more visible. 3. Shows spread in digit format. 4. Shows the value of each point of current symbol per one lot. 5. Changes the symbol of current chart by one click. 6. It is useful for someone who wants to analyze different symbols on one chart. by clicking on the desired symbol name at left side, indicator draws it fast.

By using of this indicator, you can easily set two alerts for each timeframe of each instrument. This is how it works: 1. Add the indicator to the chart. 2. Click on "New Alert" button. 3. Drag the drawn rectangle to your desired price. 4. Then click on "Add" button to active the alert. You can do the same for the second alert. Please: Keep in mind that for each rectangle only the side of the rectangle that is close to the price is important. For a different instrument, drag it from the market
Hi guys, In order to trade safely at Forex; all you need is the "pro intraday trading" indicator.
December indicator detects "Safe Buy/Sell" points by analyzing the "lowest and highest value of the day" of this instrument at the time intervals you have set and instantly gives you the "target Channel december" on the live chart. It offers Buy 1 - Buy 2 channels (2 blue line Purchase Zones) as secure Purchase points.) It offers a Sell 1 -Sell 2 channels (2 pink line Sales Zones) as secure outlet

MACD Intraday Trend is an Indicator developed through an adaptation made of the original MACD created by Gerald Appel in the 1960s. Through years of trading it was observed that by changing the parameters of the MACD with Fibonacci proportions we achieve a better presentation of the continuity of the trend movements, making that it is possible to more efficiently detect the beginning and end of a price trend. Due to its efficiency in detecting price trends, it is also possible to identify very c
FREE

Pivot Point Fibo RSJ is an indicator that traces the support and resistance lines of the day using Fibonacci rates. This spectacular indicator creates up to 7 levels of support and resistance through Pivot Point using Fibonacci rates.
It is fantastic how the prices respect each level of this support and resistance, where it is possible to perceive possible entry/exit points of an operation.
Features
Up to 7 levels of support and 7 levels of resistance Set the colors of the levels individually
FREE

Pivot levels are a well established technical level that's recognised in every market. This indicator will draw the current Quarterly, Monthly, Weekly, Daily and four-hourly pivots on the chart, for any symbol. You can also show the Suppport and Resistance levels for each period and choose which to display from levels 1 to 4. Choose the type of Pivot from: Standard Camarilla DeMark Woodie Fibonacci Please note, DeMark pivots have a single Support and Resistance level as per the original speci

MACD Intraday Trend PRO is an Indicator developed through an adaptation made of the original MACD created by Gerald Appel in the 1960s. Through years of trading it was observed that by changing the parameters of the MACD with Fibonacci proportions we achieve a better presentation of the continuity of the trend movements, making that it is possible to more efficiently detect the beginning and end of a price trend. Due to its efficiency in detecting price trends, it is also possible to identify ve
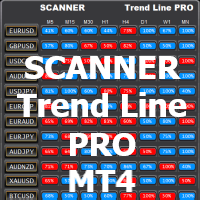
Works with Trend Line PRO indicator and set files made by Optimizer Utility You can download additional programs: here The scanner is developed to get new signals of the Trend Line PRO indicator on all pairs and timeframes from M5 to MN1
For the scanner to work, you should have an indicator. The main advantage of SCANNER Trend Line PRO is the possibility to use an individual set file for each pair and timeframe.
You can automatically set up, change and save settings for each pair in the
FREE

The indicator detects the direction of the trend and colours the candles on the chart accordingly.
Allows you to enter the trade at the beginning of the movement
The easiest way to set up the indicator
Can be used on any currency pairs, metals and cryptocurrencies, as well as when working with binary options
Distinctive features Shows the trend direction Does not re-draw Easy and accurate adjustment; Works on all timeframes and all symbols; Suitable for trading currencies, metals, options a
FREE
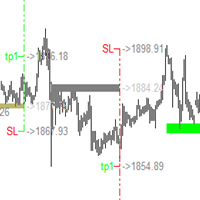
This indicator has a unique support and resistance calculation program, which is a unique trading system. Index characteristics Imagine if you can accurately determine the important trading support and resistance areas and points in advance, how will your trading improve? Based on a unique calculation method, the indicator analyzes the trend, analyzes the current support and resistance, and obtains the current important support resistance and single direction, the calculated stop profit and sto
Price Action Indicator gives you reverse or even continous trend signals depending on your timeframe and Strategy used. !!!This is not a holy grail indicator and it will not give 100% winning rate!!! As you can see, it is not giving a lot of signals because of the price movements in side way (flat) trend. You can use it on every major currency pairs and even on indices. Please be aware of using this indicator with other strategies and indicators. Use MM and Risk Management properly. Sometimes
FREE
An indicator for receiving a lot of signals Can be used in all time frames and all markets Trade professionally using professional indicators yourself . Using this indicator, you will have a signal at any time. Do not miss any market movement. Get the signal very simply and clearly.
----------------------------------------------------------------------------------------------------------------------------------------------------------------------------------------------------
How it work:
Th

This simple indicator paints with a darker color on the volume bar when the quantity traded is above the average of select number of periods of the volume itself, highlighting the moments when there was a large volume of deals above the average. It is also possible to use a configuration of four colors where the color tone shows a candle volume strength. The indicator defaults to the simple average of 20 periods, but it is possible to change to other types of averages and periods. If you like t
FREE

This indicator uses support and resistance, volume and some special formula to calculate the volume to filter the candles. If the volume reaches a specific value, And at the same time, Candle breaks the support/resistance line, There would be a signal and we can enter the market. Signals appear when the current candle closes. then you can enter the trade when a new candle appears. Please don't forget to follow your money management plan.
MT5 Version
Support/Resistance Breakout MT5 : https://
The MetaTrader Market is the best place to sell trading robots and technical indicators.
You only need to develop an application for the MetaTrader platform with an attractive design and a good description. We will explain you how to publish your product on the Market to offer it to millions of MetaTrader users.
You are missing trading opportunities:
- Free trading apps
- Over 8,000 signals for copying
- Economic news for exploring financial markets
Registration
Log in
If you do not have an account, please register
Allow the use of cookies to log in to the MQL5.com website.
Please enable the necessary setting in your browser, otherwise you will not be able to log in.