Watch the Market tutorial videos on YouTube
How to buy а trading robot or an indicator
Run your EA on
virtual hosting
virtual hosting
Test аn indicator/trading robot before buying
Want to earn in the Market?
How to present a product for a sell-through
New Technical Indicators for MetaTrader 4

iMRPHN: Supertrend & Swing Reversal Indicator A trading indicator that integrates Supertrend zone detection with swing-based entry logic. Designed for traders who apply both trend-following and counter-trend approaches. The indicator works across multiple timeframes and offers several helpful visual and alert-based features. Key Features: Automatic identification of swing high and swing low levels Automatic Fibonacci retracement Supertrend reversal zone visualization in real-time Highlights are

Happy Scalping Indicator Watch the live trading: https://youtu.be/QR5F_9uIb6k Join the Happy Scalping channel: https://www.mql5.com/en/channels/forexnewadvisor
This indicator was designed for aggressive scalping and quick entries in binary options , generating signals on every candle , so you can know exactly what’s happening at all times.
No repainting : the signal of the current candle is generated in REAL TIME , which means it may change while the candle is still forming, dependi

The Multi Timeframe Candles indicator is a powerful visualization tool designed to help traders align their lower timeframe analysis with higher timeframe structure. By plotting candles from a selected higher timeframe (H1, H4, D1, etc.) directly on your current chart, this indicator gives you a clearer perspective of the overall market narrative without switching charts.
Who Needs This Indicator? This tool is ideal for: Smart Money Concept (SMC) / ICT Traders who rely on higher timeframe
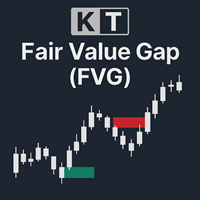
KT Fair Value Gap (FVG) identifies and highlights zones of temporary price imbalance in the market. These gaps often act as potential areas for price continuation—or in some cases, reversals (also known as inverse FVGs). Bullish FVG: Displayed as green boxes, these gaps act as support zones where price may resume its upward movement. Once filled, they can also become potential turning points for a reversal. Bearish FVG: Shown as red boxes, these gaps serve as resistance zones where price may con
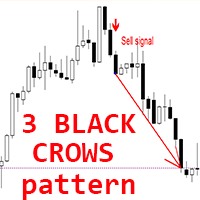
Crypto_Forex Indicator " 3 Black Crows pattern" for MT4. Indicator "3 Black Crows pattern" is very powerful for Price Action trading: No repaint, No delay. Indicator detects bearish "3 Black Crows" patterns on chart: Red arrow signal on chart (see pictures). With P C, Mobile & Email alerts. Also its brother - bullish "3 White Soldiers pattern" indicator is available (follow the link below).
Indicator "3 Black Crows pattern" is excellent to combine with Support/Resista
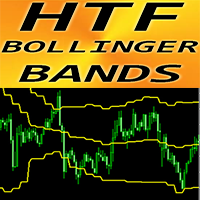
Crypto_Forex Indicator "HTF Bollinger Bands" for MT4. Upgrade your trading methods with the professional indicator "HTF Bollinger Bands" for MT4. H TF means - H igher Time Frame. Bollinger Bands is one of the best indicators on the market - perfect tool for trading. Approximately 90% of price action occurs between the two bands. HTF Bollinger Bands indicator is excellent for Multi-Time Frame trading systems with Price Action entries or in combination with other indicators. This ind
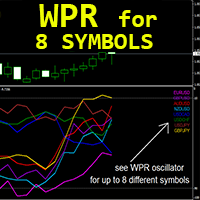
Forex Indicator "WPR for 8 Symbols" for MT4, No repaint. WPR itself is one of the best oscillators for scalping. It is great to take Sell entries from strong OverBought zone (above -10) and Buy entries from strong OverSold zone (below -90). "WPR for 8 Symbols" gives opportunity to control WPR values of up to 8 different symbols just on 1 chart.
This indicator is excellent to combine with Price Action entries from OverSold/OverBought areas as well. // Great Trading Robots and In
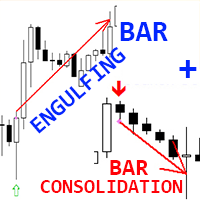
Crypto_Forex Indicator " Engulfing Bar and Consolidation Bar" patterns for MT4. "Engulfing Bar and Consolidation Bar" patterns is very powerful for Price Action trading. Indicator detects Engulfing Bars and Consolidation Bars on chart: Bullish Engulfing Bar pattern - Green arrow signal on chart. Bearish Engulfing Bar pattern - Orange arrow signal on chart. Bullish Consolidation Bar pattern - Blue arrow signal on chart. Bearish Consolidation Bar pattern - Red arrow signal on chart.
No

FullScalping is a non-repainting and no backpainting indicator, specifically designed to generate CONSTANT scalping entries across any market. Perfect for aggressive traders who want nonstop action!
Check the Indicators channel for new information and updates: CLICK HERE You’ll notice it fires signals on almost every candle , either confirming the trend or marking key pullbacks. It’s like having a radar that constantly tells you what to do.
How does it work? Super simple: Red arr
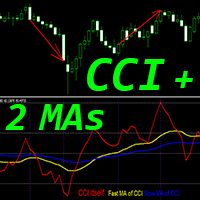
Crypto_Forex Indicator "CCI and 2 Moving Averages" for MT4 , No Repaint. Commodity_Channel_Index (CCI) is excellent for momentum trading into the trend direction. " CCI and 2 Moving Averages" Indicator allows you to see Fast and Slow Moving Averages of CCI indicator. Up trend - Fast MA is above Slow one; Down trend - Fast MA is below Slow one. CCI is one of the most popular oscillators for trading - it measures the difference between the current price and the historical averag
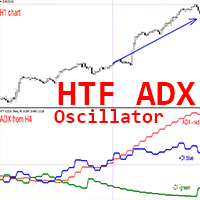
Crypto_Forex Indicator HTF ADX for MT4. Upgrade your trading methods with the professional HTF ADX indicator for MT4. H TF means - H igher Time Frame. ADX (red line) is used to measure trend strength - if ADX value is above 20 and has upstairs shape - trend is strong. If the +DMI (blue line) is above the -DMI (green one): price is moving up, and ADX measures the strength of the uptrend. If the -DMI (green line) is above the +DMI (blue one): price is moving down, and ADX mea

Crypto_Forex Indicator for MT4 Heiken Ashi Histo Filter - is great & efficient auxiliary trading tool! No Repaint! Advanced new calculation method is used - 10 options for parameter "Price for calculation". Excellent to combine with Price Action patterns: Green color histogram - Look for Bullish patterns. Magenta color histogram - Look for Bearish patterns. There are plenty of opportunities to upgrade even standard strategies with this indicator. Indicator has built-in M
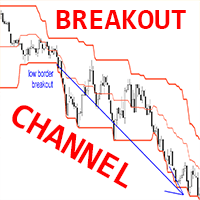
Crypto_Forex Indicator BREAKOUT CHANNEL for MT4, No Repaint. This indicator can be used as complete trading system based on High/Low breakouts. It has just 1 parameter - HYSTORY DEPTH, it reflects the number of candles which are taken into consideration by indicator. Parameter HYSTORY DEPTH recommended values: timeframe D1 - 20 (one month), H4 - 30 (one week), H1 - 24 (one day). BREAKOUT CHANNEL consist of 3 lines: High Border - max price of last N ( HYSTORY DEPTH parameter) candles, Lo
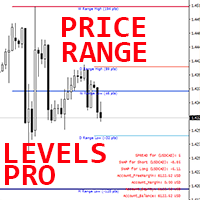
Forex Indicator "Price Range Levels Pro" for MT4. Indicator "Price Range Levels Pro" is very useful professional auxiliary trading tool. It shows you Daily, Weekly and Monthly most probable levels, which can be reached by price (price range levels). Daily range is useful for intraday traders. Weekly & Monthly ranges are useful for Swing and Long term traders. Indicator is excellent to plan your Take Profit targets or to arrange Stop Loss. It has Info Spread Swap Display - it shows current

Crypto_Forex Indicator "RSI SPEED" for MT4 - great predictive tool , No Repaint. The calculation of this indicator is based on equations from physics . RSI SPEED is the 1st derivative of RSI itself. RSI SPEED is good for scalping entries into the direction of main trend. Use it in combination with suitable trend indicator , for example HTF MA (as on pictures). RSI SPEED indicator shows how fast RSI itself changes its direction - it is very sensitive . It is recommended to use RS
M5 Signal
- M5 Signal was built specifically for the M5 timeframe and for all currency pairs.
- The M5 Signal indicator provides accurate BUY and SELL signals.
- The indicator is perfect for scalping.
- The indicator is easy to use.
- With a simple and intuitive interface, the indicator displays clear circles on the chart, making it easy to interpret and act on the signals.
When it detects a good entry point, it gives you a signal in the form of a circle.
- White circles: Buy signals.
-
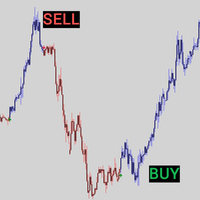
Special offer! https://www.mql5.com/ru/users/bossik2810 Arrow Candle - These are colored candles that show the trend based on volume and trend slope. This indicator will show you the color change on the next bar of the confirmation candle. Blue candles = possible buy (volume is increasing), Red candles = bullish weakness (volume is decreasing) possible sell. Arrow Candle is optimized for trading in any market and can be used in trending and non-trending markets. The Super Multiplier parameter
FREE

MarketSessions Indicator The Essential Tool for Global Market Session Visualization The MarketSessions indicator is a powerful MT4 tool designed to help traders visualize major forex market sessions directly on their charts. By clearly displaying the active trading hours of Sydney, Tokyo, London, and New York markets, this indicator helps you identify optimal trading periods and understand market volatility patterns. Key Features: Clear visualization of all four major trading sessions (Sydney, T
FREE
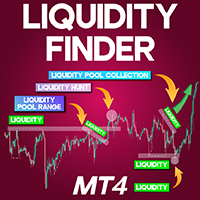
Liquidity Finder Indicator MT4
The Liquidity Finder Indicator MT4 is a powerful tool integrated into MetaTrader 4 (MT4) that assists traders in detecting zones of high liquidity concentration. This indicator automatically highlights both dynamic (angled) and static (horizontal, dotted) trend lines, offering insight into areas where price is likely to react. Static lines often align with significant chart patterns like Double Tops or Double Bottoms, acting as key markers for potential liquidity z
FREE
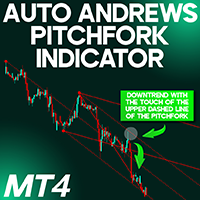
Auto Andrews Pitchfork indicator MT4 The Auto Andrews Pitchfork indicator MT4 is a technical analysis utility developed for MetaTrader 4 that identifies dynamic support and resistance zones based on price swings. This tool integrates well with MACD and determines three recent pivot points to draw a trio of parallel lines forming a pitchfork shape. The central median line of the pitchfork is a crucial level—acting as either a potential reversal points or confirming a trend continuation when breac
FREE
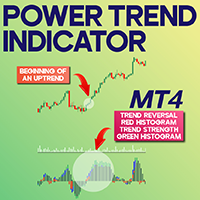
Power Trend Indicator for MetaTrader 4 The Power Trend Indicator for MetaTrader 4 is designed to assess both the momentum and direction of price movements. This MT4 indicator presents the trend strength using a four-color-coded system, allowing traders to spot weak momentum phases and anticipate potential trend initiations. Its visual feedback is valuable for recognizing shifts in market sentiment and detecting trend transitions. Red signals indicate reversals, blue suggests mild trends, while g
FREE
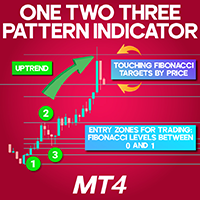
1-2-3 Pattern Indicator for MetaTrader 4
The 1-2-3 Pattern Indicator for MetaTrader 4 is a sophisticated technical tool designed to identify potential market reversals. It highlights three significant turning points, connecting them with a ZigZag pattern to visually map the price trajectory. Once the formation is complete, the indicator automatically generates Fibonacci retracement levels between the first two points to assist with trade planning. «Indicator Installation & User Guide»
MT4 Indi
FREE

Core Drift Index: Your Reliable Guide in the World of Trading Core Drift Index is an innovative trend indicator designed for precise detection of market directions and reversal points . This powerful tool enables traders to optimize their investments , minimize risk, and maximize profit. Key Features and Benefits Intuitive Trend Detection Core Drift Index clearly shows trend direction, helping traders make timely entry and exit decisions. High Probability of Success With its high accuracy
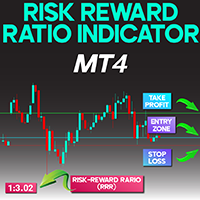
Risk Reward Indicator for MetaTrader 4
The Risk Reward Indicator for MetaTrader 4 is developed to assist traders in determining the potential risk and return of a trading position. It calculates the Risk-to-Reward Ratio (RRR) using three key levels: Entry Price (EP), Stop Loss (SL), and Take Profit (TP).
This tool graphically presents the RRR at the top-left corner of the chart and highlights the trade levels with three distinct horizontal lines:
• Green Line – Indicates the Take Profit level
•
FREE
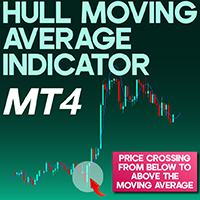
Hull Moving Average Indicator MetaTrader 4
The Hull Moving Average (Hull MA) indicator, developed by Alan Hull, is designed to minimize delay in standard moving averages and enhance responsiveness in trend evaluation. Available on the MetaTrader 4 platform, this indicator allows traders to spot short-term directional moves with greater clarity. It serves as an effective tool for identifying optimized trade entry and exit points. «Indicator Installation & User Guide»
MT4 Indicator Installation
FREE
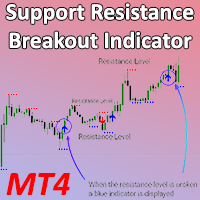
Support Resistance Breakout Indicator (SRBAI) download for MetaTrader 4
The Support Resistance Breakout Indicator (SRBAI) available for MetaTrader 4 (MT4) is designed to highlight significant pivot zones by mapping support and resistance levels on the price chart. Blue dashed lines represent support zones, while red dashed lines indicate resistance levels. Once the price breaks through a support area, the indicator generates a sell alert with a red downward-pointing arrow. Conversely, a resista
FREE
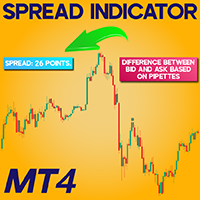
Spread Indicator download For Meta Trader 4
The Spread Indicator on MetaTrader 4 (MT4) serves to reveal the real-time gap between the Bid and Ask values. This variance, calculated in points (pipettes), appears clearly at the upper-left section of the chart window. «Indicator Installation & User Guide»
MT4 Indicator Installation | Spread Indicator Download for MT5 | ALL Products By TradingFinderLab | Best MT4 Indicator: Refined Order Block Indicator for MT4 | Best MT4 Utility: Trade
FREE
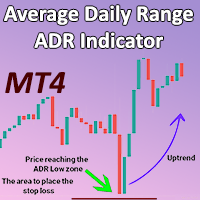
Average Daily Range (ADR) Indicator for MetaTrader 4 The Average Daily Range (ADR) Indicator for MetaTrader 4 is a vital technical analysis tool used to assess the typical price movement range an asset experience during a trading day.
By analyzing the average distance between daily highs and lows over a specified number of days, this indicator defines the ADR High (upper boundary) and ADR Low (lower boundary), helping traders identify possible support and resistance zones. «Indicator Installatio
FREE
MTRade is a professional arrow indicator based on the classic Parabolic SAR algorithm. It automatically detects the moments of trend direction change and displays clear signal arrows on the chart: up (buy) and down (sell).
Basis: original Parabolic SAR algorithm with full adaptation for visual display by arrows;
Signals: up arrow — possible up reversal (buy); down arrow — possible down reversal (sell);
No redrawing: signals are recorded only after a confirmed reversal, excluding "jumps" and
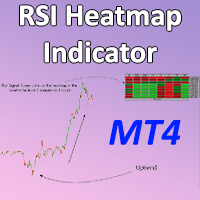
RSI Heatmap Indicator for MetaTrader4 The RSI Heatmap Indicator is a powerful technical tool in MetaTrader 4 that allows traders to assess the relative strength conditions of different currency pairs via a color-coded heatmap. By merging the Relative Strength Index (RSI) with a visual heatmap approach, this indicator simplifies market analysis by displaying strength and directional bias of multiple instruments at a glance. This indicator produces a heatmap based on calculated RSI levels across v
FREE
Trend detection is one of the basic challenges of every trader. Finding a way to tell when to enter a trade is very important, timing is a game changer, not too early and not too late. Sometimes, due to not knowing the market conditions, the trader closes his positions with a small profit or allows the losses to grow, these are the mistakes that novice traders make. Indicator Trend Whipper is a complete trading strategy and can improve the trader's trading process. The trend detection algorithm
Warp Range Sensor: The Color of Your Trend Warp Range Sensor is a trend direction indicator that visually displays the current market condition by coloring bars red and blue based on trend direction. What Does Warp Range Sensor Do? Identifies the Current Trend Direction Blue bars indicate an uptrend Red bars signal a downtrend Universal Application
Compatible with all currency pairs and timeframes , from short-term scalping to long-term trading. Powered by Market Context & Historical Data
W

Rocket pro is a powerful indicator for MetaTrader 4, designed to identify the most relevant trends in the financial market. If you are looking for a tool that accurately predicts movements, Rocket pro is your ally.
Live signal: https://www.mql5.com/en/signals/2303662 How it works: This indicator combines three different methods - volume analysis, candlestick closing and symmetrical trend - to detect and signal buying and selling opportunities. Rocket pro is like a "rocket" when it detects a bu

Divergence Divergence refers to when the price of a currency pair moves in one direction while the trend indicator is moving in the opposite direction. With divergence, there can be positive and negative signals. Divergences in Forex trading are quite common signals of technical analysis. These are basic early Forex signals indicating the trend reversal and filter false signals. Application of this indicator It is usually not easy to detect divergences by the trader and it may be time-consuming
This multimeter is a smaller version of the full scanner here: https://www.mql5.com/en/market/product/123072
This multimeter is for people interested in TDI Line Crossings. And who only use a single currency symbol/pair with multiple timeframes. If you want multiple currencies, then please look into the scanner.
It is for showing Cross of various TDI elements: PriceLine, Trade Signal Line and Market Base Line And for getting alerts, so you can be prepared for finding good trade setups before t
FREE

The indicator defines the buy and sell arrows with high performance and consistent results. Automatic analysis of market opportunities ; Help traders earn more from their investments;
Never repaints, recalculates or backpaints signals; This is FREE demo version of the indicator and works only on "EUR USD M5". ProTrading Arrow - All details about the indicator here : Works in all symbols and TF + free EA and Multi Currency Scanner + SPECIAL BONUS .
FREE
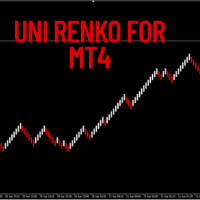
This versatile tool lets you create various Renko-style charts, including Median Renko, Mean Renko, and Traditional Renko with wicks . It offers a wide range of chart options to suit the needs of day traders, scalpers, and long-term investors.
Indicator Settings Starting Price. Box Size (in pips). Shift Percent. Timeframe Name. Show Wicks (On or Off). Amount of Bars.
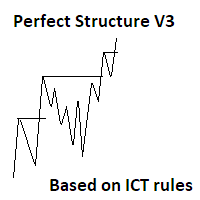
Here is the V3 of perfect structure. Whats new? (Please check added screenshots for better understanding.) 1. Coded based on ICT rules. 2. No more trend confusions...-- Added labels to show current trend 3. No more timeframe juggling and missing out important points, -- Now You can add indicator multiple times to mark multi timeframe structure on the same chart window( 1D structure on 4H or may be 4H structure on 15 min timeframe and more.....) 4. No more waiting in large range as sometimes mark

Pink J ICT trading system. Whats new? (Please check added screenshots for better understanding.) 1. Coded based on ICT rules. 2. No more trend confusions...-- Added labels to show current trend 3. No more timeframe juggling and missing out important points, -- Now You can add indicator multiple times to mark multi timeframe structure on the same chart window( 1D structure on 4H or may be 4H structure on 15 min timeframe and more.....) 4. No more waiting in large range as sometimes market makes h
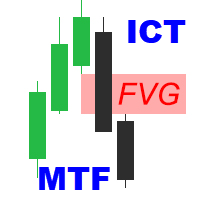
ICT Fair Value Gaps MTF Indicator Unlock the power of Fair Value Gaps (FVGs) across multiple timeframes using the ICT Fair Value Gaps Multi - Timeframe Indicator —a precision tool built for traders who follow the Smart Money Concept (SMC) . Key Features : Multi-Timeframe FVG Detection : Automatically identifies Fair Value Gaps from higher timeframes (M15, H1, H4, etc.) and plots them on your active chart for immediate insight. Dynamic Visualization : FVG zones are color-coded by
Scalping Strategy BUY SELL
Having a strategy in the market is one of the main conditions for trading. The presence of various and complicated indicators and tools sometimes makes trading difficult, and the user gets confused after trying various methods and gets stuck in a loss cycle, the result of which is usually clear. This indicator is a simple strategy based on the detection of pivots and short-term trends, which helps you to easily trade in trends. Sometimes a simple but efficient st

MACD Indicator The Moving Average Convergence and Divergence (MACD) is a trend following momentum indicator which shows the relationship between two moving averages that we chose and configure them on the indicator. The MACD is calculated by subtracting the 26-period exponential moving average and the 12 period D.A.M. These are the default parameters when you put the MACD indicator on the charts, and the period is usually 9 which means the last 9 candles. DT-Oscillator This is Robert C. Miner's
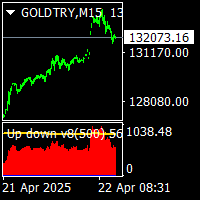
Up down v8 indicator is no repaint counter trend indicator . it try to find market up down points. it works all timeframes and all pairs. suitable for beginner and experienced trader. there is wave and c values to set defaults. minimum processed value cnt can be equal to wave value. traders can change them suitable up down points on different time frames. indicator use moving averages histograms and volatilty trigger. when red histogram is over volatility level that is tops. . when blue histogr
As the suggested, with this indicator you are able to switch from one symbol or timeframe to another in the same single chart. So forget about opening tons of chart on your screen! It's not designed for ICT or SMC trader, but if you are that kind of trader you still can use it. Imagine you have a strategy containing various indicators and settings, on a single chart you can screen the entry opportunity then move to the next symbol or timeframe.
FREE

Indicator defines the buy and sell arrows with high performance and consistent results . Automatic analysis of market opportunities ; Identifies a direction of a trend; Suitable for trend trading or following the trend;
This is FREE demo version of the indicator and works only on "EURUSD M5".
Forex Trend Commander full version: All details about the indicator here : Works in all symbols + free Multi Currency Scanner + free SPECIAL BONUS .
FREE

Price Change Indicator Introduction The Price Change Indicator is a powerful tool designed to help traders identify significant price movements over a specified period. By calculating and visualizing percentage changes between current and historical prices, it allows traders to quickly spot potential trading opportunities when markets show unusual volatility or momentum. Features Real-time monitoring of price changes Visual histogram display when changes exceed threshold Text display showing cur
FREE
RSI Powerful Arrows Works on ALL Timeframes
Instant Signals (No Delay / No Repaint)
Alerts: Pop-up, Sound, Email & Push Notifications
High Accuracy: ~98% Win Rate (optional Martingale)
Clean Arrows Directly on Chart (Main Window) The RSI Powerful Arrows is a highly reliable trading indicator that combines the Relative Strength Index (RSI) with Moving Averages and Bollinger Bands to deliver ultra-precise buy and sell signals. It draws non-repainting arrows dir

Hello fellow trader, I have built this indicator by combining trend and entry mechanisms i have used for years. This is one of my high probability strategies. All calculations are done based on pure price action-based market structure. Multiple confluences are used to validate and filter entries. All calculations are done behind the scenes, and you are given only buy sell signals. Accuracy becomes higher and higher as you trade higher timeframes, also based on my experience with the technique,

Hello fellow trader, I have built this indicator by combining trend and entry mechanisms i have used for years. This is one of my high probability strategies. All calculations are done based on pure price action-based market structure. Multiple confluences are used to validate and filter entries. All calculations are done behind the scenes, and you are given only buy sell signals. Accuracy becomes higher and higher as you trade higher timeframes, also based on my experience with the technique,

Ultimate Trend Rider
Ride the markets with confidence — your all‑in‑one trend‑capturing powerhouse.
Key Features & Benefits Adaptive Multi‑Filter Engine
Combines Supertrend, ADX, ATR volatility, and volume filters to ensure you enter only the strongest, most reliable trends. Multi‑Candle Confirmation
Eliminate “false start” signals: require multiple consecutive closes above/below your trend line before triggering an entry. Customizable Take‑Profit Alerts
Three levels of RSI‑based “TP” mar

Z Score Pair Trade Indicator for MT4 is a powerful statistical tool designed to help traders identify mean-reversion opportunities and overbought/oversold market conditions with precision. Based on standard deviation and mean analysis, this indicator calculates the Z-score of a selected spread, price series, or custom input to determine how far the current value deviates from its historical average.
Unlock powerful market insights with the Z Score Pair Trade Indicator — a must-have tool for tr
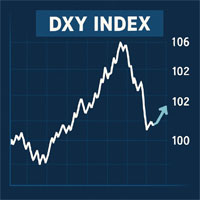
DXY Index indicator to help predict USD effect to your trade. DXY Index will help to see the power of USD.
For example if you trade XAUUSD and the DXY Index weaker, it could be the XAU will be bullish.
The same if DXY Index getting stronger, it could be that XAU will be bearish. I hope this indicator will help many trader to have better position to trade. Use this indicator wisely.

Arrow Indicator (Buy/Sell Alerts) – Simple Yet Powerful Tool! Product Version: 1.01 Indicator Type: Trend Reversal Signals Timeframes Supported: All (Recommended: H1, H4, D1) Key Features: Buy Signal : Green upward arrow () appears below the candle Sell Signal : Red downward arrow () appears above the candle Accurate Trend Reversal Detection – Based on tried and tested SMA strategy. ️ Clean Chart View – Minimalist, non-intrusive arrow signals for easy trading. Work

CDS SR Fractal Level: Enhance Your Trading Accuracy with Automatic Fractal-Based Support and Resistance Levels The CDS SR Fractal Level indicator is an advanced trading tool designed by CDS to automatically identify and visualize key Support and Resistance (SR) levels. This indicator utilizes the concept of fractals to present relevant SR levels for your trading decisions. Key Features: Automatic Fractal Level Identification: The indicator dynamically marks fractal levels as they form on the pri

The Great Oracle – Your Guide to Consistent Trend Trading Success
The Great Oracle is a powerful trend-following indicator designed for traders who seek precision in their entries and exits. Whether you’re navigating trending markets or spotting opportunities in ranging conditions, The Great Oracle provides you with accurate signals and a second chance to join strong market trends. It’s the ultimate tool for traders who want to maximize profits while keeping risks manageable.
Key Features:
•
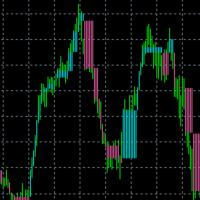
When there is no position, when changing the color, you can consider opening an order. With the fluctuation of the market, when the current color changes again, you need to close the position and leave. Suitable for different cycles, the trading rules are simple and require friends to explore on their own.
I hope friends who use this indicator can make a lot of money, rolling bigger and bigger like a snowball. thank you!

NOTE: CYCLEMAESTRO is distributed only on this website, there are no other distributors. Demo version is for reference only and is not supported. Full versione is perfectly functional and it is supported CYCLEMAESTRO , the first and only indicator of Cyclic Analysis, useful for giving signals of TRADING, BUY, SELL, STOP LOSS, ADDING. Created on the logic of Serghei Istrati and programmed by Stefano Frisetti ; CYCLEMAESTRO is not an indicator like the others, the challenge was to interpret only t
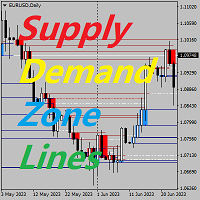
Supply Demand Zone Lines Indicator Background The system automatically searches for supply and demand zones in the Chart and draws real-time key price lines. Traders can trade according to the price trading lines. Main Features The system automatically searches for supply and demand zones. The system also draws real-time key price lines. Traders can trade according to the price trading lines. Therefore, traders who use the supply and demand zone strategy no longer need to spend time looking for
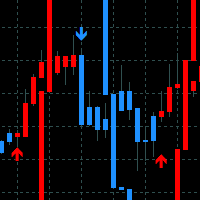
Reversal Bands - the indicator is designed to analyze volatility and apply the results in trading. Gives signals of price direction along the trend and at the early stages of a reversal.
Indicator capabilities
The indicator is based on speed lines built on the principles of acceleration and deceleration of volatility using the degree of smoothing. The driving force of the line is volatility, the greater it is, the more the lines deviate from the price. Red arrows, candles and speed lines show
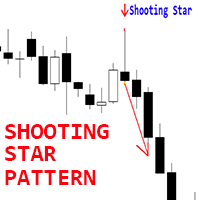
Crypto_Forex Indicator " Shooting Star pattern" for MT4. Indicator " Shooting Star pattern " is very powerful indicator for Price Action trading : No repaint, No delay. Indicator detects bearish Shooting Star patterns on chart: Red arrow signal on chart (see pictures). With P C, Mobile & Email alerts. Indicator " Shooting Star pattern" is excellent to combine with Support/Resistance Levels. // Great Trading Robots and Indicators are available here: https://www.mql5.com/e
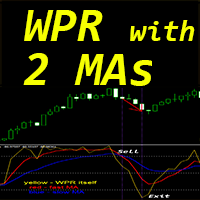
Crypto_Forex Indicator "WPR and 2 Moving Averages" for MT4 , No Repaint. WPR itself is one of the best oscillators for scalping. "WPR and 2 Moving Averages" Indicator allows you to see Fast and Slow Moving Averages of WPR oscillator. Indicator gives opportunities to see the price corrections very early. It is very easy to set up this indicator via parameters, it can be used on any time-frame. You can see Buy and Sell entry conditions on the pictures. Consider Buy signal conditions:
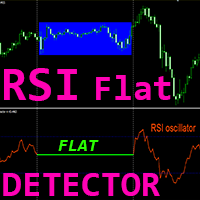
Crypto_Forex Indicator "RSI FLAT Detector" - is an efficient auxiliary tool in trading! No Repaint. I offer you to upgrade your trading methods with this great indicator for MT4.
Indicator shows price Flat areas on the chart. It has "Flat sensitivity" parameter - which is responsible for flat detection. "RSI FLAT Detector" can be used for Price Action entries confirmation or in combination with other indicators. You can use it for trend following systems to detect flat zo
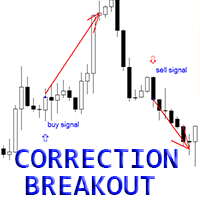
Crypto_Forex Indicator " Correction Breakout pattern" for MT4. Indicator " Correction Breakout pattern " is very powerful indicator for Price Action trading : No repaint, No delay. Indicator detects bullish and bearish Breakout bars after the price correction: Bullish Correction Breakout pattern - Blue arrow signal on chart (see pictures). Bearish Correction Breakout pattern - Red arrow signal on chart (see pictures). With P C, Mobile & Email alerts. Indicator "Correction Breakout
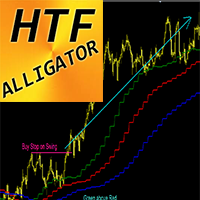
Crypto_Forex Indicator Alligator H igher Time Frame for MT4. Alligator indicator is one of the most powerful trend indicators. H TF means - H igher Time Frame. This indicator is excellent for Trend Traders as well as combination with Price Action entries. HTF Alligator Indicator allows you to attach Alligator from Higher time frame to your current chart. Consider Buy entries only when Green line is above Red one & Red is above Blue - arrange Buy Stop pending order on maximum
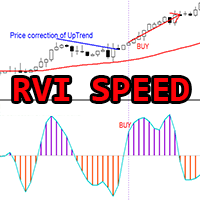
Crypto_Forex Indicator "RVI Speed" for MT4, No Repaint. The calculation of this indicator is based on equations from physics. RVI Speed is the 1st derivative of RVI itself. Relative_Vigor_Index (RVI) itself is a technical momentum indicator which is very useful on trend markets.
RVI Speed is good for momentum entries after price correction into the direction of main trend. Use it in combination with suitable trend indicator, for example standard EMA (as on pictures). RVI Speed indic
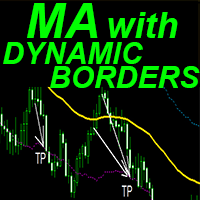
Crypto_Forex Indicator "Moving Average with Dynamic Borders" for MT4. Indicator has unique feature attached to Moving Average - Dynamic Volatility Borders. Dynamic Volatility Borders use Average True Range values for calculation. This indicator is great for TakeProfit targeting and SL arrangement on boarder lines. Indicator is excellent to combine with Price Action signals as well. // Great Trading Robots and Indicators are available here: https://www.mql5.com/en/users/def1380/se
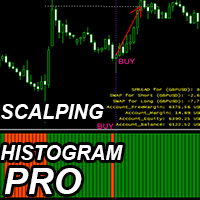
Crypto_Forex Indicator "Scalping Histogram Pro" for MT4 , No Repaint. Scalping Histogram Pro indicator can be used for search of entry signals into the main direction of price momentum after minor price correction. Scalping Histogram Pro can be in 2 colors: orange for bearish momentum and green for bullish one . Once you see at least 10 consecutive histogram bars of the same color it means strong momentum takes place. Entry signal is 1 column with opposite color in histog
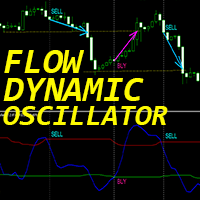
"Dynamic Flow Oscillator" - is an advanced custom Crypto_Forex indicator - efficient Trading tool for MT4 ! New generation of Oscillators - see pictures to check how to use it. Dynamic Flow Oscillator has adaptive Oversold/Overbought zones.
Indicator uses price and volume data for identifying oversold and overbought zones.
Oscillator is an auxiliary tool to find exact entry points from OverSold/OverBought areas. Oversold values: below Green line, Overbought values: over Red line . It is m
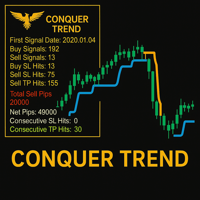
Conquer Trend – Master the Trend Like Never Before! Conquer Trend is your ultimate solution for dominating the markets with precision and simplicity. Built for traders who want to ride the strongest trends across any pair and any time frame, this powerful indicator brings together trend detection, retest confirmation, and performance tracking — all in one streamlined tool.
Multi-Timeframe Trend Analysis Get a clear view of the trend across multiple timeframes. Whether you're scalping, day tra

Product Name A arca Main Features Automatic Identification of Critical Zones
A arca automatically detects and highlights support and resistance levels, making it easier to identify potential entry and exit points. Clear Entry and Exit Signals
Displays buy and sell markers, helping traders define optimal points to open or close positions and improve trade decision-making. Multi-Timeframe Analysis
Integrates data from different chart periods (M5, M15, H1, etc.), enabling the detection of confl
123456789101112131415161718192021222324252627282930313233343536373839404142434445464748495051525354555657585960616263646566676869707172737475767778798081828384858687888990919293949596979899100101102103104105106107108109110111112113114115116117118119120121122123124125126127128129130131132133134135136137138139140141142143144145146147148149
The MetaTrader Market is a unique store of trading robots and technical indicators.
Read the MQL5.community User Memo to learn more about the unique services that we offer to traders: copying trading signals, custom applications developed by freelancers, automatic payments via the Payment System and the MQL5 Cloud Network.
You are missing trading opportunities:
- Free trading apps
- Over 8,000 signals for copying
- Economic news for exploring financial markets
Registration
Log in
If you do not have an account, please register
Allow the use of cookies to log in to the MQL5.com website.
Please enable the necessary setting in your browser, otherwise you will not be able to log in.