Watch the Market tutorial videos on YouTube
How to buy а trading robot or an indicator
Run your EA on
virtual hosting
virtual hosting
Test аn indicator/trading robot before buying
Want to earn in the Market?
How to present a product for a sell-through
New Technical Indicators for MetaTrader 4

NOTE: CYCLEMAESTRO is distributed only on this website, there are no other distributors. Demo version is for reference only and is not supported. Full versione is perfectly functional and it is supported CYCLEMAESTRO , the first and only indicator of Cyclic Analysis, useful for giving signals of TRADING, BUY, SELL, STOP LOSS, ADDING. Created on the logic of Serghei Istrati and programmed by Stefano Frisetti ; CYCLEMAESTRO is not an indicator like the others, the challenge was to interpret only t
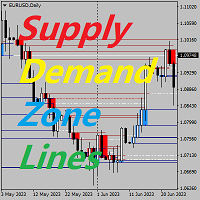
Supply Demand Zone Lines Indicator Background The system automatically searches for supply and demand zones in the Chart and draws real-time key price lines. Traders can trade according to the price trading lines. Main Features The system automatically searches for supply and demand zones. The system also draws real-time key price lines. Traders can trade according to the price trading lines. Therefore, traders who use the supply and demand zone strategy no longer need to spend time looking for
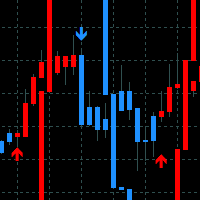
Reversal Bands - the indicator is designed to analyze volatility and apply the results in trading. Gives signals of price direction along the trend and at the early stages of a reversal.
Indicator capabilities
The indicator is based on speed lines built on the principles of acceleration and deceleration of volatility using the degree of smoothing. The driving force of the line is volatility, the greater it is, the more the lines deviate from the price. Red arrows, candles and speed lines show

The Multi Timeframe Candles indicator is a powerful visualization tool designed to help traders align their lower timeframe analysis with higher timeframe structure. By plotting candles from a selected higher timeframe (H1, H4, D1, etc.) directly on your current chart, this indicator gives you a clearer perspective of the overall market narrative without switching charts.
Who Needs This Indicator? This tool is ideal for: Smart Money Concept (SMC) / ICT Traders who rely on higher timeframe
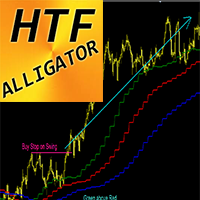
Crypto_Forex Indicator Alligator H igher Time Frame for MT4. Alligator indicator is one of the most powerful trend indicators. H TF means - H igher Time Frame. This indicator is excellent for Trend Traders as well as combination with Price Action entries. HTF Alligator Indicator allows you to attach Alligator from Higher time frame to your current chart. Consider Buy entries only when Green line is above Red one & Red is above Blue - arrange Buy Stop pending order on maximum
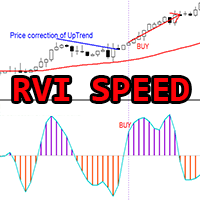
Crypto_Forex Indicator "RVI Speed" for MT4, No Repaint. The calculation of this indicator is based on equations from physics. RVI Speed is the 1st derivative of RVI itself. Relative_Vigor_Index (RVI) itself is a technical momentum indicator which is very useful on trend markets.
RVI Speed is good for momentum entries after price correction into the direction of main trend. Use it in combination with suitable trend indicator, for example standard EMA (as on pictures). RVI Speed indic
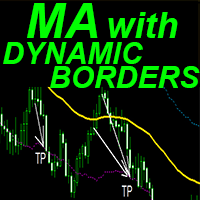
Crypto_Forex Indicator "Moving Average with Dynamic Borders" for MT4. Indicator has unique feature attached to Moving Average - Dynamic Volatility Borders. Dynamic Volatility Borders use Average True Range values for calculation. This indicator is great for TakeProfit targeting and SL arrangement on boarder lines. Indicator is excellent to combine with Price Action signals as well. // Great Trading Robots and Indicators are available here: https://www.mql5.com/en/users/def1380/se
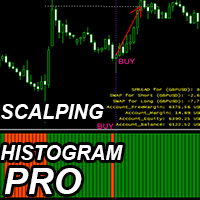
Crypto_Forex Indicator "Scalping Histogram Pro" for MT4 , No Repaint. Scalping Histogram Pro indicator can be used for search of entry signals into the main direction of price momentum after minor price correction. Scalping Histogram Pro can be in 2 colors: orange for bearish momentum and green for bullish one . Once you see at least 10 consecutive histogram bars of the same color it means strong momentum takes place. Entry signal is 1 column with opposite color in histog
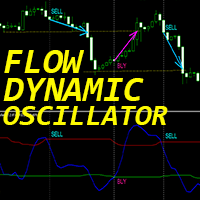
"Dynamic Flow Oscillator" - is an advanced custom Crypto_Forex indicator - efficient Trading tool for MT4 ! New generation of Oscillators - see pictures to check how to use it. Dynamic Flow Oscillator has adaptive Oversold/Overbought zones.
Indicator uses price and volume data for identifying oversold and overbought zones.
Oscillator is an auxiliary tool to find exact entry points from OverSold/OverBought areas. Oversold values: below Green line, Overbought values: over Red line . It is m
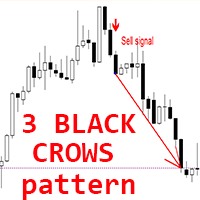
Crypto_Forex Indicator " 3 Black Crows pattern" for MT4. Indicator "3 Black Crows pattern" is very powerful for Price Action trading: No repaint, No delay. Indicator detects bearish "3 Black Crows" patterns on chart: Red arrow signal on chart (see pictures). With P C, Mobile & Email alerts. Also its brother - bullish "3 White Soldiers pattern" indicator is available (follow the link below).
Indicator "3 Black Crows pattern" is excellent to combine with Support/Resista
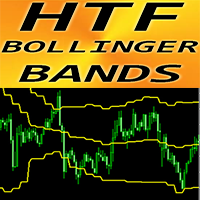
Crypto_Forex Indicator "HTF Bollinger Bands" for MT4. Upgrade your trading methods with the professional indicator "HTF Bollinger Bands" for MT4. H TF means - H igher Time Frame. Bollinger Bands is one of the best indicators on the market - perfect tool for trading. Approximately 90% of price action occurs between the two bands. HTF Bollinger Bands indicator is excellent for Multi-Time Frame trading systems with Price Action entries or in combination with other indicators. This ind
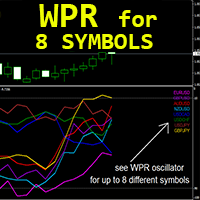
Forex Indicator "WPR for 8 Symbols" for MT4, No repaint. WPR itself is one of the best oscillators for scalping. It is great to take Sell entries from strong OverBought zone (above -10) and Buy entries from strong OverSold zone (below -90). "WPR for 8 Symbols" gives opportunity to control WPR values of up to 8 different symbols just on 1 chart.
This indicator is excellent to combine with Price Action entries from OverSold/OverBought areas as well. // Great Trading Robots and In
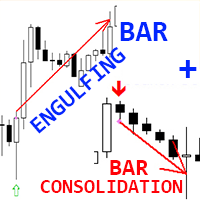
Crypto_Forex Indicator " Engulfing Bar and Consolidation Bar" patterns for MT4. "Engulfing Bar and Consolidation Bar" patterns is very powerful for Price Action trading. Indicator detects Engulfing Bars and Consolidation Bars on chart: Bullish Engulfing Bar pattern - Green arrow signal on chart. Bearish Engulfing Bar pattern - Orange arrow signal on chart. Bullish Consolidation Bar pattern - Blue arrow signal on chart. Bearish Consolidation Bar pattern - Red arrow signal on chart.
No
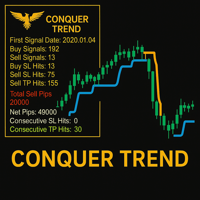
Conquer Trend – Master the Trend Like Never Before! Conquer Trend is your ultimate solution for dominating the markets with precision and simplicity. Built for traders who want to ride the strongest trends across any pair and any time frame, this powerful indicator brings together trend detection, retest confirmation, and performance tracking — all in one streamlined tool.
Multi-Timeframe Trend Analysis Get a clear view of the trend across multiple timeframes. Whether you're scalping, day tra
FullScalping is a non-repainting and no backpainting indicator, specifically designed to generate CONSTANT scalping entries across any market. Perfect for aggressive traders who want nonstop action!
Check the Indicators channel for new information and updates: CLICK HERE You’ll notice it fires signals on almost every candle , either confirming the trend or marking key pullbacks. It’s like having a radar that constantly tells you what to do.
How does it work? Super simple: Red arr

Product Name A arca Main Features Automatic Identification of Critical Zones
A arca automatically detects and highlights support and resistance levels, making it easier to identify potential entry and exit points. Clear Entry and Exit Signals
Displays buy and sell markers, helping traders define optimal points to open or close positions and improve trade decision-making. Multi-Timeframe Analysis
Integrates data from different chart periods (M5, M15, H1, etc.), enabling the detection of confl
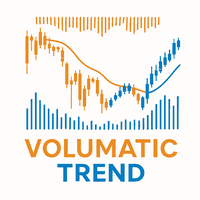
Volumatic Trend is a powerful, trend-following indicator that merges directional analysis with real-time volume behavior. By combining adaptive trend logic and volume overlays, it gives traders a detailed snapshot of market conviction and potential turning points. From instant trend shift detection to volume-weighted candle visuals, this tool brings deeper context to price movement. MT5 Version - https://www.mql5.com/en/market/product/136211/ Join To Learn Market Depth - https://www.mql5.com/
FREE
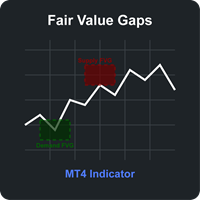
Fair Value Gaps (FVG) Indicator for MT4 The Fair Value Gaps (FVG) Indicator is a powerful technical analysis tool designed to identify and visualize significant price imbalances in the market. These gaps, created when price makes a strong directional move, represent areas where price has moved so quickly that no trading activity occurred, potentially indicating institutional interest and strong market momentum. Key Features: Dual Gap Detection : Automatically identifies both Supply FVGs (bearish
FREE

MarketSessions Indicator The Essential Tool for Global Market Session Visualization The MarketSessions indicator is a powerful MT4 tool designed to help traders visualize major forex market sessions directly on their charts. By clearly displaying the active trading hours of Sydney, Tokyo, London, and New York markets, this indicator helps you identify optimal trading periods and understand market volatility patterns. Key Features: Clear visualization of all four major trading sessions (Sydney, T
FREE
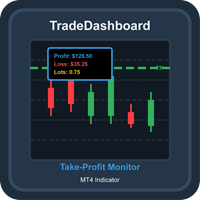
TradeDashboard Comprehensive MT4 Indicator for Trade Visualization and Analysis Overview TradeDashboard is a powerful MetaTrader 4 indicator designed to enhance your trading experience by providing real-time visualization of take-profit levels for all open positions. This advanced tool goes beyond basic TP indicators by displaying comprehensive metrics including potential profits, losses, and total lot sizes, all directly on your chart. Key Features Take-Profit Visualization : Clearly displays h
FREE
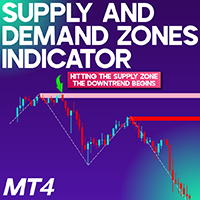
Supply and Demand Zones Indicator MT4
The Supply and Demand Zones Indicator MT4 is a vital price action-based tool used within the MetaTrader 4 platform. It detects and marks high-probability supply (resistance) and demand (support) zones by analyzing historical price activity. This tool automatically renders these critical regions on the chart using distinct color-coded rectangles, allowing traders to pinpoint strategic buy and sell areas. «Indicator Installation & User Guide»
MT4 Indicator I
FREE
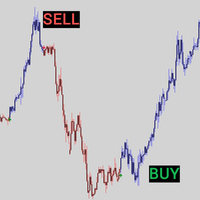
Arrow Candle - These are colored candles that show the trend based on volume and trend slope. This indicator will show you the color change on the next bar of the confirmation candle. Special offer - https://www.mql5.com/en/users/bossik2810/news Blue candles = possible buy (volume is increasing), Red candles = bullish weakness (volume is decreasing) possible sell. Arrow Candle is optimized for trading in any market and can be used in trending and non-trending markets. The Super Multiplier param
FREE
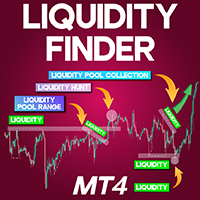
Liquidity Finder Indicator MT4
The Liquidity Finder Indicator MT4 is a powerful tool integrated into MetaTrader 4 (MT4) that assists traders in detecting zones of high liquidity concentration. This indicator automatically highlights both dynamic (angled) and static (horizontal, dotted) trend lines, offering insight into areas where price is likely to react. Static lines often align with significant chart patterns like Double Tops or Double Bottoms, acting as key markers for potential liquidity z
FREE
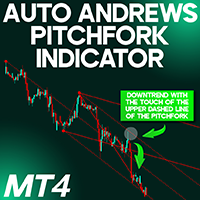
Auto Andrews Pitchfork indicator MT4 The Auto Andrews Pitchfork indicator MT4 is a technical analysis utility developed for MetaTrader 4 that identifies dynamic support and resistance zones based on price swings. This tool integrates well with MACD and determines three recent pivot points to draw a trio of parallel lines forming a pitchfork shape. The central median line of the pitchfork is a crucial level—acting as either a potential reversal points or confirming a trend continuation when breac
FREE

Power Trend Indicator for MetaTrader 4 The Power Trend Indicator for MetaTrader 4 is designed to assess both the momentum and direction of price movements. This MT4 indicator presents the trend strength using a four-color-coded system, allowing traders to spot weak momentum phases and anticipate potential trend initiations. Its visual feedback is valuable for recognizing shifts in market sentiment and detecting trend transitions. Red signals indicate reversals, blue suggests mild trends, while g
FREE

BreakEven PRO line – Instantly visualize your breakeven point Have you ever wondered exactly where your open trades would reach breakeven — no profit, no loss?
BreakEven PRO line is a visual indicator created for traders managing multiple positions. It automatically displays a horizontal line at the average breakeven price for your open BUY and SELL orders, clearly labeled with the live value on your chart. Perfect for hedging strategies , risk management , or simply maintaining precise control
FREE
MTRade is a professional arrow indicator based on the classic Parabolic SAR algorithm. It automatically detects the moments of trend direction change and displays clear signal arrows on the chart: up (buy) and down (sell).
Basis: original Parabolic SAR algorithm with full adaptation for visual display by arrows;
Signals: up arrow — possible up reversal (buy); down arrow — possible down reversal (sell);
No redrawing: signals are recorded only after a confirmed reversal, excluding "jumps" and

Overview Inspired by Tradingview’s falconCoin, The Market Cipher indicator is a momentum oscillator used to detect overbought/oversold conditions and potential trend reversals. Traders can also use it to spot divergences between price action and momentum for early entry or exit signals. Configuration Guide Core Indicator Settings The indicator calculates momentum using a short-term and a longer-term average. Momentum is plotted as a wave oscillating between overbought and oversold thresholds. Ov
FREE

Belladonna is an advanced custom technical indicator for MetaTrader 4 based on Hull Moving Average (HMA). It visualizes the trend direction using colored lines and arrows on the chart. The indicator is optimized to minimize lag and eliminate market noise, making it especially useful for short-term and medium-term trading.
Functions and Features: Moving Average Type: Hull Moving Average (based on two EMA/SMA lines).
Calculation Methods: Support for different types of moving average (SMA, EMA,
Quickly search for matching Moving Averages (MAs) at any point you click on the chart! This tool is perfect for identifying trend peaks and supporting your trading decisions by instantly displaying relevant MAs. Features: Simple Operation: Click on any point where you want to find the MA. Instant Results: Displays matching MAs if found. Sleep Function: Hide buttons when not in use for a cleaner interface. Manual Control: Adjust MAs manually with on-screen buttons. Fixate MAs: After discovering a

The trend indicator processes each bar of the chart and displays signal arrow on it. In the default display settings: red arrow - sell signal blue arrow - buy signal If the arrows are missing on some bars, this means that the algorithm has not identified a consensus on the signal on this bar. The indicator does not have any technical settings for the algorithm. The process of finding a consensus is fully automated.
For ease of visualization on charts, user settings allow you to set the size of
In addition to the MA of the set period, the MAs of the two higher timeframes with the same period are displayed on the chart simultaneously (though in a simulated way). No matter which timeframe you switch to, it will display the MA for that timeframe as well as the MAs for the two higher timeframes. Additionally, it will show the 200 MA as well!
To display the MA for the higher timeframes on the current chart, you need to set the MA calculated using the Moving Average indicator. If you try to
FREE
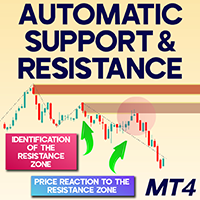
Automatic Support & Resistance Indicator for MT4
The Automatic Support & Resistance Indicator for MT4 is a specialized tool within the MetaTrader 4 platform, developed to autonomously detect significant support and resistance levels across multiple timeframes. Utilizing historical price interactions, it marks support regions with green and resistance zones with brown, simplifying visual analysis for traders.
This indicator is widely used by market professionals to forecast potential price turni
FREE

Indicator defines the buy and sell arrows with high performance and consistent results, suitable for trend trading or following the trend. Automatic analysis of market opportunities ; Defines the Buy and Sell arrows; Identifies a direction of a trend; This is FREE demo version of the indicator and works only on "EURUSD M15".
Forex Trend Commander full version: All details about the indicator here : Works in all symbols + free Multi Currency Scanner + free SPECIAL BONUS .
FREE
TT signal
Welcome to our page!
TT signal is a super indicator for MetaTrader 4, with two types of arrows for comfortable and profitable trading.
It is a sophisticated and accurate indicator designed for active traders in financial markets.
It is easy to use, which makes it an essential tool for traders of all experience levels.
This indicator has very good potential.
It is fantastic.
It detects reversals, so you get an almost certain result on every trade.
The indicator is based on arro
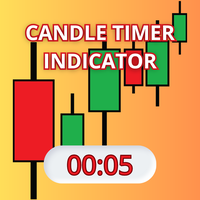
Candle Timer Indicator is a custom tool designed for the MetaTrader 4 (MQL4) trading platform. Its primary purpose is to display a moving timer on the chart, indicating the remaining time before the current candle closes. This feature is particularly useful for traders who need precise tracking of candle closing times for their technical analysis strategies.
Dynamic Color Change: The ti
FREE
This multimeter is a smaller version of the full scanner here: https://www.mql5.com/en/market/product/123072
This multimeter is for people interested in TDI Line Crossings. And who only use a single currency symbol/pair with multiple timeframes. If you want multiple currencies, then please look into the scanner.
It is for showing Cross of various TDI elements: PriceLine, Trade Signal Line and Market Base Line And for getting alerts, so you can be prepared for finding good trade setups before t
FREE
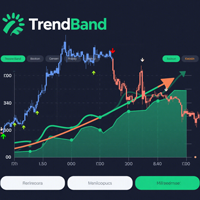
TrendBand Navigator Pro – Non-Repainting Multi-Timeframe Trading System
Powered by proprietary multi-dimensional trend band algorithm delivering clear arrow signals Big Arrows Define Direction Small Arrows Capture Entries Core Advantages
Intelligent Noise Filtering
Volatility-adaptive technology avoids false breakouts, triggers arrows only during strong trends Multi-Timeframe Compatibility
Automatically adapts from 1-minute to monthly charts for all trading strategies Vis
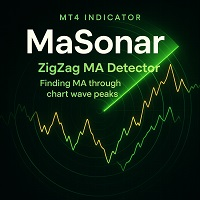
MaSonar We are excited to announce that the new version of our indicator, MaSonic , has been completed! As a gesture of appreciation to our users, we are offering the previous version, MaSonar , for free. MaSonar is a powerful indicator designed to automatically detect and display the relevant Moving Averages (MA) that align with the peaks of a ZigZag . It quickly searches for the most suitable MA at each ZigZag peak, helping you analyze the market trend and its momentum with ease. Key Features
FREE
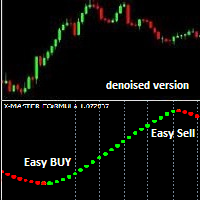
The X-master V2 Denoised Indicator is a base original indicator with added multi layer filters to remove noise. This tool enhances the ability to identify both the strength and direction of a trend with greater accuracy. The X-master Metatrader 4 Indicator provides Entry Signals for traders using green and red arrows . 1. With easy sell and buy comes with alerting system that informs the user about the trend shift so user dont have to stick to the screen. 2. It wo

Tento jedinečný indikátor vám ukazuje rozsah, v ktorom sa pohybujú maloobchodní klienti. Spravidla, ak sa cena udržiava na priemernej úrovni, neskôr dosiahne vrchol a potom sa vráti na opačnú stranu. Indikátor je vhodný pre všetky grafy s možnosťou nastavenia pákového efektu, teda ak zoberieme do úvahy, že retailoví klienti sa pohybujú na trhu s pákovým efektom 500 až 100 páka. Indikátor je vhodný pre väčšie časové rámce H1,H4... s väčšími pákami 100,50,25 ale aj pre malé grafy M5,M15 s pákami

Gold Dxy Divergence Pro is an indicator that tracks divergence between XAUUSD (Gold) and a synthetic USD Index (DXY).
It plots values for both assets, highlights bullish/bearish divergences via histogram, and includes customizable alerts when divergence exceeds a set threshold.
Ideal for traders analyzing gold-USD inverse relationships.
Gold line - Gold Blue line - DXY
Timeframe - Any Symbol - XAUUSD

The indicator is based on the calculation of liquidity on the market and thus shows where the market can most likely turn.. It shows the places of liquidity where the price will reach sooner or later... The indicator can be set to several types of liquidity and therefore can display several levels on the graph.. It is a unique tool that can help you very well in your trading The indicator is suitable for currency pairs with the most liquidity (Forex,EURUSD,GBPUSD...) The indicator is suitable fo

Gold Strength Index Pro (GSI Pro) is an indicator designed to analyze gold's strength across multiple currency pairs. It aggregates weighted price data from 7 XAU pairs (e.g., XAUUSD, XAUEUR) over a user-defined lookback period, calculating a composite strength value.
Key features include: Color-Coded Histogram : Displays bullish (green), bearish (red), or neutral (gray) momentum based on a threshold zone (±0.2 default). Smoothed Lines : A gold-colored EMA (SmoothPeriod) reduces noise, while
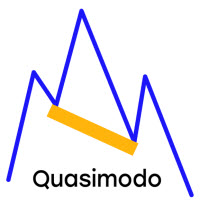
The Quasimodo Pattern Indicator is no more difficult than the Head and Shoulders. Still, only a few traders know about it, and some even confuse one with the other. However, this is not a reason to avoid this tool in your forex trading strategy. Features: Automatic Detection: The indicator automatically scans for valid QM patterns across any timeframe, reducing the need for manual chart analysis. Visual Highlights: Clear and customizable on-chart drawing of shoulders, heads, and breako

The indicator defines the buy and sell arrows with high performance and consistent results. Automatic analysis of market opportunities ; Help traders earn more from their investments;
Never repaints, recalculates or backpaints signals; This is FREE demo version of the indicator and works only on "EUR USD M5". ProTrading Arrow - All details about the indicator here : Works in all symbols and TF + free EA and Multi Currency Scanner + SPECIAL BONUS .
FREE
RSI Powerful Arrows Works on ALL Timeframes
Instant Signals (No Delay / No Repaint)
Alerts: Pop-up, Sound, Email & Push Notifications
High Accuracy: ~98% Win Rate (optional Martingale)
Clean Arrows Directly on Chart (Main Window) The RSI Powerful Arrows is a highly reliable trading indicator that combines the Relative Strength Index (RSI) with Moving Averages and Bollinger Bands to deliver ultra-precise buy and sell signals. It draws non-repainting arrows dir
M5 Signal
- M5 Signal was built specifically for the M5 timeframe and for all currency pairs.
- The M5 Signal indicator provides accurate BUY and SELL signals.
- The indicator is perfect for scalping.
- The indicator is easy to use.
- With a simple and intuitive interface, the indicator displays clear circles on the chart, making it easy to interpret and act on the signals.
When it detects a good entry point, it gives you a signal in the form of a circle.
- White circles: Buy signals.
-

iMRPHN: Supertrend & Swing Reversal Indicator Description: A precision trading indicator that combines dynamic Supertrend Zones with intelligent Swing Entry Detection for both trend-following and reversal scalping strategies.
Optimized for multi-timeframe setups, this indicator features: Auto-detected Swing High/Low points Real-time Supertrend Reversal Zones Visual Buy/Sell Indications Sub-swing (microstructure) detection (optional) Countdown Timer for Candle Close Custom Alerts: Pop

Ultimate Trend Rider
Ride the markets with confidence — your all‑in‑one trend‑capturing powerhouse.
Key Features & Benefits Adaptive Multi‑Filter Engine
Combines Supertrend, ADX, ATR volatility, and volume filters to ensure you enter only the strongest, most reliable trends. Multi‑Candle Confirmation
Eliminate “false start” signals: require multiple consecutive closes above/below your trend line before triggering an entry. Customizable Take‑Profit Alerts
Three levels of RSI‑based “TP” mar
The presented indicator is an original development. The indicator gives signals to open/close a position. The indicator sensitivity can be adjusted in a literally infinite range, which allows it to be used for trading in any market. The indicator signals vary in strength depending on their consistency with the trend over three different time periods. The above indicator feature allows you to estimate the indicator signal potential in advance. Namely: If the signal is strong (coincides with the
The presented product is the author's implementation of the REI (Range Expansion Index) indicator developed by Thomas DeMark. REI Oscillator AM is an indicator that measures the rate of price change and signals overbought/oversold conditions if the price shows weakness or strength. The indicator value changes within the range from -100 to +100. Thomas DeMark suggests using the default period of 8 and the following algorithm for using the indicator: When the price rises above level 60 and then fa
FREE
The presented indicator is an original development. The indicator places two types of signals on the price chart: Signals to open a position; Signals to close a position. The indicator signals appear after the bar formation is complete and are not redrawn. The signals require confirmation, namely - the price must overcome the maximum (for buying) or minimum (for selling) of the bar on which the signal was placed. The indicator can send notifications about its signals to a mobile terminal and e-
FREE
The presented indicator is the author's implementation in the oscillator format of the classic Aroon indicator. The Aroon indicator was developed in 1995 by the Indian trader Tushar Chande. Chand's origin played a role in choosing an unusual name for the oscillator. "Aroon" is translated from Sanskrit as "Light of the morning dawn". The formula for calculating the classic Aroon indicator: Aroon-Up = ((specified number of periods) – (number of periods since the maximum was formed)) / (specified n
FREE
The presented indicator is the author's implementation of the classic Aroon indicator. The Aroon indicator was developed in 1995 by the Indian trader Tushar Chand. Chand's origin played a role in choosing an unusual name for the indicator. "Aroon" is translated from Sanskrit as "Light of the morning dawn". The formula for calculating the classic Aroon indicator: Aroon-Up = ((specified number of periods) - (number of periods since the formation of the maximum)) / (specified number of periods) * 1
FREE

The presented indicator allows you to visualize the current trend. The indicator identifies the trend using the following definition as an algorithm: A trend is a situation when each subsequent maximum price rise is higher/lower than the previous one, and similarly each subsequent maximum price fall is higher/lower than the previous one; The beginning of a new trend is considered to be when the current maximum/minimum overcomes all maximums/minimums of a specified number of previous bars. The i
FREE
The presented indicator is the author's implementation of the DMI indicator. DMI (Directional movement Index) is a directional movement index. The concept of the indicator was developed by Welles Wilder. This is a technical indicator, it is used to identify the trend direction, moments of the market exiting consolidation and to confirm potential reversal points. It is an oscillator consisting of two curves. The constituent components of the Directional Movement Index: +DI (Positive Directional
FREE

new products: https://www.mql5.com/en/market/product/136392?source=Site +Market+My+Products+Page
Speed Scalp Indicator – NON-Repaint
The Ultimate Tool for Fast and Precise Scalping
Perfect for Gold (XAUUSD) & Lower Timeframes The Speed Scalp Indicator is a powerful, non-repainting trading tool specifically engineered for scalpers who thrive on speed, precision, and high-frequency entries. Tailored for timeframes 30 minutes and below , this indicator is especially optimized for Gold (XAUUSD)
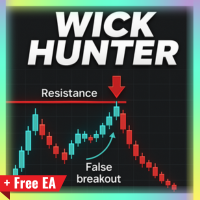
After purchase, you are eligible to receive EA Forex Proton and try it for 14 days completely FREE! This robot automates the alerts from Wick Hunter!
Tired of getting trapped by false breakouts? Wick Hunter is a powerful custom indicator designed to detect fakeouts and identify true reversals before the crowd catches on. Built on the proven False Breakout Strategy , Wick Hunter helps you: Spot liquidity grabs and stop-hunts Enter with precision near wicks Avoid fake breakouts that ruin trades
The High Low Tracker is an essential indicator for any trader who values precision and clarity in identifying key price levels. Designed for traders using institutional strategies such as ICT (Inner Circle Trader) , BTMM (Bank Trading Market Maker) , and SMC (Smart Money Concepts) , this tool simplifies multi timeframe analysis by plotting significant highs and lows directly onto your current chart. Whether you're scalping, day trading, or swing trading, this indicator offers insta
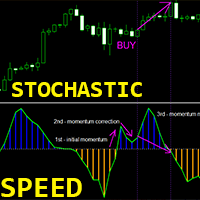
Crypto_Forex Indicator "Stochastic Speed" for MT4 - great predictive tool , No Repaint. The calculation of this indicator is based on equations from physics . Stochastic Speed is the 1st derivative of Stochastic itself. It is recommended to use Stochastic Speed indicator for Scalping momentum trading strategies (see pictures) :
If S tochastic Speed is above 0 - this is positive speed : price momentum goes up. If S tochastic Speed is below 0 - this is negative speed : price moment

Crypto_Forex Indicator "Major Trend Correction Histogram" for MT4 , No Repaint. Major Trend Correction Histogram indicator was designed to detect big trends. Indicator can be in 2 colors: Red for bearish trend and Blue for bullish one (colors can be changed). At least 10 consecutive histogram columns of the same color means beginning of new trend. Indicator has built-in Mobile and PC alerts.
Parameter "Period" is responsible for indicator's sensitivity.
HOW TO USE indicator: 1) Chec
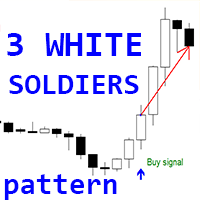
Crypto_Forex Indicator " 3 White Soldiers pattern" for MT4. Indicator "3 White Soldiers pattern" is very powerful for Price Action trading: No repaint, No delay. Indicator detects bullish "3 White Soldiers" patterns on chart: Blue arrow signal on chart (see pictures). With P C, Mobile & Email alerts. Also its brother - bearish "3 Black Crows pattern" indicator is available (follow the link below).
Indicator "3 White Soldiers pattern" is excellent to combine with Support/Resista
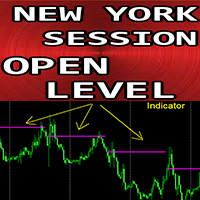
Crypto_Forex Indicator "New York Session Open Level" for MT4. Indicator "New York Session Open Level" is very useful auxiliary indicator for intraday trading. Session open price level is so important because very often price returns back to that area during the day. Indicator shows you NY session open price level daily for each day. Also indicator shows week open level on Mondays. It is useful for intraday traders to set up targets or use as support/resistance area. // Great Trading Robots a
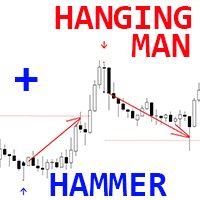
Crypto_Forex Indicator " Hammer and Hanging Man patterns" for MT4. Indicator " Hammer and Hanging Man" is very powerful indicator for Price Action trading: No repaint, No delay. Indicator detects bullish Hammer pattern and bearish Hanging Man pattern on chart: Bullish pattern Hammer - Blue arrow signal on chart (see pictures). Bearish pattern Hanging Man - Red arrow signal on chart (see pictures). With P C, Mobile & Email alerts. Indicator " Hammer and Hanging Man " is excellent to
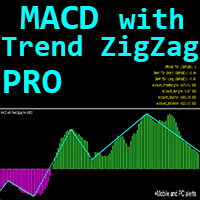
Crypto_Forex Indicator "MACD with Trend ZigZag Pro" for MT4. MACD indicator itself is one of the most popular tool for trend trading. "MACD with Trend ZigZag Pro" is excellent for using with Price Action entries or in combination with other indicators. Use this indicator to select most accurate entry signals: - If MACD is above 0 (green color) and ZigZag line is upward - search only for Buy Price Action patterns. - If MACD is below 0 (pink color) and ZigZag line is downward - search only
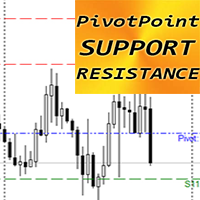
Crypto_Forex Indicator "PIVOT POINT Support Resistance" for MT4. Indicator "Pivot Point Support Resistance" is very powerful auxiliary indicator for Price Action trading. Pivot Levels are calculated as an average of significant prices from the performance of a market in the prior trading period. Pivot Levels itself represent a levels of highest resistance or support , depending on the overall market condition. Indicator " Pivot Point Support Resistance" shows you the most probable rev
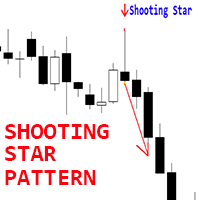
Crypto_Forex Indicator " Shooting Star pattern" for MT4. Indicator " Shooting Star pattern " is very powerful indicator for Price Action trading : No repaint, No delay. Indicator detects bearish Shooting Star patterns on chart: Red arrow signal on chart (see pictures). With P C, Mobile & Email alerts. Indicator " Shooting Star pattern" is excellent to combine with Support/Resistance Levels. // Great Trading Robots and Indicators are available here: https://www.mql5.com/e
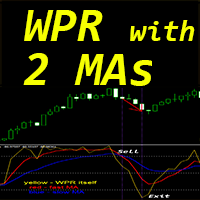
Crypto_Forex Indicator "WPR and 2 Moving Averages" for MT4 , No Repaint. WPR itself is one of the best oscillators for scalping. "WPR and 2 Moving Averages" Indicator allows you to see Fast and Slow Moving Averages of WPR oscillator. Indicator gives opportunities to see the price corrections very early. It is very easy to set up this indicator via parameters, it can be used on any time-frame. You can see Buy and Sell entry conditions on the pictures. Consider Buy signal conditions:
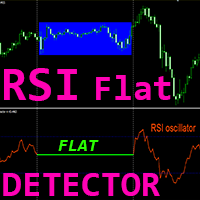
Crypto_Forex Indicator "RSI FLAT Detector" - is an efficient auxiliary tool in trading! No Repaint. I offer you to upgrade your trading methods with this great indicator for MT4.
Indicator shows price Flat areas on the chart. It has "Flat sensitivity" parameter - which is responsible for flat detection. "RSI FLAT Detector" can be used for Price Action entries confirmation or in combination with other indicators. You can use it for trend following systems to detect flat zo
123456789101112131415161718192021222324252627282930313233343536373839404142434445464748495051525354555657585960616263646566676869707172737475767778798081828384858687888990919293949596979899100101102103104105106107108109110111112113114115116117118119120121122123124125126127128129130131132133134135136137138139140141142143144145146147148149
Learn how to purchase a trading robot from the MetaTrader Market, the store of application for the MetaTrader platform.
The MQL5.community Payment System supports transactions via PayPal, bank cards and popular payment systems. We strongly recommend that you test the trading robot before buying, for a better customer experience.
You are missing trading opportunities:
- Free trading apps
- Over 8,000 signals for copying
- Economic news for exploring financial markets
Registration
Log in
If you do not have an account, please register
Allow the use of cookies to log in to the MQL5.com website.
Please enable the necessary setting in your browser, otherwise you will not be able to log in.