Articles on the MQL5 programming and use of technical indicators
Technical indicators constitute an important part of trading, and every trader tries to find something new. The authors of these articles talk about econometrics and machine learning, automatic marking of Elliott Waves and digital filters - everything from the classical methods of analysis to the modern interpretation of classical ideas.
The category features articles that will teach you how to develop a custom indicator and contains unique collections of ready-to-use mathematically explained William Blau's trading ideas.
Add a new article

You are missing trading opportunities:
- Free trading apps
- Over 8,000 signals for copying
- Economic news for exploring financial markets
Registration
Log in
You agree to website policy and terms of use
If you do not have an account, please register
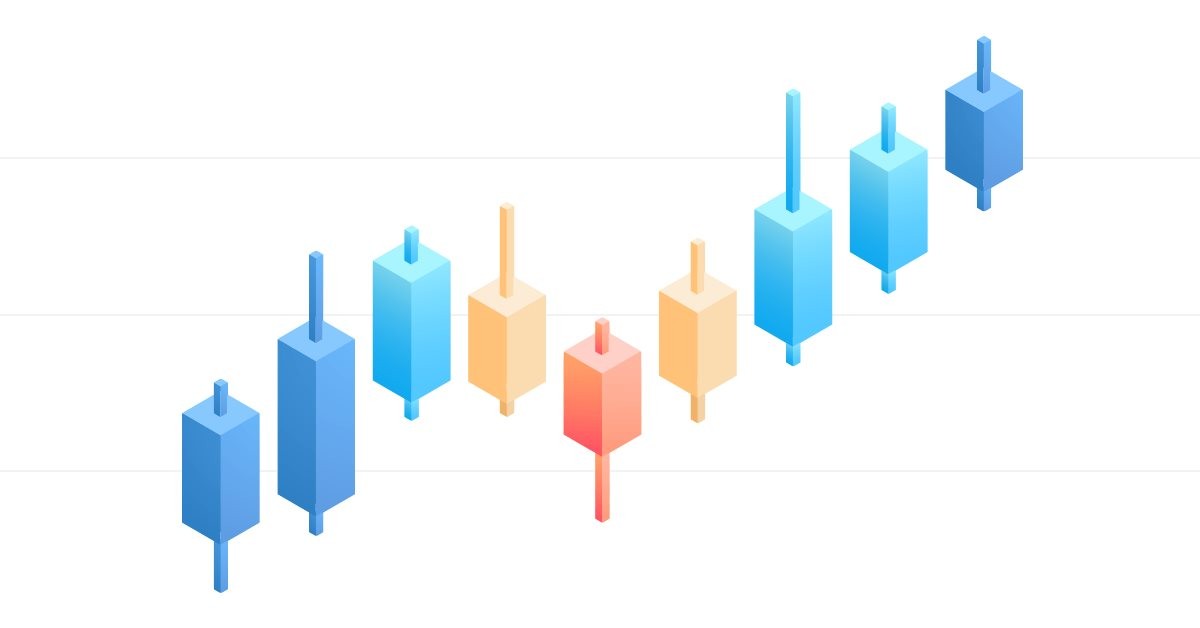
Exploring options for creating multicolored candlesticks
In this article I will address the possibilities of creating customized indicators with candlesticks, pointing out their advantages and disadvantages.

Bid/Ask spread analysis in MetaTrader 5
An indicator to report your brokers Bid/Ask spread levels. Now we can use MT5s tick data to analyze what the historic true average Bid/Ask spread actually have recently been. You shouldn't need to look at the current spread because that is available if you show both bid and ask price lines.


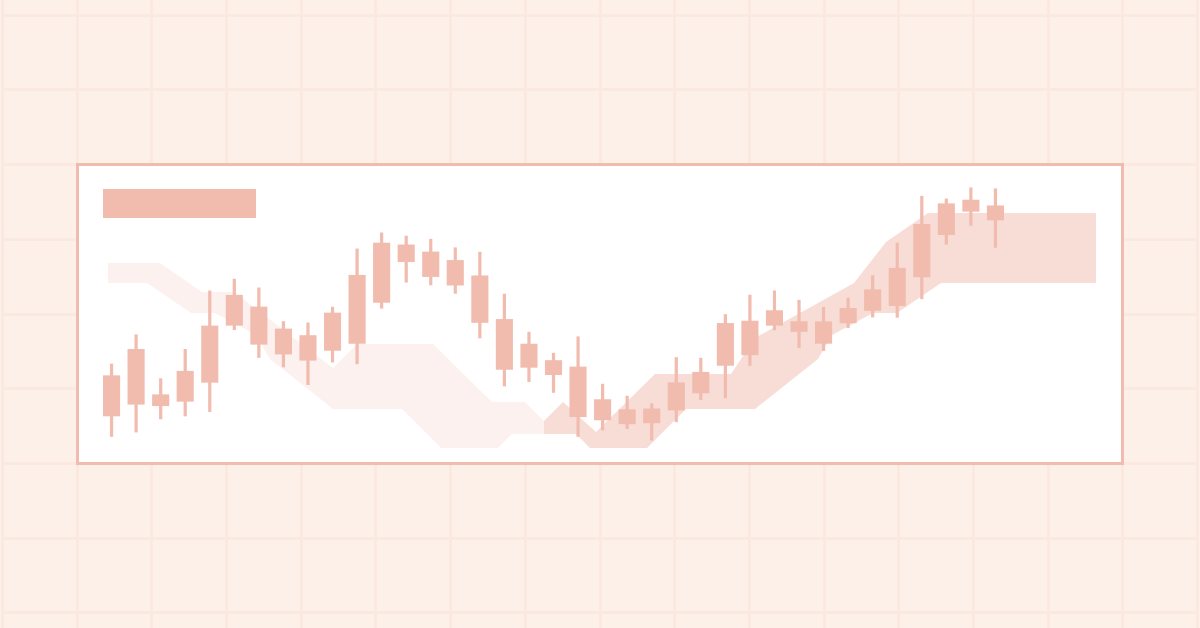
Patterns with Examples (Part I): Multiple Top
This is the first article in a series related to reversal patterns in the framework of algorithmic trading. We will begin with the most interesting pattern family, which originate from the Double Top and Double Bottom patterns.

Better Programmer (Part 02): Stop doing these 5 things to become a successful MQL5 programmer
This is the must read article for anyone wanting to improve their programming career. This article series is aimed at making you the best programmer you can possibly be, no matter how experienced you are. The discussed ideas work for MQL5 programming newbies as well as professionals.

Cluster analysis (Part I): Mastering the slope of indicator lines
Cluster analysis is one of the most important elements of artificial intelligence. In this article, I attempt applying the cluster analysis of the indicator slope to get threshold values for determining whether a market is flat or following a trend.

Analyzing charts using DeMark Sequential and Murray-Gann levels
Thomas DeMark Sequential is good at showing balance changes in the price movement. This is especially evident if we combine its signals with a level indicator, for example, Murray levels. The article is intended mostly for beginners and those who still cannot find their "Grail". I will also display some features of building levels that I have not seen on other forums. So, the article will probably be useful for advanced traders as well... Suggestions and reasonable criticism are welcome...
Timeseries in DoEasy library (part 53): Abstract base indicator class
The article considers creation of an abstract indicator which further will be used as the base class to create objects of library’s standard and custom indicators.

Timeseries in DoEasy library (part 52): Cross-platform nature of multi-period multi-symbol single-buffer standard indicators
In the article, consider creation of multi-symbol multi-period standard indicator Accumulation/Distribution. Slightly improve library classes with respect to indicators so that, the programs developed for outdated platform MetaTrader 4 based on this library could work normally when switching over to MetaTrader 5.
Timeseries in DoEasy library (part 51): Composite multi-period multi-symbol standard indicators
In the article, complete development of objects of multi-period multi-symbol standard indicators. Using Ichimoku Kinko Hyo standard indicator example, analyze creation of compound custom indicators which have auxiliary drawn buffers for displaying data on the chart.

Timeseries in DoEasy library (part 50): Multi-period multi-symbol standard indicators with a shift
In the article, let’s improve library methods for correct display of multi-symbol multi-period standard indicators, which lines are displayed on the current symbol chart with a shift set in the settings. As well, let’s put things in order in methods of work with standard indicators and remove the redundant code to the library area in the final indicator program.

What is a trend and is the market structure based on trend or flat?
Traders often talk about trends and flats but very few of them really understand what a trend/flat really is and even fewer are able to clearly explain these concepts. Discussing these basic terms is often beset by a solid set of prejudices and misconceptions. However, if we want to make profit, we need to understand the mathematical and logical meaning of these concepts. In this article, I will take a closer look at the essence of trend and flat, as well as try to define whether the market structure is based on trend, flat or something else. I will also consider the most optimal strategies for making profit on trend and flat markets.

Timeseries in DoEasy library (part 49): Multi-period multi-symbol multi-buffer standard indicators
In the current article, I will improve the library classes to implement the ability to develop multi-symbol multi-period standard indicators requiring several indicator buffers to display their data.
Timeseries in DoEasy library (part 48): Multi-period multi-symbol indicators on one buffer in a subwindow
The article considers an example of creating multi-symbol multi-period standard indicators using a single indicator buffer for construction and working in the indicator subwindow. I am going to prepare the library classes for working with standard indicators working in the program main window and having more than one buffer for displaying their data.
Timeseries in DoEasy library (part 47): Multi-period multi-symbol standard indicators
In this article, I will start developing the methods of working with standard indicators, which will ultimately allow creating multi-symbol multi-period standard indicators based on library classes. Besides, I will add the "Skipped bars" event to the timeseries classes and eliminate excessive load from the main program code by moving the library preparation functions to CEngine class.
Calculating mathematical expressions (Part 2). Pratt and shunting yard parsers
In this article, we consider the principles of mathematical expression parsing and evaluation using parsers based on operator precedence. We will implement Pratt and shunting-yard parser, byte-code generation and calculations by this code, as well as view how to use indicators as functions in expressions and how to set up trading signals in Expert Advisors based on these indicators.
Timeseries in DoEasy library (part 45): Multi-period indicator buffers
In this article, I will start the improvement of the indicator buffer objects and collection class for working in multi-period and multi-symbol modes. I am going to consider the operation of buffer objects for receiving and displaying data from any timeframe on the current symbol chart.

Manual charting and trading toolkit (Part I). Preparation: structure description and helper class
This is the first article in a series, in which I am going to describe a toolkit which enables manual application of chart graphics by utilizing keyboard shortcuts. It is very convenient: you press one key and a trendline appears, you press another key — this will create a Fibonacci fan with the necessary parameters. It will also be possible to switch timeframes, to rearrange layers or to delete all objects from the chart.
Timeseries in DoEasy library (part 44): Collection class of indicator buffer objects
The article deals with creating a collection class of indicator buffer objects. I am going to test the ability to create and work with any number of buffers for indicators (the maximum number of buffers that can be created in MQL indicators is 512).
Timeseries in DoEasy library (part 43): Classes of indicator buffer objects
The article considers the development of indicator buffer object classes as descendants of the abstract buffer object simplifying declaration and working with indicator buffers, while creating custom indicator programs based on DoEasy library.
Multicurrency monitoring of trading signals (Part 5): Composite signals
In the fifth article related to the creation of a trading signal monitor, we will consider composite signals and will implement the necessary functionality. In earlier versions, we used simple signals, such as RSI, WPR and CCI, and we also introduced the possibility to use custom indicators.
Timeseries in DoEasy library (part 42): Abstract indicator buffer object class
In this article, we start the development of the indicator buffer classes for the DoEasy library. We will create the base class of the abstract buffer which is to be used as a foundation for the development of different class types of indicator buffers.
Multicurrency monitoring of trading signals (Part 4): Enhancing functionality and improving the signal search system
In this part, we expand the trading signal searching and editing system, as well as introduce the possibility to use custom indicators and add program localization. We have previously created a basic system for searching signals, but it was based on a small set of indicators and a simple set of search rules.
Multicurrency monitoring of trading signals (Part 3): Introducing search algorithms
In the previous article, we developed the visual part of the application, as well as the basic interaction of GUI elements. This time we are going to add internal logic and the algorithm of trading signal data preparation, as well us the ability to set up signals, to search them and to visualize them in the monitor.
Forecasting Time Series (Part 2): Least-Square Support-Vector Machine (LS-SVM)
This article deals with the theory and practical application of the algorithm for forecasting time series, based on support-vector method. It also proposes its implementation in MQL and provides test indicators and Expert Advisors. This technology has not been implemented in MQL yet. But first, we have to get to know math for it.
Forecasting Time Series (Part 1): Empirical Mode Decomposition (EMD) Method
This article deals with the theory and practical use of the algorithm for forecasting time series, based on the empirical decomposition mode. It proposes the MQL implementation of this method and presents test indicators and Expert Advisors.
Multicurrency monitoring of trading signals (Part 2): Implementation of the visual part of the application
In the previous article, we created the application framework, which we will use as the basis for all further work. In this part, we will proceed with the development: we will create the visual part of the application and will configure basic interaction of interface elements.
Multicurrency monitoring of trading signals (Part 1): Developing the application structure
In this article, we will discuss the idea of creating a multicurrency monitor of trading signals and will develop a future application structure along with its prototype, as well as create its framework for further operation. The article presents a step-by-step creation of a flexible multicurrency application which will enable the generation of trading signals and which will assist traders in finding the desired signals.
Extending Strategy Builder Functionality
In the previous two articles, we discussed the application of Merrill patterns to various data types. An application was developed to test the presented ideas. In this article, we will continue working with the Strategy Builder, to improve its efficiency and to implement new features and capabilities.
Strategy builder based on Merrill patterns
In the previous article, we considered application of Merrill patterns to various data, such as to a price value on a currency symbol chart and values of standard MetaTrader 5 indicators: ATR, WPR, CCI, RSI, among others. Now, let us try to create a strategy construction set based on Merrill patterns.

Developing Pivot Mean Oscillator: a novel Indicator for the Cumulative Moving Average
This article presents Pivot Mean Oscillator (PMO), an implementation of the cumulative moving average (CMA) as a trading indicator for the MetaTrader platforms. In particular, we first introduce Pivot Mean (PM) as a normalization index for timeseries that computes the fraction between any data point and the CMA. We then build PMO as the difference between the moving averages applied to two PM signals. Some preliminary experiments carried out on the EURUSD symbol to test the efficacy of the proposed indicator are also reported, leaving ample space for further considerations and improvements.

A New Approach to Interpreting Classic and Hidden Divergence. Part II
The article provides a critical examination of regular divergence and efficiency of various indicators. In addition, it contains filtering options for an increased analysis accuracy and features description of non-standard solutions. As a result, we will create a new tool for solving the technical task.

How to visualize multicurrency trading history based on HTML and CSV reports
Since its introduction, MetaTrader 5 provides multicurrency testing options. This possibility is often used by traders. However the function is not universal. The article presents several programs for drawing graphical objects on charts based on HTML and CSV trading history reports. Multicurrency trading can be analyzed in parallel, in several sub-windows, as well as in one window using the dynamic switching command.
MTF indicators as the technical analysis tool
Most of traders agree that the current market state analysis starts with the evaluation of higher chart timeframes. The analysis is performed downwards to lower timeframes until the one, at which deals are performed. This analysis method seems to be a mandatory part of professional approach for successful trading. In this article, we will discuss multi-timeframe indicators and their creation ways, as well as we will provide MQL5 code examples. In addition to the general evaluation of advantages and disadvantages, we will propose a new indicator approach using the MTF mode.

Studying candlestick analysis techniques (part III): Library for pattern operations
The purpose of this article is to create a custom tool, which would enable users to receive and use the entire array of information about patterns discussed earlier. We will create a library of pattern related functions which you will be able to use in your own indicators, trading panels, Expert Advisors, etc.
Scraping bond yield data from the web
Automate the collection of interest rate data to improve the performance of an Expert Advisor.

Studying candlestick analysis techniques (Part II): Auto search for new patterns
In the previous article, we analyzed 14 patterns selected from a large variety of existing candlestick formations. It is impossible to analyze all the patterns one by one, therefore another solution was found. The new system searches and tests new candlestick patterns based on known candlestick types.

Studying candlestick analysis techniques (part I): Checking existing patterns
In this article, we will consider popular candlestick patterns and will try to find out if they are still relevant and effective in today's markets. Candlestick analysis appeared more than 20 years ago and has since become quite popular. Many traders consider Japanese candlesticks the most convenient and easily understandable asset price visualization form.

Practical Use of Kohonen Neural Networks in Algorithmic Trading. Part II. Optimizing and forecasting
Based on universal tools designed for working with Kohonen networks, we construct the system of analyzing and selecting the optimal EA parameters and consider forecasting time series. In Part I, we corrected and improved the publicly available neural network classes, having added necessary algorithms. Now, it is time to apply them to practice.

Gap - a profitable strategy or 50/50?
The article dwells on gaps — significant differences between a close price of a previous timeframe and an open price of the next one, as well as on forecasting a daily bar direction. Applying the GetOpenFileName function by the system DLL is considered as well.

Modeling time series using custom symbols according to specified distribution laws
The article provides an overview of the terminal's capabilities for creating and working with custom symbols, offers options for simulating a trading history using custom symbols, trend and various chart patterns.