
Gap - a profitable strategy or 50/50?
- Introduction
- Which market to choose?
- Working with a group of symbols
- Collecting data
- Applying CGraphic
- Selecting files using the "Select txt file" system dialog
- Statistics on other securities
- Conclusion
Introduction
Here we will deal with checking D1 gaps on stock markets. How often does the market continue to move in the direction of a gap? Does the market reverse after a gap? I will try to answer these questions in the article, while custom CGraphic graphs will be used to visualize the results. Symbol files are selected using the system GetOpenFileName DLL function.
Which market to choose?
The gap interests me exclusively on D1 timeframe.
Obviously, the largest number of gaps can be detected on securities rather than Forex symbols, since securities are traded from morning to evening and not around the clock. I am specifically interested in stocks since a relatively deep history on them is available. Futures, on the other hand, are not very suitable, since they often have a lifetime of 3 or 6 months, which is not enough to study the history on a D1 timeframe.
The TestLoadHistory.mq5 script from the "Data access arrangement" documentation section allows defining the number of current symbol and D1 timeframe bars present on the server. Below is an example of checking the number of D1 bars on ABBV symbol:

Fig. 1. ABBV symbol
The procedure is as follows:
- First, save the script described in the documentation. To achieve this, a new script is created in MetaEditor 5 ("Creating a script"). Let's name it TestLoadHistory.mq5. Now, we need to copy the script text from the documentation and paste it to the TestLoadHistory.mq5 script (the pasted text should replace the entire text in the script).
- Compile the resulting script (after the compilation, the script becomes visible in the Navigator window of the terminal).
- Launch the script in MetaTrader 5. Since the check was started for the ABBV symbol, we need to prepare the chart: open ABBV symbol chart and replace the timeframe with D1. Take the script from the Navigator window and launch it on ABBV chart. In the script parameters, set ABBV as a symbol name, select D1 timeframe and specify the year of 1970 as a date:

Fig. 2. Running the TestLoadHistory.mq5 script
Script operation results:
TestLoadHistory (ABBV,D1)       Start loadABBV,Dailyfrom1970.03.16 00:00:00
TestLoadHistory (ABBV,D1)       Loaded OK
TestLoadHistory (ABBV,D1)       First date 2015.09.18 00:00:00 - 758 bars
— history starts in 2015 and features 758 D1 bars. This number is sufficient for analysis.
Working with a group of symbols
To analyze and calculate any criteria, we need to compare symbols from one symbol group. As a rule, symbols in MetaTrader 5 terminal are already divided into groups (right click in the Market Watch window and select Symbols or press Ctrl + U):
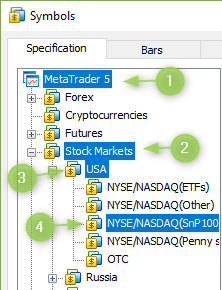
Fig. 3. NASDAQ(SnP100) group symbols
NASDAQ(SnP100) group is selected in the figure. This group includes ABBV symbol. The most convenient way to work with a group of symbols is to ensure that the script is launched on a symbol from this group. To iterate over every group, we need to manually open a symbol chart from each group and launch the Symbols on symbol tree.mq5 utility script — this script collects all group symbols (symbol names) into a separate file.
The Symbols on symbol tree.mq5 script works according to the following algorithm: get a path in the SYMBOL_PATH symbol tree; retrieve the final group of symbols from the obtained path (here it is NASDAQ(SnP100) group); select all symbols from this group and save selected symbols to the file. The file name is a path in a symbol tree where all "/" and "\" characters are replaced with "_" (replacement is performed by the script automatically, the file name is generated automatically as well). After replacing symbols, the following name is generated for the NASDAQ(SnP100) symbol group: "Stock Markets_USA_NYSE_NASDAQ(SnP100)_.txt".
Why do we need to place each group into a separate file? Subsequently, it will be possible to simply read symbol names from group files without enumerating over all symbols and analyze gap direction. Generally, the Symbols on symbol tree.mq5 utility script removes the routine of manually selecting symbols from a specific symbol group.
Symbols on symbol tree.mq5 script
Let's dwell on the script operation.
NOTE: Only the text "Everything is fine. There are no errors" in the Experts tab guarantees that the script's work has been successful, and the obtained file with symbols can be used for further work!
To shorten the code of file operations, the CFileTxt class is included, and the work with the text file is performed by m_file_txt — CFileTxt class object. The script performs its work in seven steps:
//+------------------------------------------------------------------+
//|                                       Symbols on symbol tree.mq5 |
//|                              Copyright © 2018, Vladimir Karputov |
//|                                           http://wmua.ru/slesar/ |
//+------------------------------------------------------------------+
#property copyright "Copyright © 2018, Vladimir Karputov"
#property link      "http://wmua.ru/slesar/"
#property version   "1.000"
//---
#include <Files\FileTxt.mqh>
CFileTxt       m_file_txt;       // file txt object
//---
string   m_file_name="";         // File name
//+------------------------------------------------------------------+
//| Script program start function                                    |
//+------------------------------------------------------------------+
void OnStart()
  {
//--- STEP 1
   string current_path="";
   if(!SymbolInfoString(Symbol(),SYMBOL_PATH,current_path))
     {
      Print("ERROR: SYMBOL_PATH");
      return;
     }
//--- STEP 2
   string sep_="\\";                 // A separator as a character
   ushort u_sep_;                    // The code of the separator character
   string result_[];                 // An array to get strings
//--- Get the separator code
   u_sep_=StringGetCharacter(sep_,0);
//--- Split the string to substrings
   int k_=StringSplit(current_path,u_sep_,result_);
//--- STEP 3
//--- Now output all obtained strings
   if(k_>0)
     {
      current_path="";
      for(int i=0;i<k_-1;i++)
         current_path=current_path+result_[i]+sep_;
     }
//--- STEP 4
   string symbols_array[];
   int symbols_total=SymbolsTotal(false);
   for(int i=0;i<symbols_total;i++)
     {
      string symbol_name=SymbolName(i,false);
      string symbol_path="";
      if(!SymbolInfoString(symbol_name,SYMBOL_PATH,symbol_path))
         continue;
      if(StringFind(symbol_path,current_path,0)==-1)
         continue;

      int size=ArraySize(symbols_array);
      ArrayResize(symbols_array,size+1,10);
      symbols_array[size]=symbol_name;
     }
//--- STEP 5
   int size=ArraySize(symbols_array);
   if(size==0)
     {
      PrintFormat("ERROR: On path \"%s\" %d symbols",current_path,size);
      return;
     }
   PrintFormat("On path \"%s\" %d symbols",current_path,size);
//--- STEP 6
   m_file_name=current_path;
   StringReplace(m_file_name,"\\","_");
   StringReplace(m_file_name,"/","_");
   if(m_file_txt.Open("5220\\"+m_file_name+".txt",FILE_WRITE|FILE_COMMON)==INVALID_HANDLE)
     {
      PrintFormat("ERROR: \"%s\" file in the Data Folder Common folder is not created",m_file_name);
      return;
     }
//--- STEP 7
   for(int i=0;i<size;i++)
      m_file_txt.WriteString(symbols_array[i]+"\r\n");
   m_file_txt.Close();
   Print("Everything is fine. There are no errors");
//---
  }
//+------------------------------------------------------------------+
Script operation algorithm:
- STEP 1: SYMBOL_PATH (path in the symbols tree) is defined for the current symbol;
- STEP 2: the obtained path is divided into substrings with the "\" separator;
- STEP 3: re-assemble the current path without the last substring, since it contains the symbol name;
- STEP 4: loop through all available symbols; if the symbol's path in the symbols tree matches the current one, select the symbol name and add it to the detected symbols array;
- STEP 5: check the size of the detected symbols array;
- STEP 6: generate the file name (remove "/" and "\" characters from the name, generate the file);
- STEP 7: write the array of detected symbols to the file and close it.
Pay attention to STEP 6: the file is created in the folder 5220 within the common files directory (the FILE_COMMON flag is used).
Also, make sure the script operation completes without errors. The following message should appear in the Experts tab: "Everything is fine. There are no errors. Create file:". The file name is displayed in the next line — copy it and paste into the "Getting gap statistics ..." script. Successful file generation is displayed below:
On path "Stock Markets\USA\NYSE/NASDAQ(SnP100)\" 100 symbols
Everything is fine. There are no errors. Create file:
Stock Markets_USA_NYSE_NASDAQ(SnP100)_
As a result, we obtain the file (here it is Stock Markets_USA_NYSE_NASDAQ(SnP100)_) with one symbol per each new line. The first five lines of the file:
AAPL
ABBV
ABT
ACN
AGN
Collecting data
History OHLC data by symbols and statistics calculation are performed by the main script Getting gap statistics.mq5. The SGapStatistics structure is filled for every symbol:
   struct SGapStatistics
     {
      string            name;                // symbol name
      int               d1_total;            // total number of D1 bars
      int               gap_total;           // total number of gaps
      int               gap_confirmed;       // gap was confirmed
     };
name — symbol name
d1_total — number of D1 bars by symbol
gap_total — number of detected gaps
gap_confirmed — number of confirmed gaps (for example, a day opens with an upward gap and closed as a bullish bar)
The most suitable function for obtaining OHLC prices per each symbol is CopyRates. We will use the third form — by start and end dates of the required time interval. As a start time, we take the current time of the TimeTradeServer trade server plus one day, while the end date is January 1, 1970.
Now, all we have to do is define how to handle the error ("-1" is returned as the request result) or how to determine that not all data is returned as a result of the request (for instance, not all data have been uploaded from the server yet). We can go a simple way (request — pause N — seconds — new request) or the right one. The right solution is based on improving the TestLoadHistory.mq5 script from the "Data access arrangement" documentation section.
Script request execution results are listed below:
   switch(res)
     {
      case -1 : Print("Unknown symbol",InpLoadedSymbol);                        break;
      case -2 : Print("Number of requested bars exceeds the one that can be displayed on chart"); break;
      case -3 : Print("Execution interrupted by user");                    break;
      case -4 : Print("Indicator cannot upload own data");          break;
      case -5 : Print("Upload failed");                              break;
      case  0 : Print("All data uploaded");                                      break;
      case  1 : Print("Present timeseries data sufficient");               break;
      case  2 : Print("Timeseries made of existing terminal data");         break;
      default : Print("Execution result not defined");
     }
— which means the execution result is less than zero — this is an error. In this case, the operation algorithm is as follows: open the symbol file and make a request per each symbol. Sum up negative results. If there is at least one negative result, display the request issue message. If this happens, a user needs to relaunch the script once again (the history will probably have been uploaded or built by that moment). If there are no errors, get OHLC data and count the number of gaps.
Getting gap statistics.mq5 script
This script displays the gap statistics in the Experts tab of the terminal. Further on, we will use the "gap confirmation" wording. A confirmed gap means that the daily bar is closed in the direction of the gap, while unconfirmed gap means the daily bar is closed in the direction opposite to the gap:
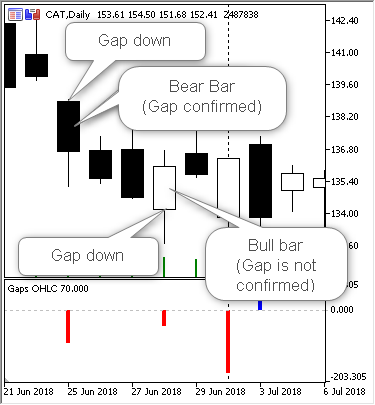
Fig. 4. Confirmed and unconfirmed gaps
The script features a single "File name" parameter — a file name that was formed by the Symbols on symbol tree.mq5 auxiliary script (as you remember, this file is created in the folder 5220 of the common directory). The file name is specified without specifying directory and extension, for example, like this:

Fig. 5. The input parameter of the "Getting gap statistics" script
Thus, we need to make several steps to gain statistics:
- Select a symbol group the gap calculation is to be performed for
- Choose a symbol from the selected group and open its chart
- Place the Symbols on symbol tree.mq5 script on the chart — the file with all symbols from the selected symbol group is created as a result. Make sure there are no errors during the script operation. The following message should appear in the Experts tab: "Everything is fine. There are no errors"
- Place the Getting gap statistics.mq5 script on the chart
As a result, the Experts gap is to contain the following statistics on the number of gaps. The first five symbols:
      [name] [d1_total] [gap_total] [gap_confirmed]
[ 0] "AAPL"        7238        3948            1640
[ 1] "ABBV"         759         744             364
[ 2] "ABT"          762         734             374
[ 3] "ACN"          759         746             388
[ 4] "AGN"          761         754             385
Applying CGraphic
Displaying the entire data in the Experts tab is not very informative, therefore the Getting gap statistics CGraphic.mq5 script will use CGraphic custom graphs. The script has the following parameters:
- File name — file name with symbols (this file should be created in advance using the "Symbols on symbol tree.mq5" utility script)
- Log CheckLoadHistory — hide/display results of symbol history upload to the Experts tab
- Log Statistics — hide/display gap statistics in the Experts tab
Operation result — percentage graph of confirmed gaps:
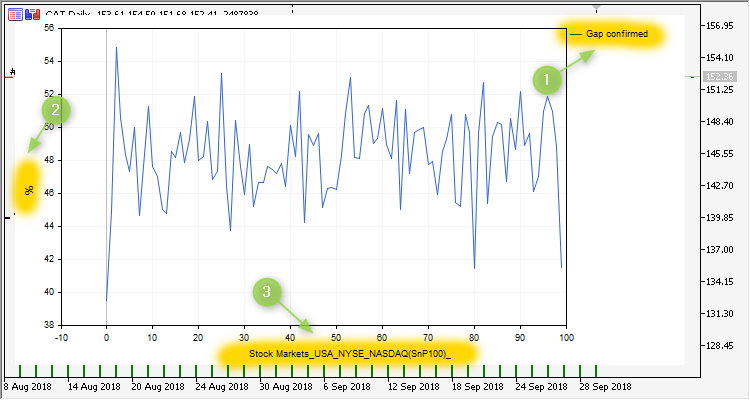
Fig. 6. Getting gap statistics CGraphic.mq5 script operation result
Graph numbers:
- 1 — name of the confirmed gaps line
- 2 — percentage scale
- 3 — name of the file symbols were taken from
The graph makes clear that gap values fluctuate around 50% plus minus 6%, although there are three spikes less than 42%. These three spikes with gaps confirmation less than 42% mean that a daily bar will move against the gap on three symbols with the probability of 58%.
Now, we can check another group of symbols — Stock Markets\RussiaMICEX20. Getting gap statistics CGraphic.mq5 script operation results for Stock Markets\RussiaMICEX20:
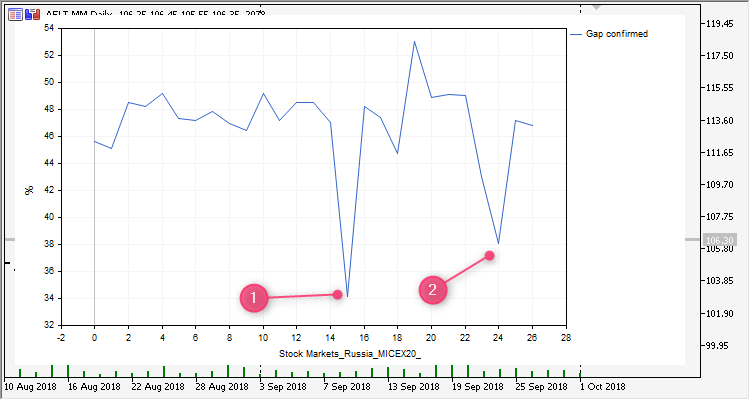
Fig. 7. Gap statistics for Stock Markets\RussiaMICEX20 group
There are two anomalous spikes here. However, we cannot link the image and the symbol in the current version. That is why we need to slightly improve the script.
Getting gap statistics CGraphic 2.mq5 script
Changes: in the verison 2.0, the Experts tab will display statistics on confirmed gaps in %. Thus, when Log Statistics is enabled, two anomalous symbols can easily be detected for Stock Markets\RussiaMICEX20 group:
          [name] [d1_total] [gap_total] [gap_confirmed] [confirmed_per]
***
[14] "NVTK.MM"          757         737             347           47.08
[15] "PIKK.MM"          886         822             282           34.31
[16] "ROSN.MM"          763         746             360           48.26
[17] "RSTI.MM"          775         753             357           47.41
[18] "RTKM.MM"          753         723             324           44.81
[19] "SBER.MM"          762         754             400           53.05
[20] "SBER_p.MM"        762         748             366           48.93
[21] "SNGS.MM"          762         733             360           49.11
[22] "TATN.MM"          765         754             370           49.07
[23] "SNGS_p.MM"        751         708             305           43.08
[24] "URKA.MM"          765         706             269           38.10
[25] "VTBR.MM"          763         743             351           47.24
[26] "RASP.MM"          778         756             354           46.83
For PIKK.MM and URKA.MM symbols, 34% and 38% confirmed gaps mean that a daily bar will be closed against the gap with the probability of 66% and 62% accordingly on these symbols.
Limiting the number of symbols (instruments) in the file
When analyzing various symbol groups, I found the groups containing more than a thousand of symbols. Working with such a large set is very inconvenient: it takes quite a long time to add such a huge number of symbols to the Market Watch window, while the final graph becomes unreadable — too much data that is very closely located to each other.
Therefore, I decided to upgrade the Symbols on symbol tree.mq5 script and wrote Symbols on symbol tree 2.mq5. In this version, the maximum number of symbols in the file does not exceed 200, and the part number is added to the file name. For example, Stock Markets\USA\NYSE/NASDAQ(SnP100)\ symbol group contains 100 symbols meaning there is only one part. The file name looks as follows: Stock Markets_USA_NYSE_NASDAQ(SnP100)_part_0.txt.
Selecting files using the "Select txt file" system dialog
After working with the scripts from this article, I realized that adding the file name to the Getting gap statistics CGraphic 2.mq5 script input parameters is too inconvenient. We have to perform several actions: open the common folder of all terminals, copy the file name and paste the copied file name to the script.
Therefore, the file selection is performed using the GetOpenFileName system DLL function. To achieve this, I include the GetOpenFileNameW.mqh file. The OpenFileName function from this file returns the full path of the selected *.txt file. For example, the path may be as follows: "C:\Users\barab\AppData\Roaming\MetaQuotes\Terminal\Common\Files\5220\Stock Markets_USA_NYSE_NASDAQ(SnP100)_part_0.txt". Now we need to retrieve the file name from it.
The Getting gap statistics CGraphic 3.mq5 script uses the GetOpenFileName DLL function:
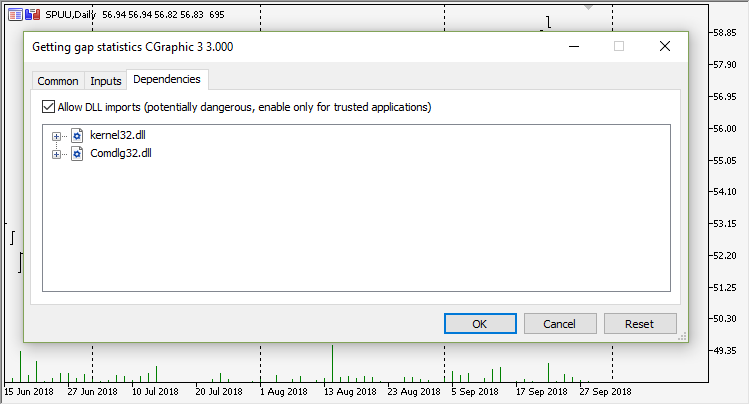
Fig. 8. Request to allow DLL when launching the Getting gap statistics CGraphic 3.mq5 script
Here is how the file is selected using the "Select txt file" system dialog:
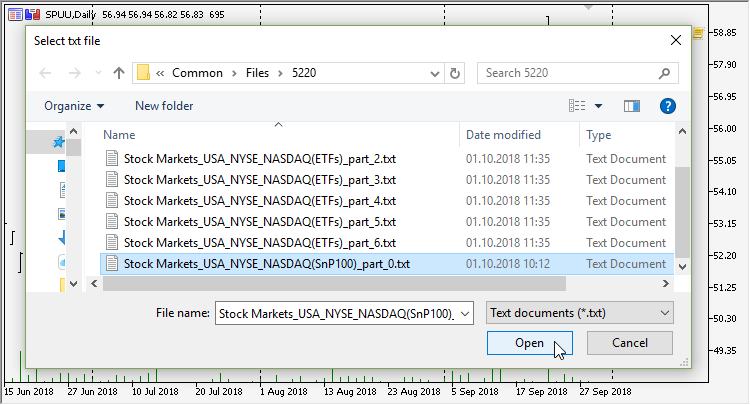
Fig. 9. Selecting the file
Statistics on other securities
Now we can collect statistics on gaps for other symbol groups.
Stock Markets\USA\NYSE\NASDAQ(ETFs) group
Group symbols are divided into seven files:
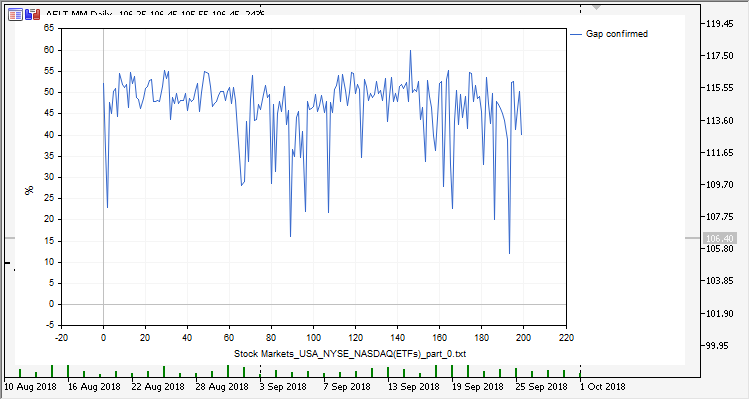
Fig. 10. Stock Markets\USA\NYSE\NASDAQ(ETFs) group, part 0
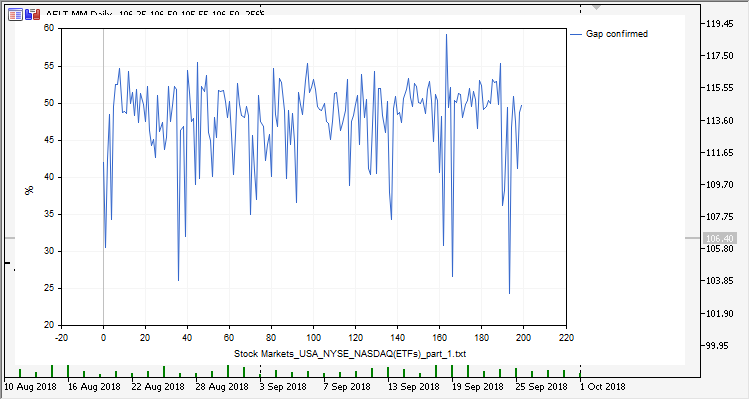
Fig. 11. Stock Markets\USA\NYSE\NASDAQ(ETFs) group, part 1
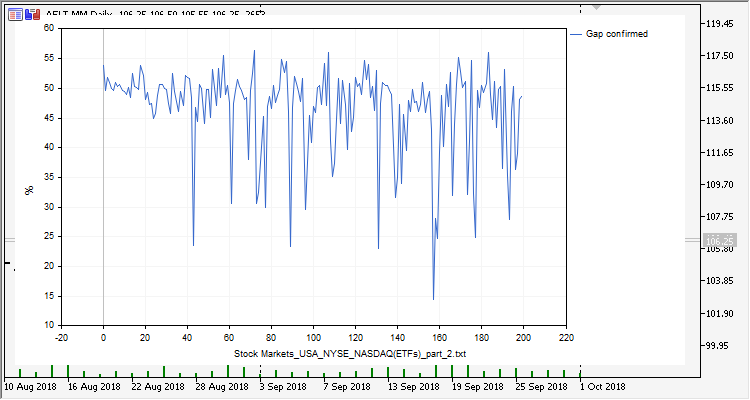
Fig. 12. Stock Markets\USA\NYSE\NASDAQ(ETFs) group, part 2
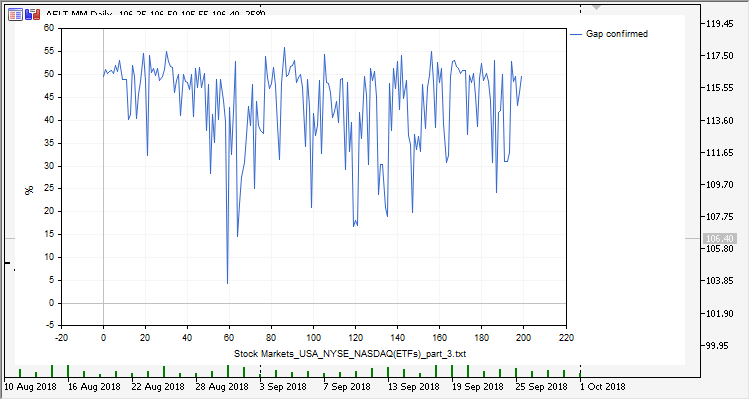
Fig. 13. Stock Markets\USA\NYSE\NASDAQ(ETFs) group, part 3
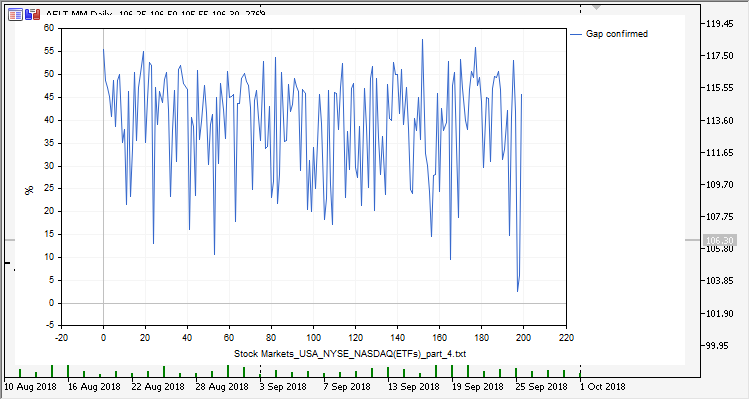
Fig. 14. Stock Markets\USA\NYSE\NASDAQ(ETFs) group, part 4
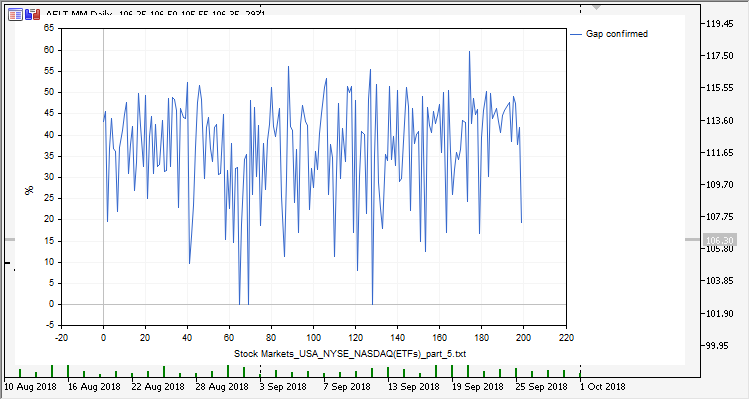
Fig. 15. Stock Markets\USA\NYSE\NASDAQ(ETFs) group, part 5
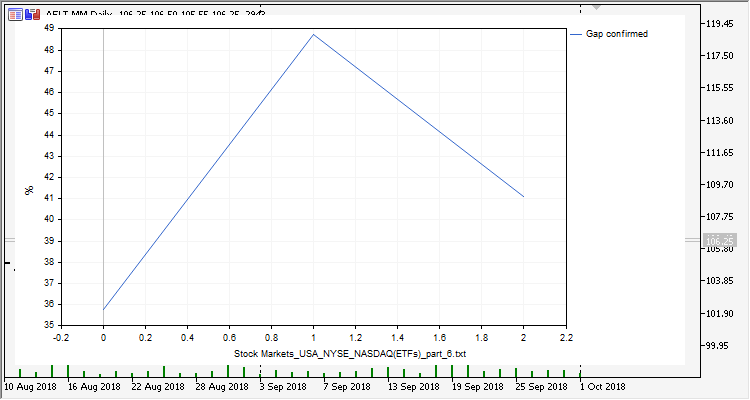
Fig. 16. Stock Markets\USA\NYSE\NASDAQ(ETFs) group, part 6
Stock Markets\United Kngdom\LSE Int. (ADR/GDR)\ group
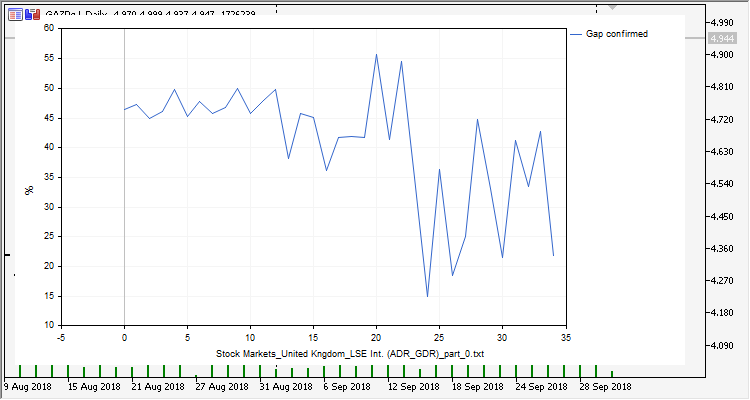
Fig. 17. Stock Markets\United Kngdom\LSE Int. (ADR/GDR)\ group
Stock Markets\United Kngdom\LSE (FTSE350)\ group
The group features 350 symbols, therefore symbols are divided into two files.
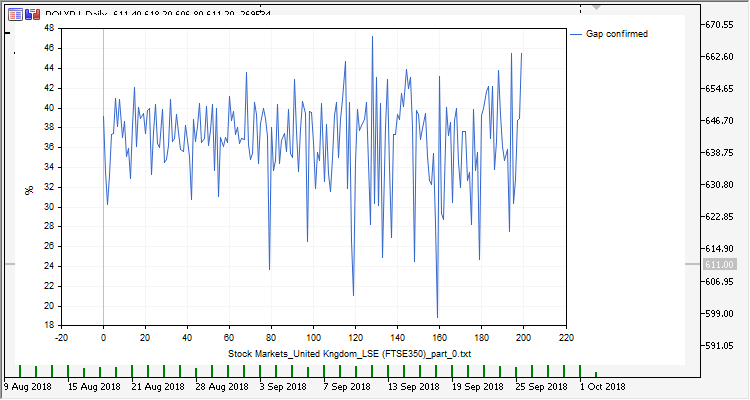
Fig. 18. Stock Markets\United Kngdom\LSE (FTSE350)\ group, part 0
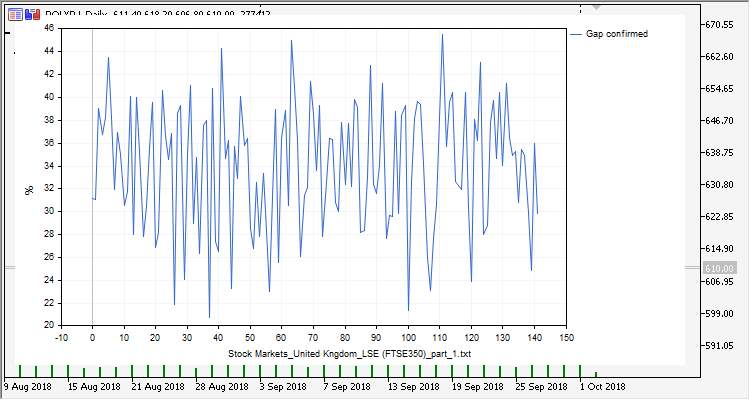
Fig. 19. Stock Markets\United Kngdom\LSE (FTSE350)\ group, part 1
Stock Markets\Germany\XETRA (IBIS)\Dax100\ group
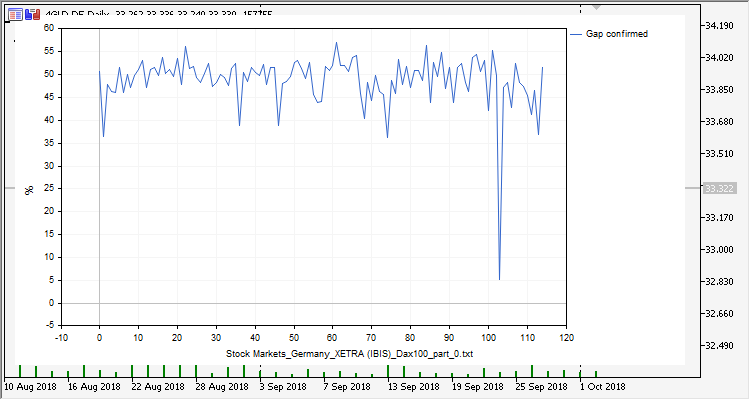
Fig. 20. Stock Markets\Germany\XETRA (IBIS)\Dax100\ group
Stock Markets\France\Eurnext (CAC40)\ group
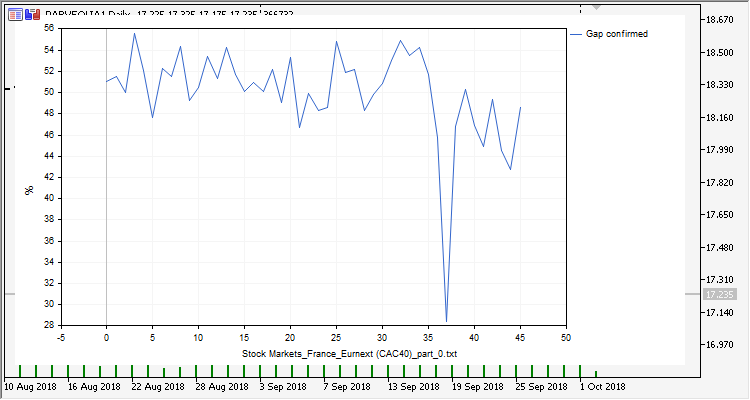
Fig. 21. Stock Markets\France\Eurnext (CAC40)\ group
Conclusion
When analyzing several securities markets, I saw that after a gap, the probabilities of a continued movement and a reversal are close to 50%, which means trying to catch a gap has the 50/50 success rate. At the same time, there are securities with the probabilities (of both continuation and reversal) considerably higher than 65%. These securities can be used to trade gaps.
The archive with the scripts described in the article is attached below:
| Script name | Description |
|---|---|
| Symbols on symbol tree.mq5 | Utility script. The script defines a group in the symbol tree and saves all symbols from this group to the file (common directory, folder 5220) |
| Symbols on symbol tree 2.mq5 | Utility script. The script defines a group in the symbol tree and saves all symbols from this group to the file (common directory, folder 5220). It also divides the symbol group into files of 200 symbols each. |
| Getting gap statistics.mq5 | The script uploads symbols from the file that created the utility script, and displays gap statistics on the Experts tab |
| Getting gap statistics CGraphic.mq5 | The script uploads symbols from the file that created the utility script, and displays gap statistics as a graph. Custom CGraphic graphs are used |
| Getting gap statistics CGraphic 2.mq5 | The script uploads symbols from the file that created the utility script, and displays gap statistics as a graph. Custom CGraphic graphs are used. Statistics in % is displayed on the Experts tab as well. |
| Getting gap statistics CGraphic 3.mq5 | The script uploads symbols from the file that created the utility script, and displays gap statistics as a graph. Custom CGraphic graphs are used. Statistics in % is displayed on the Experts tab as well. "Select txt file" system dialog is used to select a symbol file |
| GetOpenFileNameW.mqh | Include file that enables working with the "Select txt file" system dialog |
Translated from Russian by MetaQuotes Ltd.
Original article: https://www.mql5.com/ru/articles/5220
 Reversal patterns: Testing the Double top/bottom pattern
 Using limit orders instead of Take Profit without changing the EA's original code
 Movement continuation model - searching on the chart and execution statistics
- Free trading apps
- Over 8,000 signals for copying
- Economic news for exploring financial markets
You agree to website policy and terms of use
Iintressan.
Please only post in English.
I have used the site's translation function to edit your post