
Extending Strategy Builder Functionality

Table of Contents
- Introduction
- Overview of Additions
- New Feature Implementation Stages
- Strategy Builder Testing and Demonstration
- Conclusion
Introduction
In the first part of the article series, we analyzed Merrill patterns and applied them to different data arrays, such as the price and price-based oscillators ATR, CCI and WPR, among others. The purpose of the article was to explore and evaluate the prospects of using the specified patterns on forex and other markets. The second part was devoted to the creation of a Strategy Builder to assemble simple strategies using the previously discussed patterns. In the third part, we will expand the strategy creation and testing functionality. We will add the possibility to work with lots in addition to points, as well the functionality for viewing testing results.
Overview of Additions
Before considering the new features, let us recall the previous part. Results of all tests were displayed in a brief summary report, while the
report was presented as profit/loss on points of the specific considered financial instrument. However, this did not allow the complete
evaluation of all potential capabilities of a strategy. Therefore, the major goal is to expand tester features and then to expand the
trading report parameters.
We will stick to the following plan when implementing the improvements:
- Initial deposit in the account currency.
- Profit calculation options: "In points" or "In deposit currency".
- If "In deposit currency" is selected, two other input fields appear: "Lot Type" and "Lot Size".
- Lot Type can be Constant or based on Balance.
- Lot Size. Available for the Constant lot type.
The following changes will be implemented in the trading report:
- Total Net Profit. The parameter is only available for the profit type "In deposit currency".
- Balance Drawdown Absolute. The parameter is only available for the profit type "In deposit currency".
- Balance Drawdown Max. The parameter is only available for the profit type "In deposit currency".
- In addition to the number of short and long trades, the percentage of winning trades of both types is displayed.
- Strategy profitability. The ratio of total profit to total loss.
- Recovery factor. The parameter is only available for the profit type "In deposit currency".
You can read more about the new parameters in the Testing Report section of the MetaTrader 5 Help. The prototype of the above features is shown in fig.1.
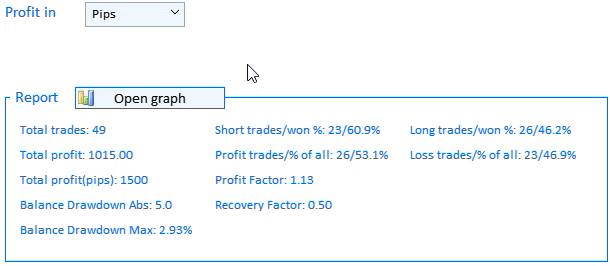
Fig.1 Prototype of new testing tools.
Another new features is the possibility to visually view the testing result of any strategy. It means you can view the testing results graph. We will add the "Open graph" button (shown in fig.1) to the Report section of our app.
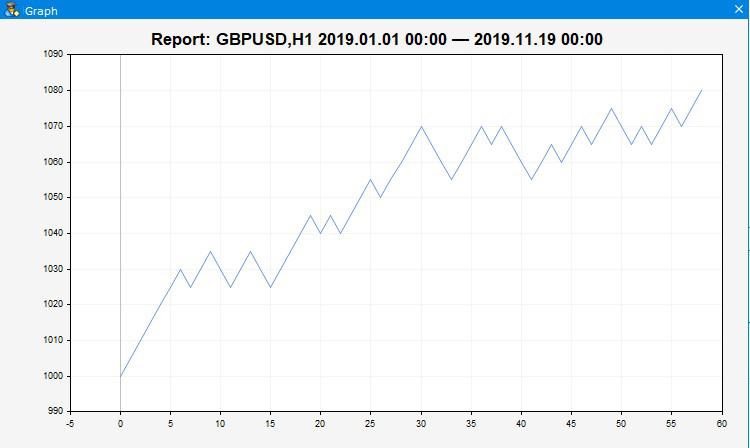
Fig.2 Graph appearance.
As seen in fig.2, the deposit movement nature and trade results can be visually
evaluated on the chart. For convenience, the title displays the tested symbol, its timeframe, and the time interval in which testing is
performed.
New Feature Implementation Stages
Let us define the main elements and implementing methods, similarly to what we did when developing the Strategy Builder from scratch. Two methods have been added to the main method creating the CreateGUI() interface. Let's view these methods and the additions to previously existing method.
//+------------------------------------------------------------------+
//| Creates the graphical interface of the program                   |
//+------------------------------------------------------------------+
bool CProgram::CreateGUI(void)
{
//--- Create a panel
   if(!CreateWindow("Merrill Constructor"))
      return(false);
//--- Create a dialog window
   if(!CreateDateSetting())
      return(false);
//--- Create a chart window
   if(!CreateGraphWindow())
      return(false);
//--- Create a load window
   if(!CreateLoading())
      return(false);
//--- Finish the creation of GUI
   CWndEvents::CompletedGUI();
   return(true);
}
Let's view the changes in the main window creation method CreateWindow(): new interface elements have been added to implement new testing instruments shown in fig.1.
//---- CONSTRUCTOR tab
....
//---
   if(!CreateProfitType(int(0.35*(m_window[0].XSize()-150)-120),50+35*6+ygap))
      return(false);
   if(!CreateLotType(int(0.6*(m_window[0].XSize()-150)-120),50+35*6+ygap))
      return(false);
   if(!CreateBaseLotValue(int(0.85*(m_window[0].XSize()-150)-120),50+35*6+ygap))
      return(false);
   if(!CreateInitialDeposit(int(0.35*(m_window[0].XSize()-150)-120),50+35*7+ygap))
      return(false);
//---
   if(!CreateReportFrame(m_frame[2],int(0.35*(m_window[0].XSize()-150)-120),110+35*7+ygap))
      return(false);
//--- Graph opening button
   if(!CreateIconButton(int(0.35*(m_window[0].XSize()-150)-50),100+35*7+ygap))
      return(false);
//--- Report lines
   for(int i=0; i<11; i++)
   {
      if(i<5)
         if(!CreateTextLabel(m_report_text[i],int(0.37*(m_window[0].XSize()-150)-120),380+25*i+ygap,"",0))
            return(false);
      if(i>=5 && i<9)
         if(!CreateTextLabel(m_report_text[i],int(0.63*(m_window[0].XSize()-150)-120),380+25*(i-5)+ygap,"",0))
            return(false);
      if(i>=9)
         if(!CreateTextLabel(m_report_text[i],int(0.89*(m_window[0].XSize()-150)-120),380+25*(i-9)+ygap,"",0))
            return(false);
      m_report_text[i].IsCenterText(false);
      m_report_text[i].FontSize(10);
   }
....
Visual changes were implemented only in the Constructor tab. The full tab implementation code is available in the attachments and in the previous article, while here only new methods are shown. Let's consider each of them.
CreateProfitType(). The method crates a drop-down list with the profit type used in testing: Deposit currency or Points.
//+------------------------------------------------------------------+
//|                                                                  |
//+------------------------------------------------------------------+
bool CProgram::CreateProfitType(const int x_gap,const int y_gap)
{
//--- Pass the object to the panel
   m_profit_type.MainPointer(m_tabs1);
//--- Attach to tab
   m_tabs1.AddToElementsArray(0,m_profit_type);
//--- Array of the item values in the list view
   string pattern_names[2]=
   {
      "Pips","Currency"
   };
//--- Set properties before creation
   m_profit_type.XSize(200);
   m_profit_type.YSize(25);
   m_profit_type.ItemsTotal(2);
   m_profit_type.FontSize(12);
   m_profit_type.LabelColor(C'0,100,255');
   m_profit_type.GetButtonPointer().FontSize(10);
   m_profit_type.GetButtonPointer().XGap(80);
   m_profit_type.GetButtonPointer().XSize(100);
   m_profit_type.GetButtonPointer().BackColor(clrAliceBlue);
   m_profit_type.GetListViewPointer().FontSize(10);
   m_profit_type.GetListViewPointer().YSize(44);
//--- Save the item values in the combobox list view
   for(int i=0; i<2; i++)
      m_profit_type.SetValue(i,pattern_names[i]);
//--- Get the list view pointer
   CListView *lv=m_profit_type.GetListViewPointer();
//--- Set the list view properties
   lv.LightsHover(true);
   m_profit_type.SelectItem(1);
//--- Create a control
   if(!m_profit_type.CreateComboBox("Profit Type",x_gap,y_gap))
      return(false);
//--- Add the object to the common array of object groups
   CWndContainer::AddToElementsArray(0,m_profit_type);
   return(true);
}
CreateLotType(). The method creates a drop-down lost with the lot type: Constant or Balance dependent.
//+------------------------------------------------------------------+
//|                                                                  |
//+------------------------------------------------------------------+
bool CProgram::CreateLotType(const int x_gap,const int y_gap)
{
//--- Pass the object to the panel
   m_lot_type.MainPointer(m_tabs1);
//--- Attach to tab
   m_tabs1.AddToElementsArray(0,m_lot_type);
//--- Array of the item values in the list view
   string pattern_names[2]=
   {
      "Balance","Constant"
   };
//--- Set properties before creation
   m_lot_type.XSize(200);
   m_lot_type.YSize(25);
   m_lot_type.ItemsTotal(2);
   m_lot_type.FontSize(12);
   m_lot_type.LabelColor(C'0,100,255');
   m_lot_type.GetButtonPointer().FontSize(10);
   m_lot_type.GetButtonPointer().XGap(65);
   m_lot_type.GetButtonPointer().XSize(100);
   m_lot_type.GetButtonPointer().BackColor(clrAliceBlue);
   m_lot_type.GetListViewPointer().FontSize(10);
   m_lot_type.GetListViewPointer().YSize(44);
//--- Save the item values in the combobox list view
   for(int i=0; i<2; i++)
      m_lot_type.SetValue(i,pattern_names[i]);
//--- Get the list view pointer
   CListView *lv=m_lot_type.GetListViewPointer();
//--- Set the list view properties
   lv.LightsHover(true);
   m_lot_type.SelectItem(1);
//--- Create a control
   if(!m_lot_type.CreateComboBox("Lot Type",x_gap,y_gap))
      return(false);
//--- Add the object to the common array of object groups
   CWndContainer::AddToElementsArray(0,m_lot_type);
   return(true);
}
CreateBaseLotValue(). The method creates the lot value input field.
/+------------------------------------------------------------------+
//|                                                                  |
//+------------------------------------------------------------------+
bool CProgram::CreateBaseLotValue(const int x_gap,const int y_gap)
{
//--- Save the pointer to the main control
   m_base_lot.MainPointer(m_tabs1);
//--- Attach to tab
   m_tabs1.AddToElementsArray(0,m_base_lot);
//--- Properties
   m_base_lot.XSize(210);
   m_base_lot.YSize(24);
   m_base_lot.LabelColor(C'0,100,255');
   m_base_lot.FontSize(12);
   m_base_lot.MaxValue(SymbolInfoDouble(Symbol(),SYMBOL_VOLUME_MAX));
   m_base_lot.MinValue(SymbolInfoDouble(Symbol(),SYMBOL_VOLUME_MIN));
   m_base_lot.StepValue(SymbolInfoDouble(Symbol(),SYMBOL_VOLUME_STEP));
   m_base_lot.SetDigits(2);
   m_base_lot.SpinEditMode(true);
   m_base_lot.GetTextBoxPointer().AutoSelectionMode(true);
   m_base_lot.GetTextBoxPointer().XGap(100);
//--- Create a control
   if(!m_base_lot.CreateTextEdit("Base Lot Size",x_gap,y_gap))
      return(false);
   m_base_lot.SetValue((string)SymbolInfoDouble(Symbol(),SYMBOL_VOLUME_MIN));
//--- Add the object to the common array of object groups
   CWndContainer::AddToElementsArray(0,m_base_lot);
   return(true);
}
CreateInitialDeposit(). Creates an input field for the initial deposit when testing in the Profit — Currency mode.
//+------------------------------------------------------------------+
//|                                                                  |
//+------------------------------------------------------------------+
bool CProgram::CreateInitialDeposit(const int x_gap,const int y_gap)
{
//--- Save the pointer to the main control
   m_init_deposit.MainPointer(m_tabs1);
//--- Attach to tab
   m_tabs1.AddToElementsArray(0,m_init_deposit);
//--- Properties
   m_init_deposit.XSize(210);
   m_init_deposit.YSize(24);
   m_init_deposit.LabelColor(C'0,100,255');
   m_init_deposit.FontSize(12);
   m_init_deposit.MinValue(10);
   m_init_deposit.SetDigits(2);
   m_init_deposit.GetTextBoxPointer().AutoSelectionMode(true);
   m_init_deposit.GetTextBoxPointer().XGap(125);
//--- Create a control
   if(!m_init_deposit.CreateTextEdit("Initial Deposit",x_gap,y_gap))
      return(false);
   m_init_deposit.SetValue((string)1000);
//--- Add the object to the common array of object groups
   CWndContainer::AddToElementsArray(0,m_init_deposit);
   return(true);
}
CreateIconButton(). Creates a button, a click on which opens the chart window.
//+------------------------------------------------------------------+
//| Creates a button with an image                                   |
//+------------------------------------------------------------------+
#resource "\\Images\\EasyAndFastGUI\\Icons\\bmp16\\bar_chart.bmp"
#resource "\\Images\\EasyAndFastGUI\\Icons\\bmp16\\bar_chart_gray.bmp"
//---
bool CProgram::CreateIconButton(const int x_gap,const int y_gap)
{
//--- Save the pointer to the main control
   m_graph_button.MainPointer(m_tabs1);
//--- Attach to tab
   m_tabs1.AddToElementsArray(0,m_graph_button);
//--- Properties
   m_graph_button.XSize(150);
   m_graph_button.YSize(22);
   m_graph_button.FontSize(11);
   m_graph_button.IconXGap(3);
   m_graph_button.IconYGap(3);
   m_graph_button.IsHighlighted(false);
   m_graph_button.IsCenterText(true);
   m_graph_button.IconFile("Images\\EasyAndFastGUI\\Icons\\bmp16\\bar_chart.bmp");
   m_graph_button.IconFileLocked("Images\\EasyAndFastGUI\\Icons\\bmp16\\bar_chart_gray.bmp");
   m_graph_button.IconFilePressed("Images\\EasyAndFastGUI\\Icons\\bmp16\\bar_chart.bmp");
   m_graph_button.IconFilePressedLocked("Images\\EasyAndFastGUI\\Icons\\bmp16\\bar_chart_gray.bmp");
   m_graph_button.BorderColor(C'0,100,255');
   m_graph_button.BackColor(clrAliceBlue);
//--- Create a control
   if(!m_graph_button.CreateButton("",x_gap,y_gap))
      return(false);
//--- Add the element pointer to the data base
   CWndContainer::AddToElementsArray(0,m_graph_button);
   return(true);
}
The structure of output of Report characteristics was modified in CreateWindow(). It was supplemented and implemented in three columns, instead of two before. These are all the modifications in the main window creation method CreateWindow().
Next, let's move on to the method that implements the chart window and the report graph — CreateGraphWindow().
//+------------------------------------------------------------------+
//|                                                                  |
//+------------------------------------------------------------------+
bool CProgram::CreateGraphWindow(void)
{
//--- Add the pointer to the window array
   CWndContainer::AddWindow(m_window[2]);
//--- Properties
   m_window[2].XSize(750);
   m_window[2].YSize(450);
   m_window[2].FontSize(9);
   m_window[2].WindowType(W_DIALOG);
   m_window[2].IsMovable(true);
//--- Create the form
   if(!m_window[2].CreateWindow(m_chart_id,m_subwin,"",75,75))
      return(false);
   //--- Charts
   if(!CreateGraph(22,22))
      return(false);
//---
   return(true);
}
The creation method is quite small. Please pay attention to the CreateGraph() method contained in it.
//+------------------------------------------------------------------+
//| Create a chart                                                   |
//+------------------------------------------------------------------+
bool CProgram::CreateGraph(const int x_gap,const int y_gap)
{
//--- Save the pointer to the main control
   m_graph1.MainPointer(m_window[2]);
//--- Properties
   m_graph1.AutoXResizeMode(true);
   m_graph1.AutoYResizeMode(true);
   m_graph1.AutoXResizeRightOffset(10);
   m_graph1.AutoYResizeBottomOffset(10);
//--- Create element
   if(!m_graph1.CreateGraph(x_gap,y_gap))
      return(false);
//--- Chart properties
   CGraphic *graph=m_graph1.GetGraphicPointer();
   graph.BackgroundColor(::ColorToARGB(clrWhiteSmoke));
   graph.XAxis().Min(0);
   graph.BackgroundMainSize(20);
   graph.HistoryNameSize(0);
   graph.HistorySymbolSize(0);
   graph.HistoryNameWidth(0);
//--- Add the element pointer to the data base
   CWndContainer::AddToElementsArray(2,m_graph1);
   return(true);
}
It creates an empty graph and sets its visual characteristics. The graph data will be added later.
One more method in the main CreateGUI() is CreateLoading(), which creates the loading window. It serves as an indicator for application loading, changing of language settings, as well as for testing and working with data.
//+------------------------------------------------------------------+
//|                                                                  |
//+------------------------------------------------------------------+
#resource "\\Images\\EasyAndFastGUI\\Icons\\bmp16\\sandglass.bmp"
bool CProgram::CreateLoading(void)
{
//--- Add the pointer to the window array
   CWndContainer::AddWindow(m_window[3]);
//--- Properties
   m_window[3].XSize(100);
   m_window[3].YSize(50);
   m_window[3].LabelYGap(50/2-16/2);
   m_window[3].IconYGap(50/2-16/2);
   m_window[3].FontSize(9);
   m_window[3].WindowType(W_DIALOG);
   m_window[3].IsMovable(false);
   m_window[3].CloseButtonIsUsed(false);
   m_window[3].CaptionColorLocked(C'0,130,225');
   m_window[3].LabelColor(clrWhite);
   m_window[3].LabelColorLocked(clrWhite);
   m_window[3].CaptionHeight(51);
   m_window[3].IconFile("Images\\EasyAndFastGUI\\Icons\\bmp16\\sandglass.bmp");
   m_window[3].IconFileLocked("Images\\EasyAndFastGUI\\Icons\\bmp16\\sandglass.bmp");
   m_window[3].IconFilePressed("Images\\EasyAndFastGUI\\Icons\\bmp16\\sandglass.bmp");
   m_window[3].IconFilePressedLocked("Images\\EasyAndFastGUI\\Icons\\bmp16\\sandglass.bmp");
   int x=int(m_window[0].XSize()/2);
   int y=int(m_window[0].YSize()/2);
//--- Create the form
   if(!m_window[3].CreateWindow(m_chart_id,m_subwin,"Working...",x,y))
      return(false);
   return(true);
}
We have considered the visual elements of the Strategy Builder. Let's move on to the testing algorithm and see how the information is displayed in it using the new visual controls.
As you may remember from the previous article, strategy testing launch and processing is implemented by the GetResult() method. We have added new data and thus we need to revise this method.
//+------------------------------------------------------------------+
//|                                                                  |
//+------------------------------------------------------------------+
void CProgram::GetResult(const string symbol)
{
//--- Get the date range
   m_start_date=StringToTime(TimeToString(m_calendar1.SelectedDate(),TIME_DATE)+" "+(string)m_time_edit1.GetHours()+":"+(string)m_time_edit1.GetMinutes()+":00");
   m_end_date=StringToTime(TimeToString(m_calendar2.SelectedDate(),TIME_DATE)+" "+(string)m_time_edit2.GetHours()+":"+(string)m_time_edit2.GetMinutes()+":00");
//--- Check specified dates
   if(m_start_date>m_end_date || m_end_date>TimeCurrent())
   {
      if(m_lang_index==0)
         MessageBox("Неправильно выбран диапазон дат!","Ошибка",MB_OK);
      else if(m_lang_index==1)
         MessageBox("Incorrect date range selected!","Error",MB_OK);
      return;
   }
//--- Check if patterns are specified correctly
   if(m_combobox1.GetListViewPointer().SelectedItemIndex()==m_combobox2.GetListViewPointer().SelectedItemIndex())
   {
      if(m_lang_index==0)
         Messagebox("Паттерны не могут быть одинаковыми!","Ошибка",MB_OK);
      else if(m_lang_index==1)
         MessageBox("Patterns cannot be the same!","Error",MB_OK);
      return;
   }
//---
   m_window[3].OpenWindow();
//---
   m_counter=0;
   m_all_losses=0;
   m_all_profit=0;
   AddDeal(0,m_counter);
   ZeroMemory(m_report);
   MqlRates rt[];
   datetime cur_date=m_start_date;
   string tf=m_timeframe1.GetListViewPointer().SelectedItemText();
   int applied1=m_applied1.GetListViewPointer().SelectedItemIndex();
   int applied2=m_applied2.GetListViewPointer().SelectedItemIndex();
   int applied3=m_applied3.GetListViewPointer().SelectedItemIndex();
   int applied4=m_applied4.GetListViewPointer().SelectedItemIndex();
   int applied5=m_applied5.GetListViewPointer().SelectedItemIndex();
   int applied6=m_applied6.GetListViewPointer().SelectedItemIndex();
//---
   while(cur_date<m_end_date)
   {
      //---
      if(
         applied1>7 || applied2>7 || applied3>7 ||
         applied4>7 || applied5>7 || applied6>7)
      {
         if(m_custom_path.GetValue()=="")
         {
            if(m_lang_index==0)
               MessageBox("Не установлен путь к индикатору!","Ошибка",MB_OK);
            else if(m_lang_index==1)
               MessageBox("The indicator path is not set!","Error",MB_OK);
            break;
         }
         if(m_custom_param.GetValue()=="")
         {
            if(m_lang_index==0)
               MessageBox("Не установлены параметры индикатора!","Ошибка",MB_OK);
            else if(m_lang_index==1)
               MessageBox("Indicator parameters not set!","Error",MB_OK);
            break;
         }
      }
      //---
      if(
         BuySignal(symbol,m_start_date,applied1,1) ||
         BuySignal(symbol,m_start_date,applied2,2) ||
         BuySignal(symbol,m_start_date,applied3,3))
      {
         CalculateBuyDeals(symbol,m_start_date);
         cur_date=m_start_date;
         continue;
      }
      if(
         SellSignal(symbol,m_start_date,applied4,1) ||
         SellSignal(symbol,m_start_date,applied5,2) ||
         SellSignal(symbol,m_start_date,applied6,3))
      {

         CalculateSellDeals(symbol,m_start_date);
         cur_date=m_start_date;
         continue;
      }
      m_start_date+=PeriodSeconds(StringToTimeframe(tf));
      cur_date=m_start_date;
   }
//--- Output the report
   PrintReport();
//---
   m_window[3].CloseDialogBox();
}
The following modifications are implemented:
- A check is added to verify that patterns for buy and sell signals do not match.
- Added use of the previously created Download window.
- Added AddDeal() method, which is responsible for writing testing results to the data array that is used by the graph. The initial value for the graph is set here. With the Profit type "Currency" the initial value is "Currency". For "Points" it is zero.
Now let us view the AddDeal() data adding method:
//+------------------------------------------------------------------+
//|                                                                  |
//+------------------------------------------------------------------+
void CProgram::AddDeal(int points,int index)
{
//--- In points
   if(m_profit_type.GetListViewPointer().SelectedItemIndex()==0)
   {
      if(index==0)
      {
         ArrayResize(data,index+1);
         data[index]=0;
         return;
      }
      ArrayResize(data,index+1);
      data[index]=data[index-1]+points;
   }
//--- In deposit currency
   else if(m_profit_type.GetListViewPointer().SelectedItemIndex()==1)
   {
      if(index==0)
      {
         ArrayResize(data,index+1);
         data[index]=StringToDouble(m_init_deposit.GetValue());
         return;
      }
      ArrayResize(data,index+1);
      //--- Get a selected symbol
      string symbol=m_table_symb.GetValue(0,m_table_symb.SelectedItem());
      string basesymbol=AccountInfoString(ACCOUNT_CURRENCY);
      string tf=m_timeframe1.GetListViewPointer().SelectedItemText();
      double lot=StringToDouble(m_base_lot.GetValue());
      if(m_lot_type.GetListViewPointer().SelectedItemIndex()>0)
      {
         lot*=data[index-1];
         lot=GetLotForOpeningPos(symbol,POSITION_TYPE_BUY,lot);
      }

      double pip_price=1;
      int shift=0;
      // --- Direct pair
      if(StringSubstr(symbol,3,3)==basesymbol)
      {
         pip_price=NormalizeDouble(SymbolInfoDouble(symbol,SYMBOL_TRADE_CONTRACT_SIZE)*SymbolInfoDouble(symbol,SYMBOL_POINT)*lot,2);
      }
      //--- Reverse pair
      else if(StringSubstr(symbol,0,3)==basesymbol)
      {
         shift=iBarShift(symbol,StringToTimeframe(tf),m_start_date,false);
         pip_price=NormalizeDouble(SymbolInfoDouble(symbol,SYMBOL_TRADE_CONTRACT_SIZE)*SymbolInfoDouble(symbol,SYMBOL_POINT)*lot/iOpen(symbol,StringToTimeframe(tf),shift),2);
      }
      else
      {
         //--- Cross pair
         StringConcatenate(symbol,StringSubstr(symbol,3,3),basesymbol);
         if(SymbolInfoDouble(symbol,SYMBOL_BID)!=0)
         {
            shift=iBarShift(symbol,StringToTimeframe(tf),m_start_date,false);
            pip_price=NormalizeDouble(SymbolInfoDouble(symbol,SYMBOL_TRADE_CONTRACT_SIZE)*SymbolInfoDouble(symbol,SYMBOL_POINT)*lot/iOpen(symbol,StringToTimeframe(tf),shift),2);
         }
         //---
         StringConcatenate(symbol,basesymbol,StringSubstr(symbol,0,3));
         if(SymbolInfoDouble(symbol,SYMBOL_BID)!=0)
         {
            shift=iBarShift(symbol,StringToTimeframe(tf),m_start_date,false);
            pip_price=NormalizeDouble(SymbolInfoDouble(symbol,SYMBOL_TRADE_CONTRACT_SIZE)*SymbolInfoDouble(symbol,SYMBOL_POINT)*lot*iOpen(symbol,StringToTimeframe(tf),shift),2);
         }
      }
      //---
      if(points>0)
         m_all_profit+=pip_price*points;
      else
         m_all_losses+=pip_price*-points;
      //---
      data[index]=data[index-1]+pip_price*points;
   }
}
It has two values in the arguments:
- points is used for the new value for the chart. The received value is the deal closing result in points. This is either Take Profit or Stop Loss.
- index is the index of the trade.
Depending on the selected Profit display mode, appropriate data is calculated in the method and is added to the data array. For the "Points" profit mode, each new element of the array is the sum of the previous value and the trade result in points. In the "Currency" mode, the received deal results in points is converted to the deposit currency. This operation takes into account the type of the tested pair: direct, reverse or cross pair.
The other two methods that have been modified are CalculateBuyDeals() and CalculateSellDeals(). They process the found signal and virtually open a position if necessary. Let's view one of the methods (modifications in the second method are similar):
//+------------------------------------------------------------------+
//|                                                                  |
//+------------------------------------------------------------------+
void CProgram::CalculateBuyDeals(const string symbol,datetime start)
{
   MqlRates rt[];
   int TP=int(m_takeprofit1.GetValue());
   int SL=int(m_stoploss1.GetValue());
   string tf=m_timeframe1.GetListViewPointer().SelectedItemText();
   int copied=CopyRates(symbol,StringToTimeframe(tf),m_start_date,m_end_date,rt);
   double deal_price=iOpen(symbol,StringToTimeframe(tf),copied);
   for(int j=0; j<copied; j++)
   {
      //--- Take Profit trigger
      if((iHigh(symbol,StringToTimeframe(tf),copied-j)-deal_price)/SymbolInfoDouble(symbol,SYMBOL_POINT)>=TP)
      {
         m_counter++;
         AddDeal(TP,m_counter);
         m_report.profit_trades++;
         m_report.profit+=TP;
         m_report.profit_pips+=TP;
         m_report.long_trades++;
         m_report.profit_long++;
         m_report.total_trades++;
         m_start_date=IndexToDate(m_start_date,StringToTimeframe(tf),j);
         return;
      }
      //--- Stop Loss trigger
      else if((deal_price-iLow(symbol,StringToTimeframe(tf),copied-j))/SymbolInfoDouble(symbol,SYMBOL_POINT)>=SL)
      {
         m_counter++;
         AddDeal(-SL,m_counter);
         m_report.loss_trades++;
         m_report.profit-=SL;
         m_report.loss_pips+=SL;
         m_report.long_trades++;
         m_report.total_trades++;
         m_start_date=IndexToDate(m_start_date,StringToTimeframe(tf),j);
         return;
      }
   }
   m_start_date=m_end_date;
}
Changes concern Take Profit and Stop Loss triggering. Here, the above described AddDeal() method processes the fact of a deal closing. Also new parameters profit_pips and loss_pips have been added to the REPORT m_report structure. These parameters allow calculating new characteristics in the report.
And the last method which has been significantly modified is processing of received data and output of the results to the report. Again this is performed by the PrintReport() method:
//+------------------------------------------------------------------+
//|                                                                  |
//+------------------------------------------------------------------+
void CProgram::PrintReport(void)
{
   string report_label[11];
   if(m_lang_index==0)
   {
      report_label[0]="Всего трейдов: ";
      report_label[1]="Чистая прибыль: ";
      report_label[2]="Прибыль в пунктах: ";
      report_label[3]="Абс.просадка баланса: ";
      report_label[4]="Макс.просадка баланса: ";
      report_label[5]="Корот.трейды/% выигр: ";
      report_label[6]="Приб.трейды/% от всех: ";
      report_label[7]="Прибыльность: ";
      report_label[8]="Фактор восстановления: ";
      report_label[9]="Длин.трейды/% выигр: ";
      report_label[10]="Убыт.трейды/% от всех: ";
   }
   else
   {
      report_label[0]="Total trades: ";
      report_label[1]="Total profit: ";
      report_label[2]="Total profit(pips): ";
      report_label[3]="Balance Drawdown Abs: ";
      report_label[4]="Balance Drawdown Max: ";
      report_label[5]="Short trades/won %: ";
      report_label[6]="Profit trades/% of all: ";
      report_label[7]="Profit Factor: ";
      report_label[8]="Recovery Factor: ";
      report_label[9]="Long trades/won %: ";
      report_label[10]="Loss trades/% of all: ";
   }
   //---
   m_report_text[0].LabelText(report_label[0]+string(m_report.total_trades));
   //---
   if(m_report.total_trades==0)
      return;
   //---
   if(m_profit_type.GetListViewPointer().SelectedItemIndex()==1)
   {
      double maxprofit=0.0,maxdd=0.0;
      for(int i=1; i<ArraySize(data); i++)
      {
         if(data[i]>maxprofit)
            maxprofit=data[i];
         if(maxdd<maxprofit-data[i])
            maxdd=maxprofit-data[i];
      }
      m_report_text[1].LabelText(report_label[1]+DoubleToString(data[ArraySize(data)-1],2));
      m_report_text[3].LabelText(report_label[3]+string(data[0]-data[ArrayMinimum(data)]));
      m_report_text[4].LabelText(report_label[4]+DoubleToString(maxdd/maxprofit*100,2)+"%");
      m_report_text[7].LabelText(report_label[7]+DoubleToString(m_all_profit/m_all_losses,2));
      m_report_text[8].LabelText(report_label[8]+DoubleToString((data[ArraySize(data)-1]-data[0])/maxdd,2));
   }
   else
   {
      m_report_text[1].LabelText(report_label[1]+"-");
      m_report_text[3].LabelText(report_label[3]+"-");
      m_report_text[4].LabelText(report_label[4]+"-");
      m_report_text[7].LabelText(report_label[7]+DoubleToString(m_report.profit_pips/(double)m_report.loss_pips,2));
   }
   m_report_text[2].LabelText(report_label[2]+string(m_report.profit));
   m_report_text[5].LabelText(report_label[5]+string(m_report.short_trades)+"/"+DoubleToString(m_report.profit_short/(double)m_report.short_trades*100,1)+"%");
   m_report_text[6].LabelText(report_label[6]+string(m_report.profit_trades)+"/"+DoubleToString(m_report.profit_trades/(double)m_report.total_trades*100,1)+"%");
   m_report_text[9].LabelText(report_label[9]+string(m_report.long_trades)+"/"+DoubleToString(m_report.profit_long/(double)m_report.long_trades*100,1)+"%");
   m_report_text[10].LabelText(report_label[10]+string(m_report.loss_trades)+"/"+DoubleToString(m_report.loss_trades/(double)m_report.total_trades*100,1)+"%");
//---
   for(int i=0; i<11; i++)
      m_report_text[i].Update(true);
   m_reported=true;
}
As it was mentioned in the overview, some parameters, for example Total profit or Recovery factor, are not available for the "Points" testing mode.
Strategy Builder Testing and Demonstration
Following the improvements and updates implemented in the application, there is a need to update the user manual.
Step 1. Set the user interface language.
This step is optional and is only needed if you wish to change the language.
Step 2. Set indicator parameters.
The application already has default parameters, therefore there is no need to configure all indicators. Change only the required parameters. If necessary, you can always change the settings.
Step 3. Set the table of symbols.
By default, all symbols from the Market Watch are filtered by the presence of USD in the name. You can display all available symbols by simply unchecking the checkbox.
Step 4-5. Select the testing time interval and timeframe - these steps have not changed.
Step 6. Enable sell/buy signals and select a pattern for testing.
The signal setup procedure has not changed. However, changes apply to the visual display: if one of the signal types is disabled, all relevant settings will be hidden, as it is shown in fig.3.
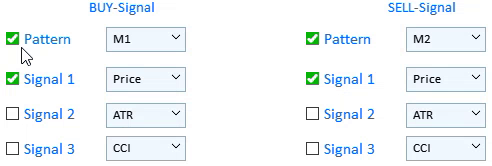
Fig.3 Disabling buy or sell signals.
Step 7. Take Profit and Stop Loss settings have not changed.
Step 8. Select Profit type.
- When Points is selected, testing results in the Report section will be shown in points of the selected currency symbol.
- If Currency is selected, additional settings appear: Lot Type, Lot Size and Initial Deposit. Lot Type affects the calculation of lot which will be applied in testing. It can be Constant or based on Balance.
Step 9. After steps 1-8, select the testing instrument by a left-click in the table.
After testing is completed, the results will appear in the Report section. After that you can click Open graph.
Testing following the above algorithm is shown in the next video.
Recommendations for testing Merrill patterns:
- To allow the application work correctly, we need historical data for testing on a specified trading symbol to be downloaded.
- Be careful with custom indicator parameters: buffer number, name or parameters should be separated by commas. Note that only numeric values are supported. Custom indicator name is the path relative to the Indicators root directory (MQL5/Indicators/). If the indicator is located in a subdirectory, for example MQL5/Indicators/Examples, the name should look accordingly: "Examples\\indicator_name" (always use a double backslash instead of a single one as a separator).
- The most common scenarios that may cause difficulties are accompanied by tips. These include the same patterns for both signals, attempt to open a graph without performing prior tests, incorrect testing beginning and ending dates.
- At the beginning of the article, I mentioned a link to the descriptions of characteristics used in the Report. Use the link to read more about the parameter descriptions and calculation methods.
Conclusion
The archive attached below contains all described files properly arranged into folders. For correct operation, place the MQL5 folder to the terminal's root directory. To open the terminal root directory, in which the MQL5 folder is located, press the Ctrl+Shift+D key combination in the MetaTrader 5 terminal or use the context menu as shown in Fig. 5 below.
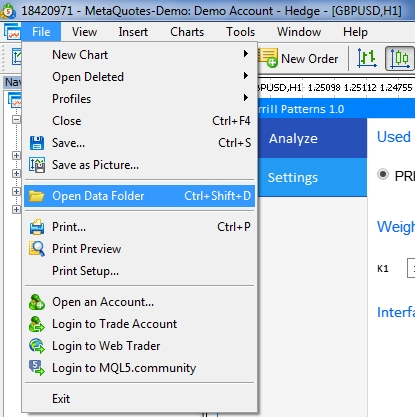
Fig. 5. Opening the MQL5 folder in the MetaTrader 5 terminal root
Translated from Russian by MetaQuotes Ltd.
Original article: https://www.mql5.com/ru/articles/7361

- Free trading apps
- Over 8,000 signals for copying
- Economic news for exploring financial markets
You agree to website policy and terms of use