
How to integrate Smart Money Concepts (OB) coupled with Fibonacci indicator for Optimal Trade Entry
Introduction
Smart Money Concepts (SMC) and Order Blocks are critical areas on the chart where institutional traders typically execute large buying or selling orders. These zones often mark the origins of significant price movements, making them vital for traders seeking to align their strategies with institutional market activity. Understanding how these key levels influence price action can provide retail traders with more profound insight into the underlying market dynamics, allowing them to anticipate high-probability moves.
When combined with tools like the Fibonacci retracement, traders can further refine their entry strategies. The Fibonacci retracement identifies potential pullback levels between a recent swing high and swing low, offering a way to measure how far price may retrace before continuing its trend. This approach helps traders pinpoint optimal entry points by aligning institutional order flow with areas of market interest, enhancing the precision of their trades.
Expert Logic
Bullish Order Block:
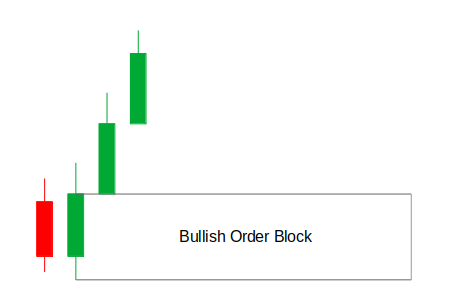
A Bullish Order Block can be identified on the charts when a bearish candle is followed by a bullish candle that engulfs the previous bearish candle, marking the beginning of significant bullish momentum. For the formation to qualify as a Bullish Order Block, the candles that follow the bearish candle must consist of at least two bullish candles or a series of bullish candles. The correct approach to trading a Bullish Order Block is to wait for the price to retrace and dip back into the identified Bullish Order Block zone, at which point a buy position can be executed.
Bullish Fibonacci Retracement:
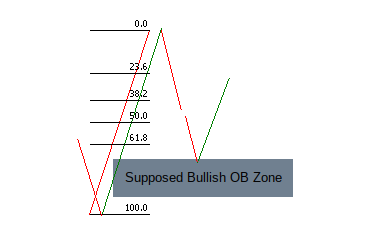
To find an optimal trade entry after identifying a Bullish Order Block, the Fibonacci retracement tool is used. Once the Bullish Order Block is located, the trader looks for the recent swing high and swing low associated with the order block. The Fibonacci retracement is then drawn from the swing low to the swing high on the chart. The retracement helps confirm that the Bullish Order Block lies at or below the 61.8% level, a key retracement zone that indicates a potential buying opportunity in alignment with institutional order flow.
Bearish Order Block:
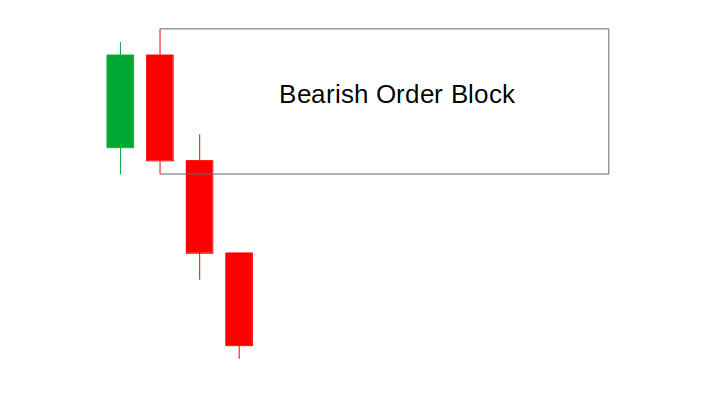
A Bearish Order Block is identified when a bullish candle is followed by a bearish candle that engulfs the previous bullish candle, signaling the start of significant bearish momentum. For the pattern to be considered a Bearish Order Block, at least two bearish candles or a series of bearish candles must follow the bullish candle. The proper way to trade a Bearish Order Block is to wait for the price to return and retest the bearish order block zone, where a sell position can then be executed.
Bearish Fibonacci Retracement:
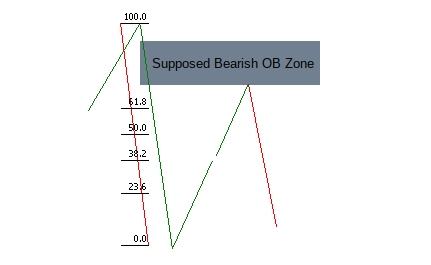
For a Bearish Order Block, the Fibonacci retracement tool is used to locate optimal trade entries. After identifying the Bearish Order Block, the trader looks for the recent swing high and swing low. In this case, the Fibonacci retracement is drawn from the swing high to the swing low, as the focus is on a sell order. The retracement confirms that the Bearish Order Block is at or above the 61.8% level, indicating a high-probability entry point for a short position.
Getting started:
//+------------------------------------------------------------------+
//|                                                       FIB_OB.mq5 |
//|                                  Copyright 2024, MetaQuotes Ltd. |
//|                                             https://www.mql5.com |
//+------------------------------------------------------------------+
#property copyright "Copyright 2024, MetaQuotes Ltd."
#property link      "https://www.mql5.com"
#property version   "1.00"

#include  <Trade/Trade.mqh>
CTrade trade;

#define BullOB clrLime
#define BearOB clrRed
`# include <Trade/Trade.mqh>` This line includes the MQL5 Trade library, which provides built-in functions for managing trades, orders, and positions. The file `Trade.mqh` contains predefined classes and functions that simplify trading operations like opening, closing and modifying orders. We create an instance of `CTrade` called `trade`. The `CTrade` class encapsulates trading operations (such as placing buy/sell orders, closing positions, and modifying trades). By creating this object, you can easily manage trades using object-oriented method in your Expert Advisor (EA).
We then define two constants for colors we will use to visualize Bullish Order Blocks and Bearish Order Blocks. `BullOB` is assigned the color `clrLime` (green) for bullish order blocks, indicating areas where buyers may have entered the market. `BearOB` is assigned the color `clrRed` for bearish order blocks, indicating areas where sellers may have entered the market.
//+------------------------------------------------------------------+
//|                           Global vars                            |
//+------------------------------------------------------------------+
double Lots = 0.01;
int takeProfit = 170;
//int stopLoss = 200;
int length = 100;

input double stopLoss = 350;
input double Mgtn = 00.85;

bool isBullishOB = false;
bool isBearishOB = false;

input int Time1Hstrt = 3;
input int Time1Hend = 4;
`isBullishOB` and `isBearishOB` are the boolean flags we use to track the detection of Order Blocks (OB). Among the global variables we have `Time1Hstrt` and `Time2Hend` input parameters for time settings. `Time1Hstrt` Represents the starting hour for a specific trading window, in our case it represents the New York trading session. `Time1Hend` Represents the ending hour for that time window.
class COrderBlock : public CObject {
public:
   int direction;
   datetime time;//[]
   double high;
   double low;

   void draw(datetime tmS, datetime tmE, color clr){
      string objOB = " OB REC" + TimeToString(time);
      ObjectCreate( 0, objOB, OBJ_RECTANGLE, 0, time, low, tmS, high);
      ObjectSetInteger( 0, objOB, OBJPROP_FILL, true);
      ObjectSetInteger( 0, objOB, OBJPROP_COLOR, clr);

      string objtrade = " OB trade" + TimeToString(time);
      ObjectCreate( 0, objtrade, OBJ_RECTANGLE, 0, tmS, high, tmE, low); // trnary operator
      ObjectSetInteger( 0, objtrade, OBJPROP_FILL, true);
      ObjectSetInteger( 0, objtrade, OBJPROP_COLOR, clr);
   }
};
We define a class named `COrderBlock`, which we will use to model an Order Block (OB) in the trading chart. It includes properties for order block direction, time, high, and low values, as well as method (`draw`) to draw the order block on the chart. The class `COrderBlock` is inheriting from the base class `CObject`, which is a general-purpose class in MQL5 used for creating objects. This gives `COrderblock` access to the methods and properties of `CObject`.
Member variables (Properties) `direction` an int data type representing the direction of the order block. We use it to indicate whether the order block is bullish (up is 1) or bearish (down is -1). `time` Represents the time when the order block was formed or detected. It holds the timestamp of the order block event. `high` Represents the high price of the order block (the upper boundary of the zone). `low` Represents the low price of the order block (the lower boundary of the zone). These four variables are the key attributes of an Order Block (OB).
We then have a string variable `objOB` is created to hold the unique name of the rectangle object that will represent the order block on the chart. The name is generated using the prefix "OB REC" concatenated with time of the order block (converted for string using `TimeToString()`). `ObjectCreate()` This function creates a rectangle object (`OBJ-RECTANGLE`) on the chart. `0` The chart ID (0 means the current chart) and `objOB` is the name of the rectangle object. `time, low` The coordinates for the lower-left corner of the rectangle (the start of the order block on the time axis and the price level of the low). `tmS, high` The coordinates for the upper-right corner of the rectangle (the end time and the price level of the high).
COrderBlock* OB;
color OBClr;
datetime T1;
datetime T2;
- `COrderBlock* OB`: A pointer to an `Order Block` object, which we will use to manage and draw order blocks on the chart.
- `color OBClr`: A variable that holds the color to be used for the order block depending on a bullish or a bearish order block was detected.
- `datetime T1`: A variable representing the start time of the order block.
- `datetime T2`: A variable representing the end time of the order block.
//+------------------------------------------------------------------+
//| Expert initialization function                                   |
//+------------------------------------------------------------------+
int OnInit(){
   trade.SetExpertMagicNumber(MagicNumber);

   return(INIT_SUCCEEDED);
}
The `OnInit()` function is called when the EA is first loaded onto a chart. We simply set the magic number of the expert advisor, which is simply a unique identifier for the trades made by the EA.
const int len = 5;
int left_bars, right_bars;
int bar_Now = len;
bool isSwingH = true, isSwingL = true;
- `len`: Sets the number of bars (candlesticks) to the left and right that will be considered when determining if a bar is a swing point.
- `left-bars, right-bars`: These variables will be used to store the indices of the left and right bars relative to the current bar (bar-Now).
- `bar-Now = len`: The current bar being analyzed is set to len (in this case, 5 bars back).
- `isSwingH, isSwingL`: These boolean variables are initialized to `true` and will be used to check if the current bar is a swing high or swing low.
for(int i = 1; i <= len; i++){
   right_bars = bar_Now - i;
   left_bars = bar_Now + i;
The `for` loop iterates through the range of bars (len = 5), analyzing both the left and right sides of the current bar (bar-Now).
- `right-bars = bar-Now - i`: Refers to the bars to the right of the current bar.
- `left-bars = bar-Now + i`: Refers to the bars to the left of the current bar.
if((getHigh(bar_Now) <= getHigh(right_bars)) ||(getHigh(bar_Now) < getHigh(left_bars))){
   isSwingH = false;
}
This condition checks if the high of the current bar (bar-Now) is less than or equal to the high of the surrounding bars (both left and right). If any bar on either side has a higher or equal high, then the current bar is not a swing high, and `isSwingH` is set to false.
if((getLow(bar_Now) >= getLow(right_bars)) || getLow(bar_Now) > getLow(left_bars)){
   isSwingL = false;
}
Similar to the swing high logic, this condition checks if the low of the current bar is greater than or equal to the low of the surrounding bars. If any bar on either side has a lower or equal low, then the current bar is not a swing low, and `isSwingL` is set to false.
if(isSwingH){
   Print("We have a swing high at index: ", bar_Now, "at price: ", getHigh(bar_Now));
   fib_high = getHigh(bar_Now);
   fib_t1 = getTime(bar_Now);
}
If `isSwingH` remains true, it indicates that a swing high has been found. The function prints the bar index and the swing price. `fib-high` and `fib-t1` are global variables that store the swing high price and the corresponding time. These values will be passed as parameters into the FIBO object.
if(isSwingL){
   Print("We have a swing low at index: ", bar_Now," at price: ", getLow(bar_Now));
   fib_low = getLow(bar_Now);
   fib_t2 = getTime(bar_Now);
}
Similarly, to handle the swing low detection the variable `isSwingL` remains true if a swing low is detected. The function prints the bar index and the swing low price. `fib-low` and `fib-t2` stores the swing low price and time. These values will be passed as parameters into the FIBO object.
//+------------------------------------------------------------------+
//|                      Function to find OB                         |
//+------------------------------------------------------------------+
void getOrderB(){

   static int prevDay = 0;

   MqlDateTime structTime;
   TimeCurrent(structTime);
   structTime.min = 0;
   structTime.sec = 0;

   structTime.hour = Time1Hstrt;
   datetime timestrt = StructToTime(structTime);

   structTime.hour = Time1Hend;
   datetime timend = StructToTime(structTime);

   if(TimeCurrent() >= timestrt && TimeCurrent() < timend){
      if(prevDay != structTime.day_of_year){
         delete OB;

         for(int i = 1; i < 100; i++){
            if(getOpen(i) < getClose(i)){ // index is i since the loop starts from i which is = 1 "for(int i = 1)..."
               if(getOpen(i + 2) < getClose(i + 2)){
                  if(getOpen(i + 3) > getClose(i + 3) && getOpen(i + 3) < getClose(i + 2)){
                     Print("Bullish Order Block confirmed at: ", TimeToString(getTime(i + 2), TIME_DATE||TIME_MINUTES));
                     //isBullishOB = true;
                     OB = new COrderBlock();
                     OB.direction = 1;
                     OB.time = getTime(i + 3);
                     OB.high = getHigh(i + 3);
                     OB.low = getLow(i + 3);
                     isBullishOB = true;

                     OBClr = isBullishOB ? BullOB : BearOB;

                     // specify strt time
                     T1 = OB.time;

                     // reset BULL OB flag
                     isBullishOB = false;
                     prevDay = structTime.day_of_year;
                     break;

                     delete OB;
                  }
               }
            }
            if(getOpen(i) > getClose(i)){
               if(getOpen(i + 2) > getClose(i + 2)){
                  if(getOpen(i + 3) < getClose(i + 3) && getOpen(i + 3) < getClose(i + 2)){
                     Print("Bearish Order Block confirmed at: ", TimeToString(getTime(i + 2), TIME_DATE||TIME_MINUTES));
                     //isBearishOB = true;
                     OB = new COrderBlock();
                     OB.direction = -1;
                     OB.time = getTime(i + 3);
                     OB.high = getHigh(i + 3);
                     OB.low = getLow(i + 3);
                     isBearishOB = true;

                     OBClr = isBearishOB ? BearOB : BullOB;

                     T1 = OB.time;

                     // reset the BEAR OB flag
                     isBearishOB = false;
                     prevDay = structTime.day_of_year;
                     break;

                     delete OB;
                  }
               }
            }
         }
      }
   }
}
The function looks for Bullish and Bearish Oder Block in the price data within a specific time range (in this case from `Time1Hstrt` to `Time1end`). Once identified, it creates an `Order Block` object (`COrderBlock`) with relevant attributes like direction, time, high and low prices. It then sets the colors and flags for visualization and processing. `prevDay` is a static variable the retains its values between function calls. It ensures the order block detection is performed only once per day.
If the function has already processed the current day (`prevDay`), it skips detection to avoid recalculating order blocks. It resets once the day changes. The function checks price action for bullish and bearish order block patterns.
- Conditions: It looks for a series of candles forming a bullish pattern. The first candle is bullish (open price is lower than close price). The second candle is also bullish for confirmation. The third candle is bearish, but its open price is lower than the second candle’s close.
- If all conditions are met, a bullish order block is confirmed.
- A new `COrderBlock` object is created with the properties like direction (bullish), time, high, and low price.
- Similar logic is applied for a bearish order block. The first candle is bearish (open price is higher than close price). The second candle is also bearish for confirmation. The third candle is bullish, but its open price is lower than the second candle’s close.
- When the conditions are met, a bearish order block is confirmed.
- After processing, the `OB` object is deleted to free memory.
- `pervDay` is updated to ensure the function runs only once per day.
bool isNewBar() {
   // Memorize the time of opening of the last bar in the static variable
   static datetime last_time = 0;

   // Get current time
   datetime lastbar_time = (datetime)SeriesInfoInteger(Symbol(), Period(), SERIES_LASTBAR_DATE);

   // First call
   if (last_time == 0) {
      last_time = lastbar_time;
      return false;
   }

   // If the time differs (new bar)
   if (last_time != lastbar_time) {
      last_time = lastbar_time;
      return true;
   }

   // If no new bar, return false
   return false;
}
This function checks whether a new bar has appeared on the chart, to perform some functions once per bar.
double getHigh(int index) {
    return iHigh(_Symbol, _Period, index);
}

double getLow(int index) {
    return iLow(_Symbol, _Period, index);
}

double getOpen(int index){
   return iOpen(_Symbol, _Period, index);
}

double getClose(int index){
   return iClose(_Symbol, _Period, index);
}

datetime getTime(int index) {
    return iTime(_Symbol, _Period, index);
}
This section of the code provides a set of utility functions to retrieve specific price data and time information for a given bar (or candlestick) at the provided `index`. Each function accesses the respective price or time value for a symbol and period using built-in MQL5 functions like `iHigh()`, `iLow()`, `iOpen()`, `iClose()`, and `iTime()`.
void OnTick(){
    if(isNewBar()){
      getOrderB();
      getSwings();

      double Bid = SymbolInfoDouble(_Symbol, SYMBOL_BID);
      double Ask = SymbolInfoDouble(_Symbol, SYMBOL_ASK);

      if(CheckPointer(OB) != POINTER_INVALID  && OB.direction > 0 && Ask < OB.high){
         double entry = Ask;
         double tp = getHigh(iHighest(_Symbol, PERIOD_CURRENT, MODE_HIGH, iBarShift(_Symbol, PERIOD_CURRENT, OB.time)));
         double sl = NormalizeDouble(OB.low - Mgtn, _Digits);
        // double sl = getLow(iLowest(_Symbol, PERIOD_CURRENT, MODE_LOW, 2,iBarShift(_Symbol, PERIOD_CURRENT, OB.time)));

         ObjectCreate( 0, FIBO_OBJ, OBJ_FIBO, 0, fib_t1, fib_low, fib_t2, fib_high);
         double entLvl = fib_high - (fib_high - fib_low) * Fib_Trade_lvls / 100; // check this if non

         if(OB.high <= entLvl){
            T2  = getTime(0);
            OB.draw(T1, T2, OBClr);
            trade.Buy(Lots, _Symbol, entry, sl, tp, "OB buy");
            delete OB;
         }else{
            delete OB;
         }
      }

      if(CheckPointer(OB) != POINTER_INVALID && OB.direction < 0 && Bid > OB.low){
         double entry = Bid;
         double tp = getLow(iLowest(_Symbol, PERIOD_CURRENT, MODE_LOW, iBarShift(_Symbol, PERIOD_CURRENT, OB.time)));
         double sl = NormalizeDouble(OB.high + Mgtn, _Digits);
        // double sl = getHigh(iHighest(_Symbol, PERIOD_CURRENT, MODE_HIGH, iBarShift(_Symbol, PERIOD_CURRENT, OB.time)));

         ObjectCreate( 0, FIBO_OBJ, OBJ_FIBO, 0, fib_t2, fib_high, fib_t1, fib_low);
         double entLvl = fib_low + (fib_low - fib_high) * Fib_Trade_lvls / 100;

         if(OB.low >= entLvl){
            T2 = getTime(0);
            OB.draw(T1, T2, OBClr);
            trade.Sell(Lots, _Symbol, entry, sl, tp, "OB sell");
            delete OB;
         }else{
            delete OB;
         }
      }

      ObjectSetInteger( 0, FIBO_OBJ, OBJPROP_COLOR, clrBlack);
      for(int i = 0; i < ObjectGetInteger( 0, FIBO_OBJ, OBJPROP_LEVELS); i++){
         ObjectSetInteger( 0, FIBO_OBJ, OBJPROP_LEVELCOLOR, i, clrBlack);
      }
    }
}
Since the `OnTick()` is executed every time a new tick (price update) occurs, we use `isNewBar()` function to check if there is a new bar formed. The `getOrderB()` function identifies potential bullish or bearish order blocks (zones where institutional traders place large buy/sell orders). The `getSwing()` function identifies swing points (highs and lows) in the price movement, used to draw the Fibonacci retracement levels.
When the order block has been detected and the price retraces back into the order block zone, we first check if the current price is within this zone. If it is, we then proceed to validate the setup by checking whether the price aligns with the 61.8% Fibonacci retracement level. This level is critical because it often signals a strong reversal point in institutional trading strategies. Only if both conditions are met — price within the order block and alignment with the 61.8% Fibonacci retracement — do we proceed to execute a position (buy or sell). Otherwise, if either condition fails, we simply delete the order block and avoid entering the trade.
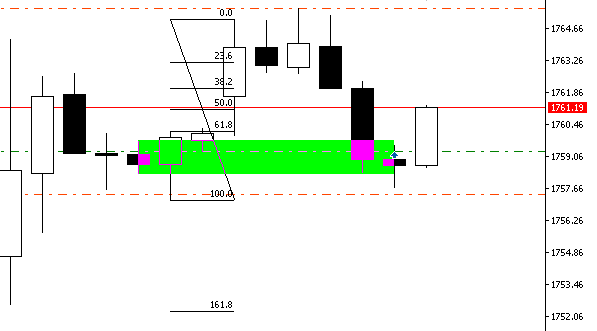
Bullish Order Block when confirmed:
Bearish Order Block when confirmed:
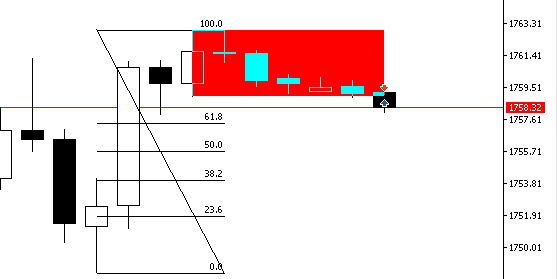
The logic of the system is built on the dependency between the order block and Fibonacci retracement levels. When an order block is detected, the system checks if it aligns with the 61.8% Fibonacci retracement level. For a bullish order block, the price must fall below the 61.8% retracement level, while for a bearish order block, it must be above the 61.8% level. If the order block does not meet these Fibonacci conditions, no trade position is executed. However, the Fibonacci object is still drawn on the chart to visualize the retracement level, helping the trader monitor the potential setup without taking a position until the right conditions are met.
Conclusion
In summary, we integrated key technical analysis concepts such as order blocks, swing highs/lows, and Fibonacci retracement to automate trading decisions. We created functions to detect bullish and bearish order blocks, which represent areas where institutional traders typically place large buy or sell orders. By incorporating Fibonacci levels, the EA confirms whether price retracement aligns with high-probability zones before executing trades. The `OnTick()` function continually monitors the market for new bars and evaluates whether conditions are met to open positions, automatically setting entry, stop loss, and take profit levels based on real-time price action.
In conclusion, this Expert Advisor is designed to help retail traders align their trades with institutional order flow, giving them a systematic approach to entering high-probability trades. By identifying and reacting to key market structures such as order blocks and price retracements, the EA allows traders to trade in a way that mirrors the strategic moves of large financial institutions. This alignment can improve trade accuracy, reduce emotional decision-making, and ultimately enhance profitability for retail traders.
Warning: All rights to these materials are reserved by MetaQuotes Ltd. Copying or reprinting of these materials in whole or in part is prohibited.
This article was written by a user of the site and reflects their personal views. MetaQuotes Ltd is not responsible for the accuracy of the information presented, nor for any consequences resulting from the use of the solutions, strategies or recommendations described.
 How to Create an Interactive MQL5 Dashboard/Panel Using the Controls Class (Part 2): Adding Button Responsiveness
 Creating an MQL5 Expert Advisor Based on the Daily Range Breakout Strategy
 Neural networks made easy (Part 89): Frequency Enhanced Decomposition Transformer (FEDformer)
 Integrating MQL5 with data processing packages (Part 3): Enhanced Data Visualization
- Free trading apps
- Over 8,000 signals for copying
- Economic news for exploring financial markets
You agree to website policy and terms of use
i think your zip file doesnt work as intended,i see no graphs but i see some debug messages about a
swing high or loww.
"mgtn" is used as a price margin or buffer to place the stop loss below the order block's low (for buy trades) or above the order block's high (for sell trades).
The EA determines swing highs and swing lows by comparing the current bar with a set number of bars on the left and right (len = 5 in this case). A bar is marked as a swing high if its high is greater than those of the surrounding bars, and as a swing low if its low is lower than those of the surrounding bars. Since this method uses a fixed number of bars, it primarily detects major structure swings and may not always capture minor structure changes unless you reduce the parameter len.