
Developing an Expert Advisor (EA) based on the Consolidation Range Breakout strategy in MQL5
Introduction
In this article, we will explore the development of an Expert Advisor (EA) based on the Consolidation Range Breakout strategy using MetaQuotes Language 5 (MQL5), the programming language for MetaTrader 5 (MT5). In the fast-paced world of financial trading, strategies that capitalize on market patterns and behaviors are crucial for success, and one such strategy is the Consolidation Range Breakout, which focuses on identifying periods of market consolidation and trading the subsequent breakouts. This strategy is particularly effective in capturing significant price movements that follow a period of low volatility. We will craft the Expert Advisor with a Consolidation Range Breakout strategy via the following topics:
- Strategy Overview
- Strategy Blueprint
- Implementation in MetaQuotes Language 5 (MQL5)
- Backtest Results
- Conclusion
By the end of this article, you will have a comprehensive understanding of how to develop and implement a robust EA based on the Consolidation Range Breakout strategy in MQL5, equipping you with the knowledge to enhance your trading toolkit. We will extensively use MetaQuotes Language 5 (MQL5) as our base Integrated Development Environment (IDE) coding environment, and execute the files on the MetaTrader 5 (MT5) trading terminal. Thus, having the versions mentioned above will be of prime importance. Let's get rolling.
Strategy Overview
To easily understand the consolidation range breakout strategy, let us divide it into chunks.
- Consolidation Range explanation
A consolidation range, also known as a trading range, is a period in which the price of a financial instrument oscillates horizontally within a defined range without exhibiting strong upward or downward movements. This period is marked by low volatility, with the price oscillating between a well-defined support level (the lower boundary) and a resistance level (the upper boundary). Traders frequently use this phase to forecast potential breakout points, where the price may move enormously in one direction once the consolidation period ends.
- How the Strategy Works
The Consolidation Range Breakout strategy leverages the predictable behavior of prices during consolidation periods to identify and trade breakouts. Here’s how it works:
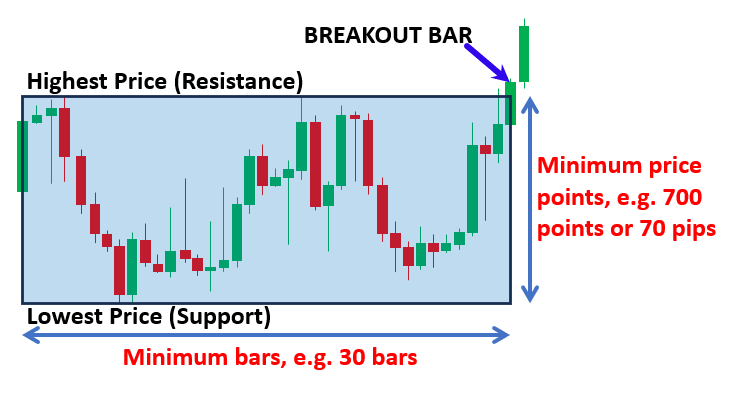
Identify the Consolidation Range: The first step is to detect a consolidation range by examining recent price movements. This involves identifying the highest and lowest prices over a specific number of bars (candlesticks) to define the upper and lower boundaries of the range, which typically act as the resistance and support levels of the range. Timeframe selection here is not static as any chart can be used for the identification process, thus, you need to select a chart timeframe that suits your trading style.
Monitor for Breakouts: Once the consolidation range is established, the strategy monitors for price movements that breach either the upper or lower boundaries of the range. A breakout occurs when the price closes above the resistance level or below the support level. Other traders consider scalping the same candle that breaks the range, that is, once the price falls below or rises above the extremum range, they consider a breakout already.
Trade the Breakout: Upon detecting a breakout, the strategy initiates a trade in the direction of the breakout. If the price breaks above the resistance level, a buy order is placed. Conversely, if the price breaks below the support level, a sell order is placed. Again, some traders consider waiting for a retracement, that is, after a breakout, for further confirmation, they wait for the price to revisit the range and once breaking out again in the same direction as the initial, they infiltrate the market. For use, we will not consider the retracement option.
- Strategy Implementation
Implementing the Consolidation Range Breakout strategy will involve several steps:
Define the Range Parameters: Determine the number of bars to analyze for identifying the consolidation range and set the criteria for what constitutes a breakout. A range of bars and a target range in price is determined and set. For example, for a consolidation range to be valid, at least 10 bars within a price range of 700 points or 70 pips is required.
Develop the Detection Logic: Write code to scan historical price data, identify the highest high and lowest low within the specified range, and plot these levels on the chart. The code should be clear with conditions that have to be met for the consolidation range to be considered valid, and assumptions made have to be outlined clearly to avoid ambiguity.
Monitor Real-Time Price Data: Continuously monitor incoming price data to detect breakouts as soon as they occur. On every tick, monitoring has to be made, and if not necessary, then on every new candlestick generation.
Execute Trades: Implement trade execution logic to place buy or sell orders when a breakout is detected, including setting appropriate stop-loss and take-profit levels to manage risk.
Optimize and Test: Backtest the strategy using historical data to optimize parameters and ensure its effectiveness before deploying it in live trading. This will help you identify the best parameters and pinpoint key features that need to be improved or filtered to enhance and improve the system.
By following these steps, we can create a powerful tool to exploit market conditions using the Consolidation Range Breakout strategy. In a nutshell, here are some of the parameters that are needed for the creation of the strategy as well as an overview of what is typically required.
Strategy Blueprint
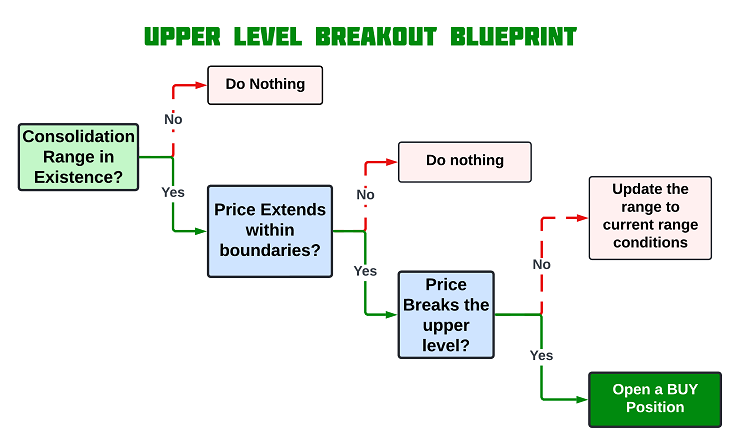
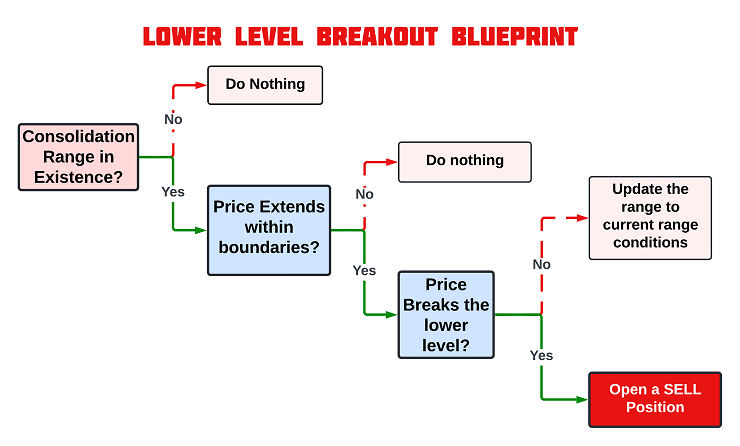
To easily understand the concept that we have relayed, let us visualize it in a blueprint.
- Consolidation Range upper-level breakout:
- Consolidation Range lower-level breakout:
Implementation in MetaQuotes Language 5 (MQL5)
After learning the basic steps and approach that need to be taken to craft the consolidation range breakout strategy, let us then automate the theory and craft an Expert Advisor (EA) in MetaQuotes Language 5 (MQL5) for MetaTrader 5 (MT5).
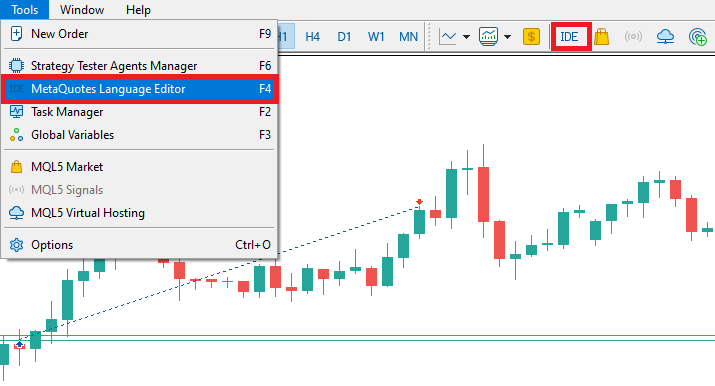
To create an expert advisor (EA), on your MetaTrader 5 terminal, click the Tools tab and check MetaQuotes Language Editor, or simply press F4 on your keyboard. Alternatively, click the IDE (Integrated Development Environment) icon on the tools bar. This will open the MetaQuotes Language Editor environment, which allows the writing of trading robots, technical indicators, scripts, and libraries of functions.
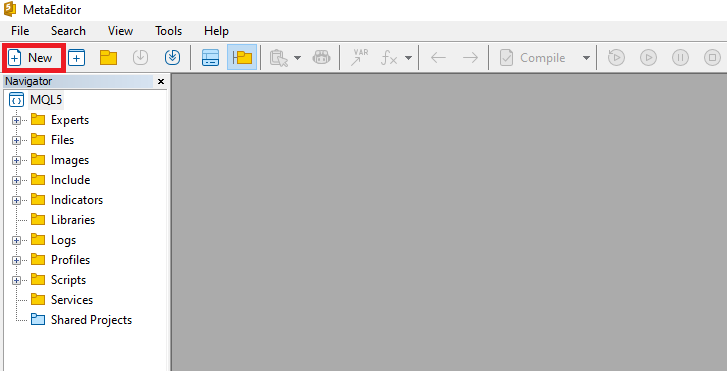
Once the MetaEditor is opened, on the tools bar, navigate to the File tab and check New File, or simply press CTRL + N, to create a new document. Alternatively, you can click on the New icon on the tools tab. This will result in a MQL Wizard pop-up.
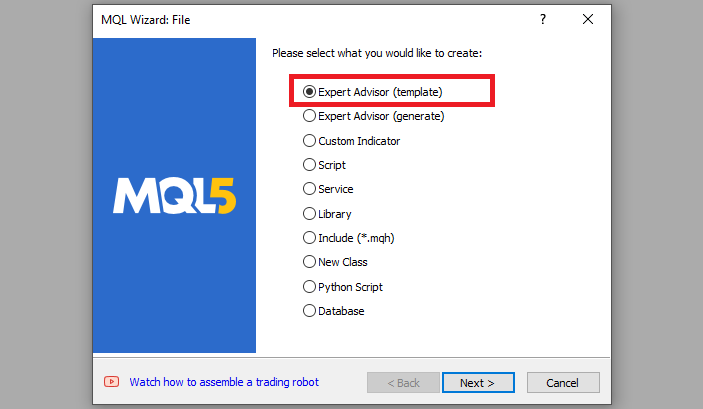
On the Wizard that pops, check Expert Advisor (template) and click Next.
On the general properties of the Expert Advisor, under the name section, provide your expert's file name. Note that to specify or create a folder if it doesn't exist, you use the backslash before the name of the EA. For example, here we have "Experts\" by default. That means that our EA will be created in the Experts folder and we can find it there. The other sections are pretty much straightforward, but you can follow the link at the bottom of the Wizard to know how to precisely undertake the process.
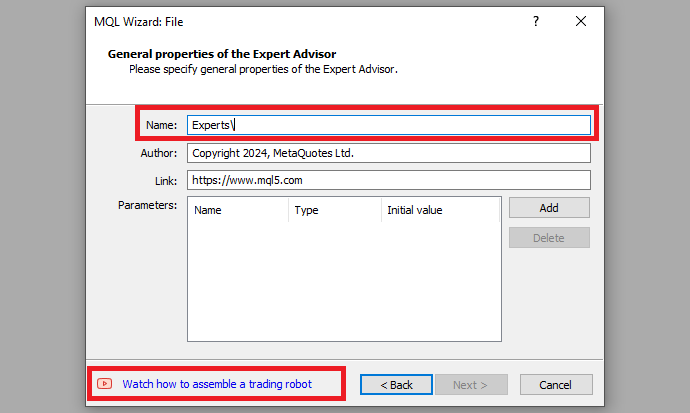
After providing your desired Expert Advisor file name, click on Next, click Next, and then click Finish. After doing all that, we are now ready to code and program our strategy.
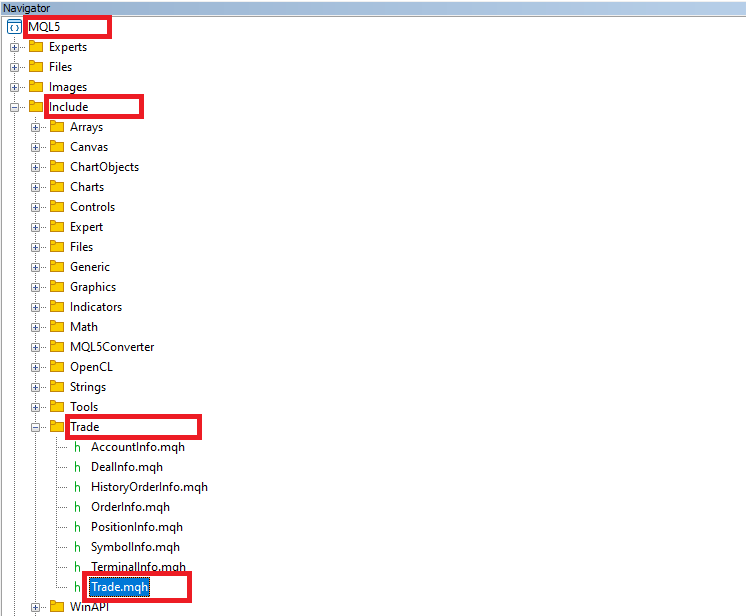
First, we include a trade instance by using #include at the beginning of the source code. This gives us access to the CTrade class, which we will use to create a trade object. This is crucial as we need it to open trades.
#include <Trade/Trade.mqh> // Include the trade library
CTrade obj_Trade; // Create an instance of the CTrade class
The preprocessor will replace the line #include <Trade/Trade.mqh> with the content of the file Trade.mqh. Angle brackets indicate that the Trade.mqh file will be taken from the standard directory (usually it is terminal_installation_directory\MQL5\Include). The current directory is not included in the search. The line can be placed anywhere in the program, but usually, all inclusions are placed at the beginning of the source code, for a better code structure and easier reference. Declaration of the obj_Trade object of the CTrade class will give us access to the methods contained in that class easily, thanks to the MQL5 developers.
Since we will need to draw a range graphically in the chart, we will need its name. We just need and will be using the same rectangle range object and thus, a single object will be used for the visualization and once plotted, we will just update its settings without having to redraw it again. To achieve a static name that can easily be recalled and reused instantly, we define it as follows.
#define rangeNAME "CONSOLIDATION RANGE" // Define the name of the consolidation range
We use the #define keyword to define a macro named "rangeNAME" with the value "CONSOLIDATION RANGE" to easily store our consolidation range name, instead of having to repeatedly retype the name on every instance we create the level, significantly saving us time and reducing the chances of wrongly providing the name. So basically, macros are used for text substitution during compilation.
Again, we will need to store the coordinates of the rectangle that will be plotted. These are two dimensions (2D) ordinates of the format (x, y), used to explicitly identify the first and second locations documented as x1,y1, and x2,y2 respectively. On a price chart, the x-axis is represented by the date and time scale, while the y-axis is represented by the price scale. For easier understanding and referencing, let us have a visual illustration.
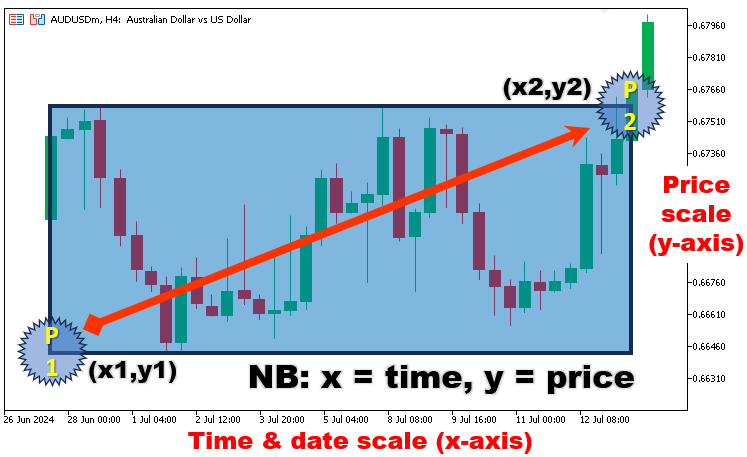
From the image presented, it is now clear why we need the coordinates for the rectangle object plotting. Below is the logic that is used to ensure we store the range coordinates without having to declare them every time we update the coordinates.
datetime TIME1_X1, TIME2_Y2; // Declare datetime variables to hold range start and end times
double PRICE1_Y1, PRICE2_Y2; // Declare double variables to hold range high and low prices
Here, we declare two variables of the data type datetime. The method we use here is called single data-type declaration which declares multiple variables of the same data type. This is a shorthand way of declaring multiple variables of the same type in a single statement. It is useful as it maintains conciseness in that it reduces the number of lines of code and groups related variables together, making it easier to understand that they are of the same type and potentially used for similar purposes while maintaining consistency. You could also write them as follows:
datetime TIME1_X1;
datetime TIME2_Y2;
The "TIME1_X1" variable holds the first coordinate's time value along the x-axis while "TIME2_Y2" holds the second coordinate's time value still along the x-axis. Similarly, we declare the price coordinates as follows:
double PRICE1_Y1, PRICE2_Y2; // Declare double variables to hold range high and low prices
We will need to constantly scan the market on every new bar to assess for the establishment of a consolidation range caused by low volatility. Thus, two variables will be needed to store the flags when the range does exist and when the price is within the range.
bool isRangeExist = false; // Flag to check if the range exists
bool isInRange = false; // Flag to check if we are currently within the range
Here, we define two boolean variables named "isRangeExist" and "isInRange" and initialize them. The "isRangeExist" variable will serve as a flag to indicate whether a consolidation range has been identified and plotted on the chart. We initialize it to false because no range has been established at the start. Again, the "isInRange" variable, also initialized to false, is used to determine whether the current market price is within the identified consolidation range. These flags are crucial for the logic of the Expert Advisor, as they help manage the state of the range detection and breakout monitoring process, ensuring that actions are taken only when appropriate conditions are met.
On the global scope still, we will need to define the range minimum number of candlesticks to be considered as well as the range size in points. This is as we already did in the theoretical part, we stated these parameters to be crucial in maintaining the validity of the consolidation range and ensuring that we have meaningful consolidation ranges.
int rangeBars = 10; // Number of bars to consider for the range
int rangeSizePoints = 400; // Maximum range size in points
Again, we declare and initialize two integer variables, "rangeBars" and "rangeSizePoints". The variable "rangeBars" is set to 10, to specify the number of bars (or candlesticks) we will analyze to determine the consolidation range. This means we look back over the last 10 bars to find the highest high and lowest low to define our range. The variable "rangeSizePoints" is set to 400, which defines the maximum allowable size of the consolidation range in points. If the range between the highest and lowest prices within these 10 bars exceeds 400 points, it is not considered a valid consolidation range. These parameters are essential for setting the criteria of the range and ensuring we identify meaningful consolidation periods in the price data.
Finally, since we will open positions, we define the stop loss and take profit points.
double sl_points = 500.0; // Stop loss points
double tp_points = 500.0; // Take profit points
That is all that we need on the global scope. You could maybe be wondering what is a global scope. A global scope simply refers to an area of a program where variables, functions, and other elements are accessible throughout the entire code, outside of any functions or blocks. When a variable or function is declared in the global scope, it can be accessed and modified by any part of the program.
All of our activities will be executed on the OnTick event handler. This will be pure price action and we will heavily rely on this event handler. Thus, let us have a look at the parameters the function takes beside it since it is the heart of this code.
//+------------------------------------------------------------------+
//| Expert tick function                                             |
//+------------------------------------------------------------------+
void OnTick(){
//---

}
As it is already seen, this is a simple yet crucial function that does not take any arguments or return anything. It is just a void function, meaning it does not have to return anything. This function is used in Expert Advisors and is executed when there is a new tick, that is, a change in price quotes for the particular commodity.
Now that we have seen that the OnTick function is generated on every change in price quotes, we need to define some control logic that will enable us to run the code to be executed once per bar and not on every tick, at least to avoid unnecessary code runs, hence saving the device memory. That will be necessary when looking for consolidation range setups. We don't need to search for the setups on each tick, yet we will always get the same results, provided we are still on the same candlestick. Here is the logic:
   int currBars = iBars(_Symbol,_Period); // Get the current number of bars
   static int prevBars = currBars; // Static variable to store the previous number of bars
   static bool isNewBar = false; // Static flag to check if a new bar has appeared
   if (prevBars == currBars){isNewBar = false;} // Check if the number of bars has not changed
   else {isNewBar = true; prevBars = currBars;} // If the number of bars has changed, set isNewBar to true and update prevBars
Firstly, we declare an integer variable "currBars" which stores the calculated number of current bars on the chart for the specified trading symbol and period or rather timeframe as you might have heard it. This is achieved by the use of the iBars function, which takes just two arguments, that is, symbol and period. Secondly, we declare a static integer variable "prevBars" and initialize it with the current number of bars. The static keyword ensures that variable "prevBars" retains its value between function calls, effectively remembering the number of bars from the previous tick. Thirdly, we declare a static boolean variable "isNewBar" and initialize it to false as well. This variable will help us track whether a new bar has appeared. Next, we use a conditional statement to check whether the current number of bars is equal to the previous number of bars. If they are equal, it means that no new bar has formed, and so we set the flag for new bar generation to false. Otherwise, if previous bars are not equal to current bars, it means the number of bars has increased, indicating that a new bar has appeared. Thus, we set the flag for new bar generation to true and updated the value of previous bars to the current bars.
Now, for each bar that is generated and we do not have a consolidation range, we need to scan the predefined bars for a potential low volatility period.
   if (isRangeExist == false && isNewBar){ // If no range exists and a new bar has appeared

      ...

   }
We check if "isRangeExist" is false, meaning that no range has yet been established, and "isNewBar" is true, meaning that a new bar has appeared. This ensures that we only proceed if a consolidation range hasn't been identified yet and a new bar has formed.
To determine the coordinates of the first point of our rectangle object to be plotted on the chart, we need extremum resistance levels, that is the time of the last bar in our predefined bar scan range and the price of the highest bar within the range.
      TIME1_X1 = iTime(_Symbol,_Period,rangeBars); // Get the start time of the range
      int highestHigh_BarIndex = iHighest(_Symbol,_Period,MODE_HIGH,rangeBars,1); // Get the bar index with the highest high in the range
      PRICE1_Y1 = iHigh(_Symbol,_Period,highestHigh_BarIndex); // Get the highest high price in the range
First, we set the start time of the range by using the iTime function, which returns the opening time of a specific bar for the given symbol and period. The function takes three input parameters or arguments, where _Symbol is the trading symbol (e.g., "AUDUSD"), _Period is the time frame (e.g., PERIOD_M1 for 1-minute bars), and "rangeBars" is the index of the bar that is the specified number of periods ago. The result is stored in "TIME1_X1", marking the start time of our consolidation range.
Next, we find the bar with the highest high within the specified range by using the iHighest function, which returns the index of the bar that has the highest high price within a specified number of bars. The function takes five arguments. We do not have to explain again what the first two parameters do since we have already done it. The third parameter, which is "MODE_HIGH", is used to indicate that we are looking for the highest high price. The fourth, "rangeBars" specifies the number of bars to consider in the scan analysis, and lastly, 1 means we start looking from the bar before the current bar which is being formed. Technically, the bar currently under formation is index 0, and the one that precedes it is at index 1. The resulting index is stored in the "highestHigh_BarIndex" integer variable.
Finally, we retrieve the highest high price from that bar using the iHigh function, which returns the high price of a specific bar. The function takes three input parameters, where the first two are particularly straightforward. The third argument, "highestHigh_BarIndex" is the index of the bar determined in the previous step. The high price is stored in "PRICE1_Y1". These variables allow us to define the starting point and the highest point of the consolidation range, which are critical for plotting the range and later detecting breakouts.
To get the second coordinates, a similar approach to the one used to determine the first point ordinates is used.
      TIME2_Y2 = iTime(_Symbol,_Period,0); // Get the current time
      int lowestLow_BarIndex = iLowest(_Symbol,_Period,MODE_LOW,rangeBars,1); // Get the bar index with the lowest low in the range
      PRICE2_Y2 = iLow(_Symbol,_Period,lowestLow_BarIndex); // Get the lowest low price in the range
The difference in the code is that first, our time is linked to the current bar, which is at index 0. Secondly, to get the index of the lowest bar within the predefined bar range, we use the iLowest function and use "MODE_LOW" to indicate that we are looking for the lowest low price. Finally, the iLow function is used to get the price for the lowest bar. In a nutshell, here is a visualization of the required coordinates if we were to take an arbitrary chart.
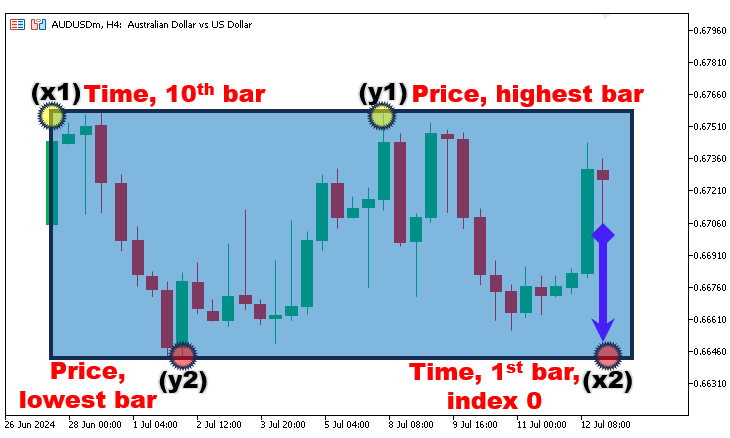
Now that we have consolidation range points, we need to check for their validity, to ensure that the conditions for a valid range are met, as earlier stated in the introductory part, before they are considered and plotted in the chart.
isInRange = (PRICE1_Y1 - PRICE2_Y2)/_Point <= rangeSizePoints; // Check if the range size is within the allowed points
We calculate the difference between the highest high price (PRICE1_Y1) and the lowest low price (PRICE2_Y2) within the range, and then convert the difference into points by dividing it by the size of one point, _Point. For example, we could have 0.66777 as the highest price value and 0.66773 as the lowest price value. Their mathematical difference is 0.66777 - 0.66773 = 0.00004. The point value of the assumed symbol would be 0.00001. Now dividing the result by the point value would be 0.00004/0.00001 = 4 points. This value is then compared to "rangeSizePoints", which is the maximum allowable range size defined in points.
Finally, we check if there is a valid range that has been identified and if so, we plot it to the chart and inform of a successful creation.
      if (isInRange){ // If the range size is valid
         plotConsolidationRange(rangeNAME,TIME1_X1,PRICE1_Y1,TIME2_Y2,PRICE2_Y2); // Plot the consolidation range
         isRangeExist = true; // Set the range exist flag to true
         Print("RANGE PLOTTED"); // Print a message indicating the range is plotted
      }
Here, we check if the identified consolidation range is valid by evaluating the "isInRange" variable. If the variable flag is true, indicating that the range size is within acceptable bounds, we proceed to plot the consolidation range on the chart. To do the plotting, we call the "plotConsolidationRange" function with the input parameters "rangeNAME", "TIME1_X1", "PRICE1_Y1", "TIME2_Y2", and "PRICE2_Y2", which creates a visual representation of the range. After successfully plotting the range, we set the "isRangeExist" flag to true to indicate that a valid range has been identified and plotted. Additionally, we print the message "RANGE PLOTTED" to the terminal for logging purposes, confirming that the consolidation range has been successfully visualized.
The code snippet for the function responsible for either plotting or updating the consolidation range is as follows:
//+------------------------------------------------------------------+
//| Function to plot the consolidation range                         |
//| rangeName - name of the range object                             |
//| time1_x1 - start time of the range                               |
//| price1_y1 - high price of the range                              |
//| time2_x2 - end time of the range                                 |
//| price2_y2 - low price of the range                               |
//+------------------------------------------------------------------+
void plotConsolidationRange(string rangeName,datetime time1_x1,double price1_y1,
   datetime time2_x2,double price2_y2){
   if (ObjectFind(0,rangeName) < 0){ // If the range object does not exist
      ObjectCreate(0,rangeName,OBJ_RECTANGLE,0,time1_x1,price1_y1,time2_x2,price2_y2); // Create the range object
      ObjectSetInteger(0,rangeName,OBJPROP_COLOR,clrBlue); // Set the color of the range
      ObjectSetInteger(0,rangeName,OBJPROP_FILL,true); // Enable fill for the range
      ObjectSetInteger(0,rangeName,OBJPROP_WIDTH,5); // Set the width of the range
   }
   else { // If the range object exists
      ObjectSetInteger(0,rangeName,OBJPROP_TIME,0,time1_x1); // Update the start time of the range
      ObjectSetDouble(0,rangeName,OBJPROP_PRICE,0,price1_y1); // Update the high price of the range
      ObjectSetInteger(0,rangeName,OBJPROP_TIME,1,time2_x2); // Update the end time of the range
      ObjectSetDouble(0,rangeName,OBJPROP_PRICE,1,price2_y2); // Update the low price of the range
   }
   ChartRedraw(0); // Redraw the chart to reflect changes
}
First, we define a void function named "plotConsolidationRange" and pass to it 5 parameters or arguments, that is the range name, the first point 2-coordinates, and the second point 2-coordinates. We then use a conditional statement to check whether the object does exist by use of the ObjectFind function, which returns a negative integer in case the object is not found. If that is the case, we proceed to create the object identified as OBJ_RECTANGLE, to the current time and the specified prices, for the first and second coordinates. We then set its color, area fill, and width. If the object is found, we just update its time and prices to the specified values and redraw the chart for the current changes to apply. Modifier value 0 is used to point to the first coordinate and 1 to the second coordinate.
This is all that we need to plot the identified consolidation range on the chart. The full source code responsible for that is as follows:
//+------------------------------------------------------------------+
//| Expert tick function                                             |
//+------------------------------------------------------------------+
void OnTick(){
//---

   int currBars = iBars(_Symbol,_Period); // Get the current number of bars
   static int prevBars = currBars; // Static variable to store the previous number of bars
   static bool isNewBar = false; // Static flag to check if a new bar has appeared
   if (prevBars == currBars){isNewBar = false;} // Check if the number of bars has not changed
   else {isNewBar = true; prevBars = currBars;} // If the number of bars has changed, set isNewBar to true and update prevBars

   if (isRangeExist == false && isNewBar){ // If no range exists and a new bar has appeared
      TIME1_X1 = iTime(_Symbol,_Period,rangeBars); // Get the start time of the range
      int highestHigh_BarIndex = iHighest(_Symbol,_Period,MODE_HIGH,rangeBars,1); // Get the bar index with the highest high in the range
      PRICE1_Y1 = iHigh(_Symbol,_Period,highestHigh_BarIndex); // Get the highest high price in the range

      TIME2_Y2 = iTime(_Symbol,_Period,0); // Get the current time
      int lowestLow_BarIndex = iLowest(_Symbol,_Period,MODE_LOW,rangeBars,1); // Get the bar index with the lowest low in the range
      PRICE2_Y2 = iLow(_Symbol,_Period,lowestLow_BarIndex); // Get the lowest low price in the range

      isInRange = (PRICE1_Y1 - PRICE2_Y2)/_Point <= rangeSizePoints; // Check if the range size is within the allowed points

      if (isInRange){ // If the range size is valid
         plotConsolidationRange(rangeNAME,TIME1_X1,PRICE1_Y1,TIME2_Y2,PRICE2_Y2); // Plot the consolidation range
         isRangeExist = true; // Set the range exist flag to true
         Print("RANGE PLOTTED"); // Print a message indicating the range is plotted
      }
   }

}
Upon compilation, here are the results we get:
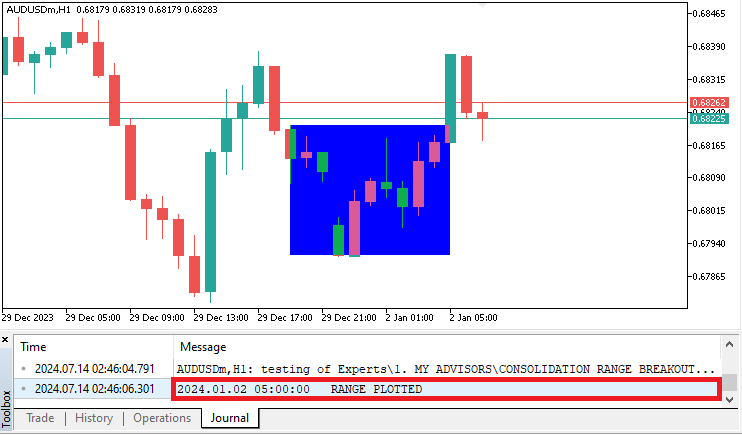
You can see that we plot the range within the predefined points and inform of the plot instance in the journal. If you do not need the range to be filled, all you have to do is set the fill property flag to false. That will draw the rectangle's line property, and the width will be enabled and applied as defined. Below is the logic:
ObjectSetInteger(0,rangeName,OBJPROP_FILL,false); // Disable fill for the range
These would result in the following range:
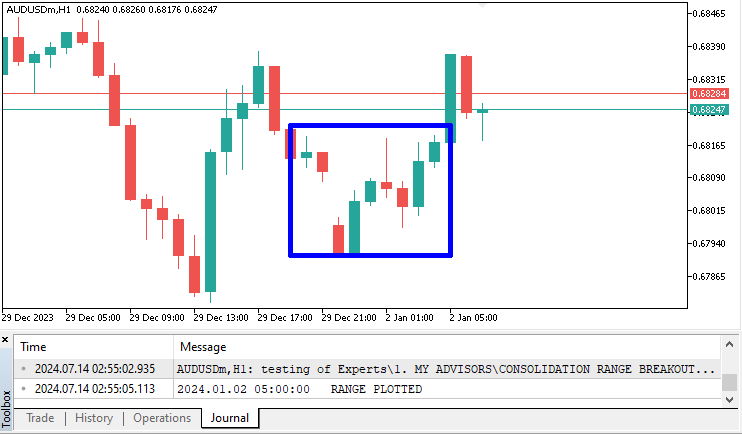
For the article, we will use a filled range. Now that we are certain we can establish a range, we then need to continue and develop a logic that will monitor for either range breakout and open positions respectively, or range extensions and update the range coordinates to the new values.
Next, we just identify the instances of the breakout as described in the theory part, and if there exists an instance, we open market positions respectively. This requires to be done on every tick, so we do it without the new bars restriction. We first declare the Ask and Bid prices that we will use to open the positions once the respective conditions are met. Note that this needs to also be done on every tick so that we get the latest price quotes.
   double Ask = NormalizeDouble(SymbolInfoDouble(_Symbol,SYMBOL_ASK),_Digits); // Get and normalize the current Ask price
   double Bid = NormalizeDouble(SymbolInfoDouble(_Symbol,SYMBOL_BID),_Digits); // Get and normalize the current Bid price
Here, we declare the double data type variables for storing the recent prices and normalize them to the digits of the symbol currency by rounding the floating point number to maintain accuracy.
Since we scan for the breakouts on every tick, we will need logic to ensure that we only stress the program if a range does exist and that we are in the range. Most of the time, the market will be in medium to high volatility and thus the frequency of appearance of the consolidation range will be limited, and if the range is been identified and is within the chart proximities, the price will eventually break out of the range. When any of these conditions are true, there will be no need of having to check for breakouts or further range updates. We simply chill and await for another range to be identified.
   if (isRangeExist && isInRange){ // If the range exists and we are in range

      ...

   }
Here, we check if the consolidation range exists "isRangeExist" and if the current price is within this range "isInRange". If both conditions are true, we proceed to calculate the potential breakout prices.
      double R_HighBreak_Prc = (PRICE2_Y2+rangeSizePoints*_Point); // Calculate the high breakout price
      double R_LowBreak_Prc = (PRICE1_Y1-rangeSizePoints*_Point); // Calculate the low breakout price
To find the high breakout price, we add the maximum allowable range size in points to the lowest low price. This calculation is done by multiplying the range size points by the point size and adding the result to the variable "PRICE2_Y2", storing the final value in a double data type variable named "R_HighBreak_Prc". For example, still assuming that our lowest low price is 0.66773, we have range size points as 400 and point value as 0.00001. Multiplying 400 by 0.00001 we get (400 * 0.00001) 0.00400. Adding this value to the price we have (0.66773 + 0.00400) 0.67173. This final computed result is the value that is stored in the high break price and we will use the value for comparison with the market price to define a break if the asking price goes above this price. Similarly, to determine the low breakout price, we subtract the maximum allowable range size in points from the highest high price. This is done by multiplying the range size points by point size and subtracting the result from the highest high price, storing the final value in the "R_LowBreak_Prc" variable.
Then we proceed to check for a breakout and if so, we open the respective positions. First, let us handle the situation where the market price breaks above the defined high breakout price, signaling a buying opportunity.
      if (Ask > R_HighBreak_Prc){ // If the Ask price breaks the high breakout price
         Print("BUY NOW, ASK = ",Ask,", L = ",PRICE2_Y2,", H BREAK = ",R_HighBreak_Prc); // Print a message to buy
         isInRange = false; isRangeExist = false; // Reset range flags
         if (PositionsTotal() > 0){return;} // Exit the function
         obj_Trade.Buy(0.01,_Symbol,Ask,Bid-sl_points*_Point,Bid+tp_points*_Point);
         return; // Exit the function
      }
First, we check if the current Ask price is greater than the high breakout price. If this condition is true, it indicates that the market price has broken above the upper limit of the consolidation range. In response, we print a message to the terminal, logging the event and providing context for the buy signal by including the current Ask price, the lowest low price of the range, and the high breakout price. We then reset the "isInRange" and "isRangeExist" flags to false, indicating that the current consolidation range is no longer valid and preventing further decisions based on this range. Next, we check if there are any existing positions using the PositionsTotal function and exit the function early if there are, to avoid opening multiple positions simultaneously. If there are no existing positions, we proceed to place a buy order using the Buy method of the CTrade object "obj_Trade", specifying the trade volume, symbol, opening price as Ask price, stop-loss price, and take-profit price. Finally, we exit the function to complete the trade initiation process, ensuring no further code execution within this tick.
To handle the situation where the market price breaks below the defined low breakout price, signaling a selling opportunity, similar control logic is adopted as shown in the code snippet below.
      else if (Bid < R_LowBreak_Prc){ // If the Bid price breaks the low breakout price
         Print("SELL NOW"); // Print a message to sell
         isInRange = false; isRangeExist = false; // Reset range flags
         if (PositionsTotal() > 0){return;} // Exit the function
         obj_Trade.Sell(0.01,_Symbol,Bid,Ask+sl_points*_Point,Ask-tp_points*_Point);
         return; // Exit the function
      }
Upon compilation, this is what we get.
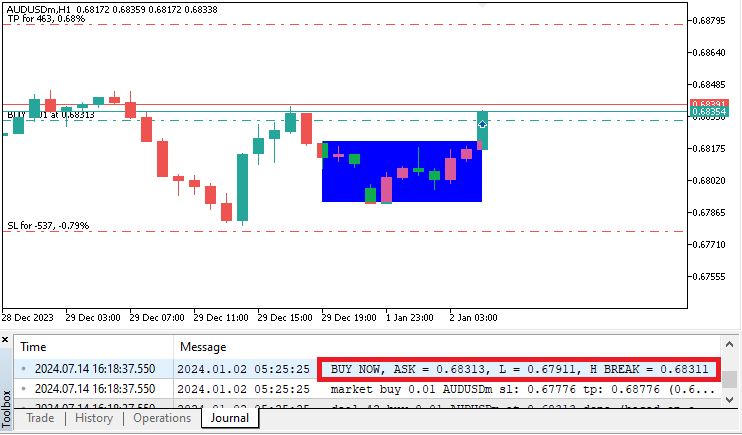
From the image, it is clear that once we break out of the range, in this case, the high price, we open a buy position, with a stop loss and take profit respectively. The entry conditions and trade levels are completely dynamic and you can use one you deem fit or that follows your trading style. For example, you could have levels within the range of extremums or risk-to-reward ratio. For confirmation, you can see that the asking price is 0.68313, and the low price is 0.67911, which makes the high break price to be (0.67911 + 0.00400) 0.68311. Mathematically, the current asking price is 0.68313, which is above the computed high price of 0.68311, which fulfills our high-range breakout conditions, leading to a buy position being initiated at the current asking price.
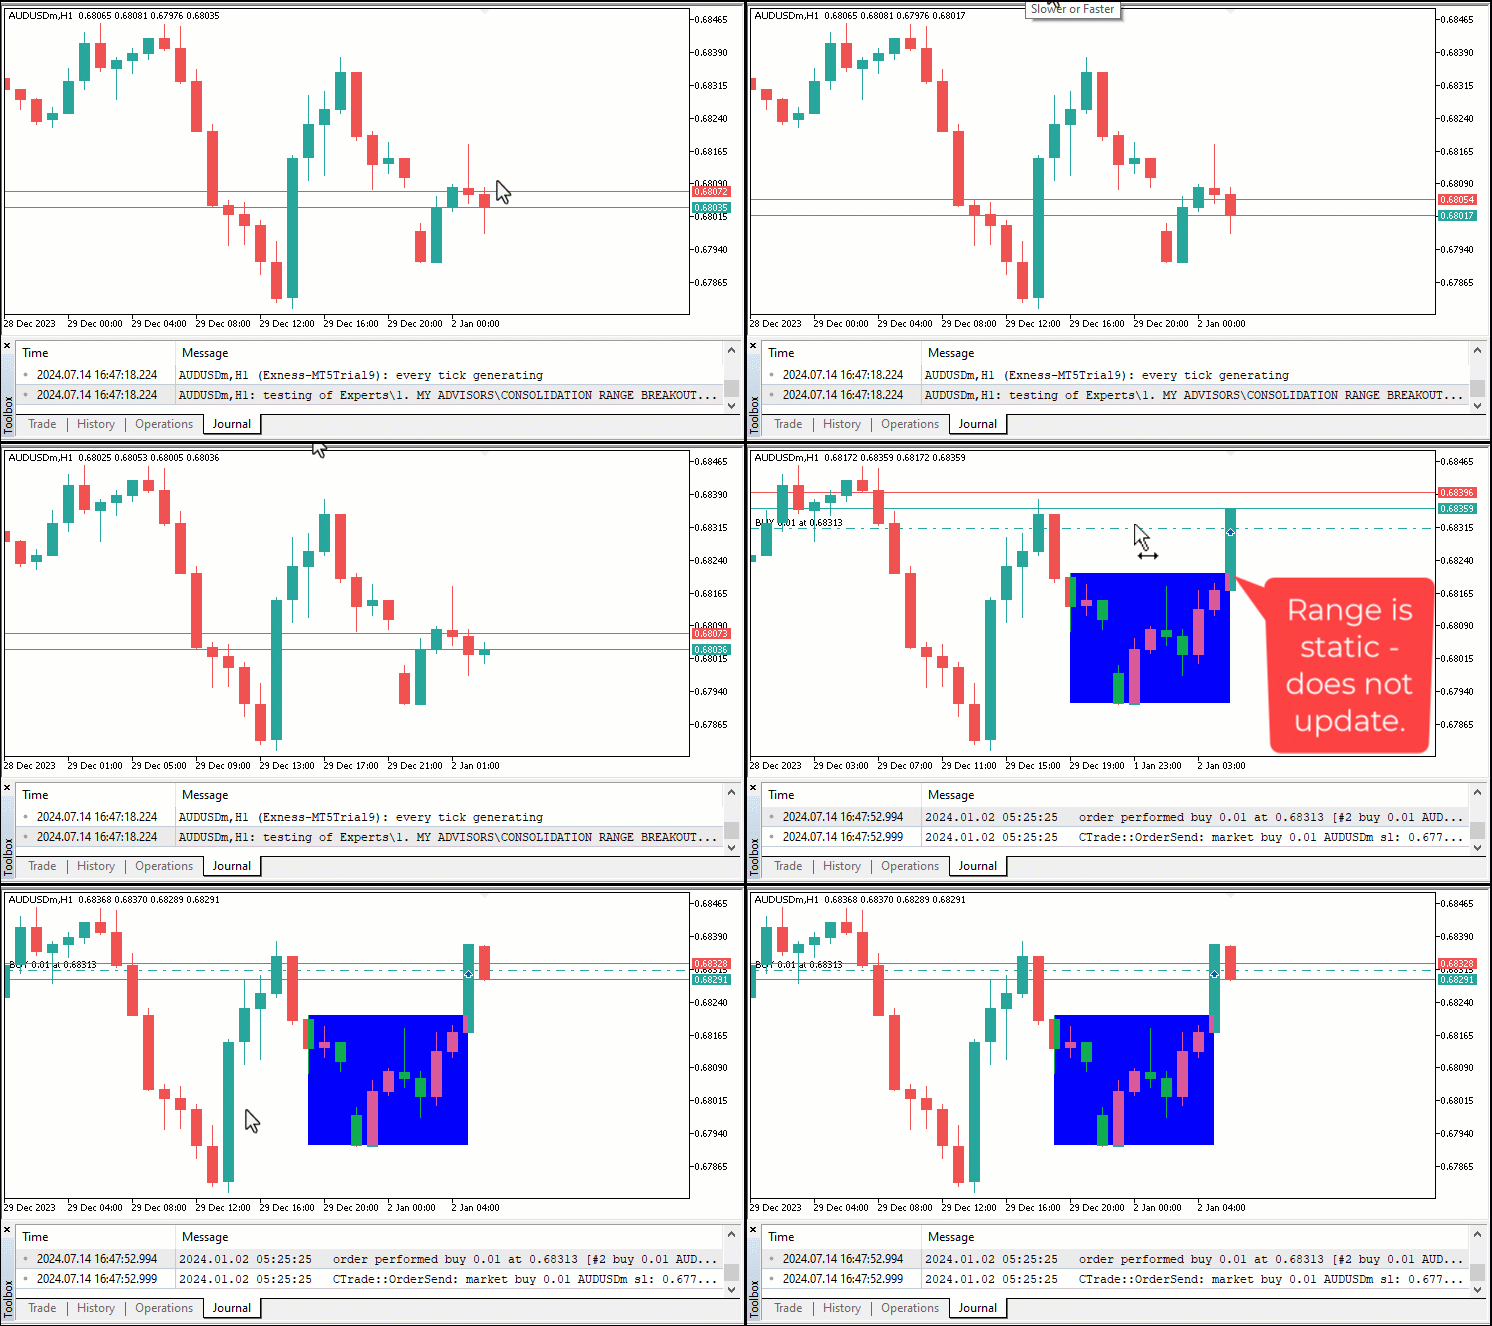
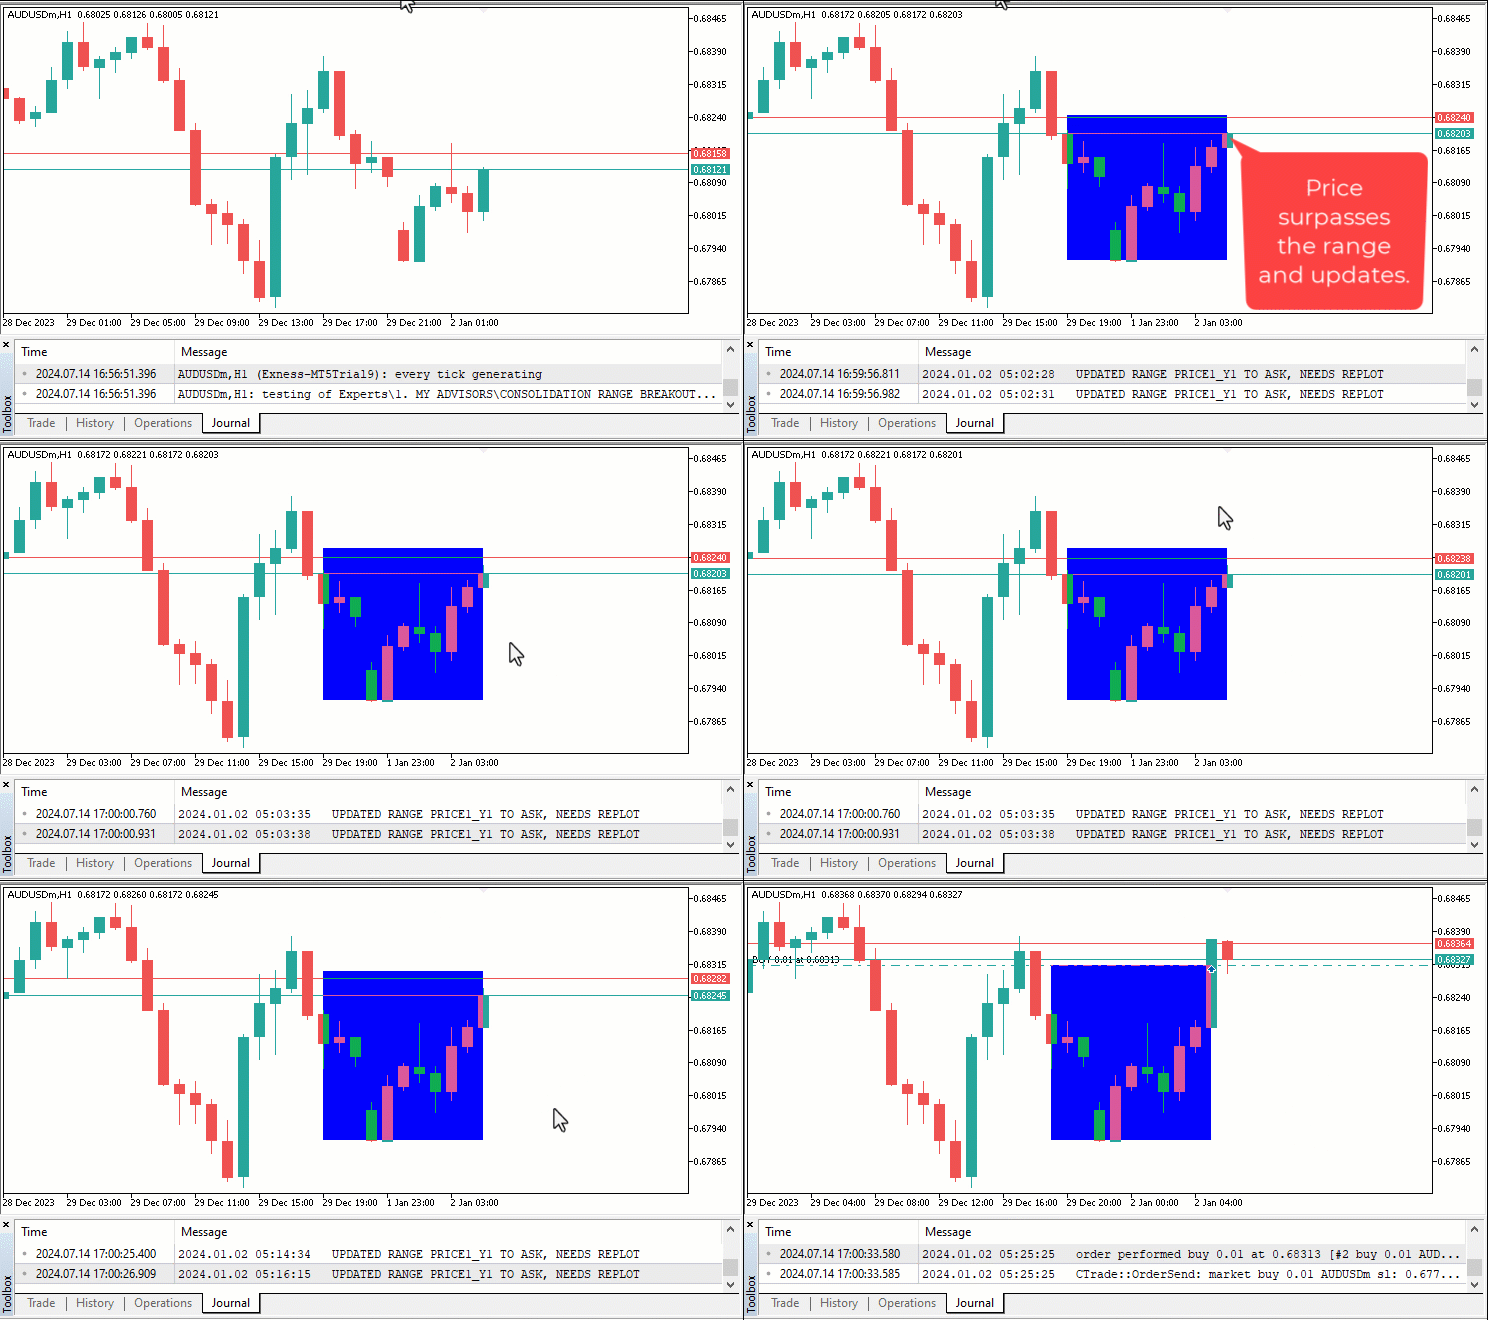
Currently, the range is static and does not move. That is, the rectangle is fixed. You can see that even if we establish the range correctly, the range object does not update. We thus need to update the range if the price surpasses the defined object range price. To breathe life into the rectangle, let us consider a logic that will always update the extension of the range by the bars that have been generated. First, let us consider the scenario where the current Ask price surpasses the previously recorded high price within the consolidation range. When this condition is met, it indicates that the upper boundary of the consolidation range needs to be updated to reflect the new highest price. This is achieved via the code snippet below.
      if (Ask > PRICE1_Y1){ // If the Ask price is higher than the current high price
         PRICE1_Y1 = Ask; // Update the high price to the Ask price
         TIME2_Y2 = iTime(_Symbol,_Period,0); // Update the end time to the current time
         Print("UPDATED RANGE PRICE1_Y1 TO ASK, NEEDS REPLOT"); // Print a message indicating the range needs to be replotted
         plotConsolidationRange(rangeNAME,TIME1_X1,PRICE1_Y1,TIME2_Y2,PRICE2_Y2); // Replot the consolidation range
      }
If the asking price is above the previously recorded high price, we set the "PRICE1_Y1" to the current Ask price. Concurrently, we update the end time of the range "TIME2_Y2" to the current time, obtained using the iTime function and passing the target bar index as the current bar, 0. To keep track of these adjustments and ensure clarity, we print a message to the terminal indicating that the range has been updated and requires replotting. Subsequently, we call the "plotConsolidationRange" function with the updated parameters, including the new high price and current time, to visually reflect the changes on the chart.
To handle the scenario where the current Bid price falls below the previously recorded low price within the consolidation range, an indication that the lower boundary of the consolidation range needs to be updated to reflect the new lowest price, a similar approach is adopted.
      else if (Bid < PRICE2_Y2){ // If the Bid price is lower than the current low price
         PRICE2_Y2 = Bid; // Update the low price to the Bid price
         TIME2_Y2 = iTime(_Symbol,_Period,0); // Update the end time to the current time
         Print("UPDATED RANGE PRICE2_Y2 TO BID, NEEDS REPLOT"); // Print a message indicating the range needs to be replotted
         plotConsolidationRange(rangeNAME,TIME1_X1,PRICE1_Y1,TIME2_Y2,PRICE2_Y2); // Replot the consolidation range
      }
To track these changes, let us have an instance where we don't have the updates and where we have the updates in a Graphics Interchange Format (GIF) to easily make a comparison.
Before Update:
After Update:
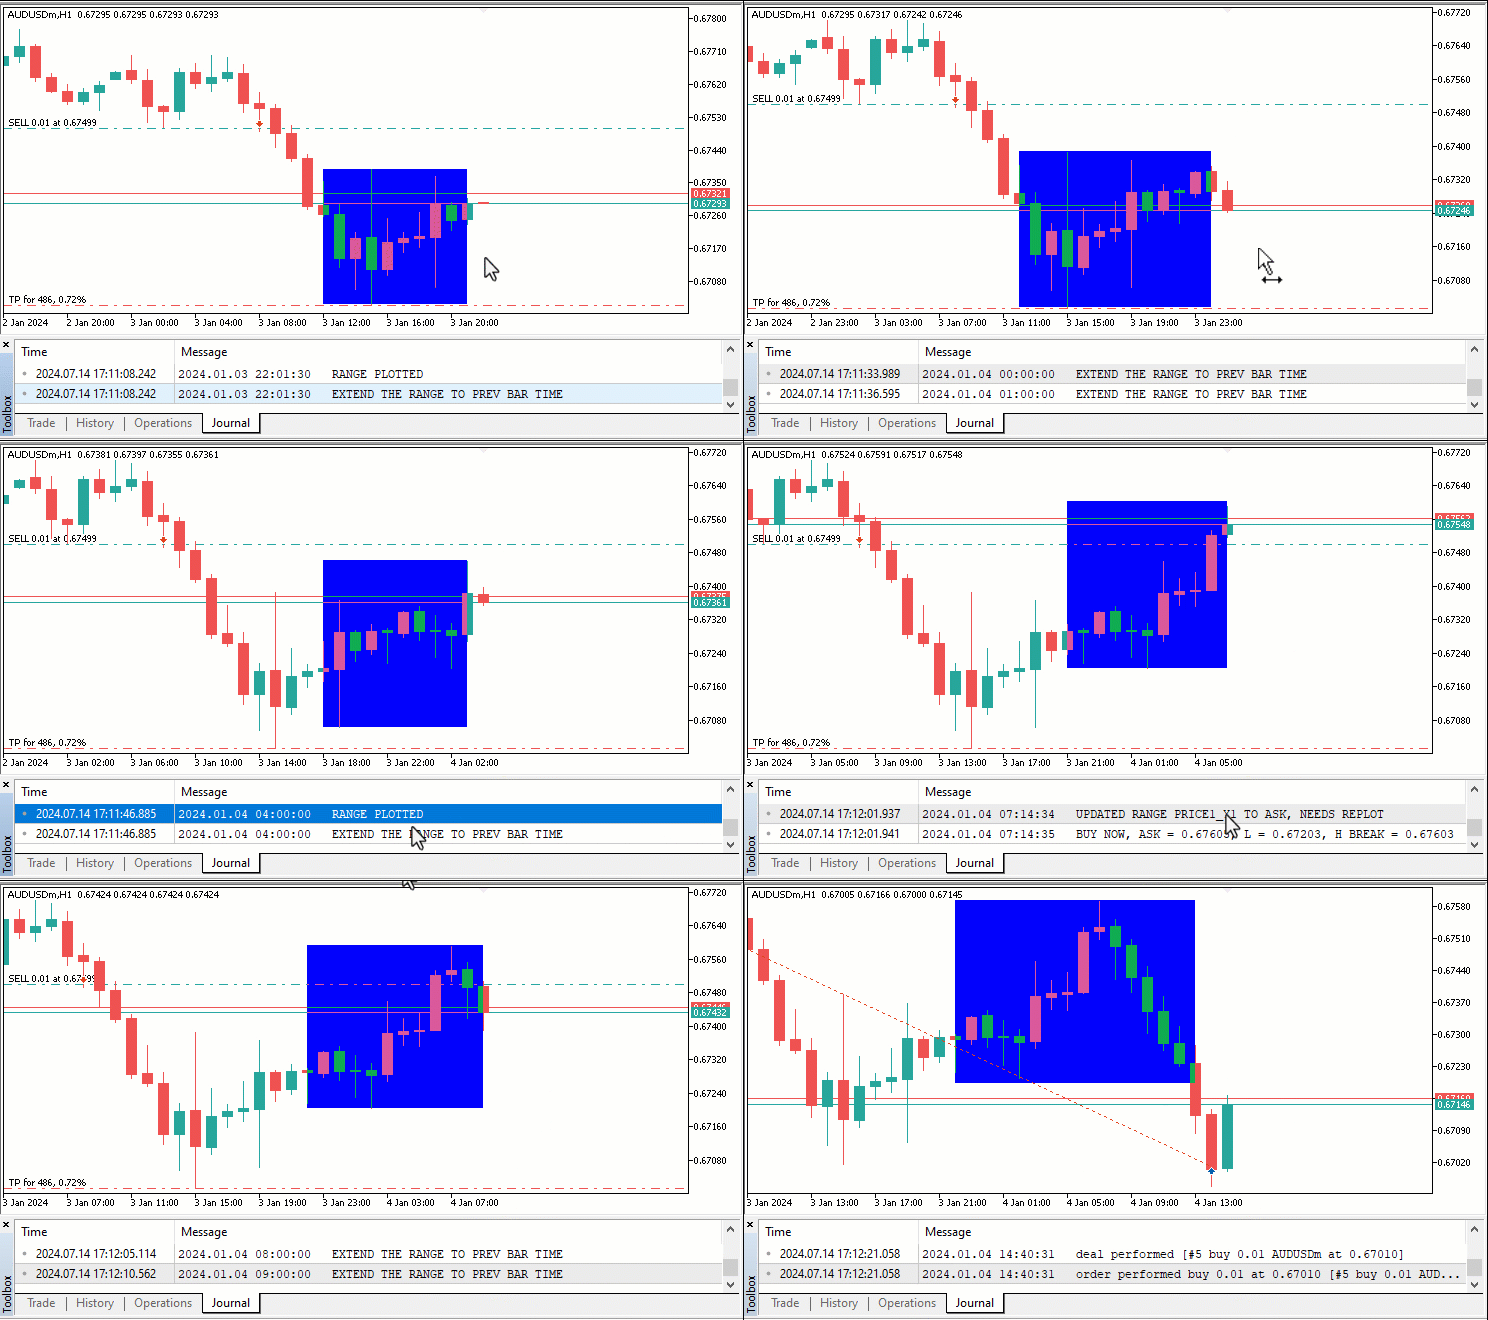
Finally, there still could be a scenario where neither the Ask price surpasses the high price nor the Bid price falls below the low price. If so, we still need to extend the consolidation range to include the latest completed bar. Below is a code snippet to take care of that.
      else{
         if (isNewBar){ // If a new bar has appeared
            TIME2_Y2 = iTime(_Symbol,_Period,1); // Update the end time to the previous bar time
            Print("EXTEND THE RANGE TO PREV BAR TIME"); // Print a message indicating the range is extended
            plotConsolidationRange(rangeNAME,TIME1_X1,PRICE1_Y1,TIME2_Y2,PRICE2_Y2); // Replot the consolidation range
         }
      }
We check if a new bar has appeared using the "isNewBar" flag. If a new bar has indeed appeared, we update the end time of the consolidation range "TIME2_Y2" to the time of the previous bar, which we obtain using the iTime function, passing the target bar index as 1, which is the bar that precedes the current bar. To ensure clarity and keep track of this adjustment, we print a message to the terminal indicating that the end time of the range has been extended to the previous bar's time. We then call the "plotConsolidationRange" function with the updated parameters, including the new end time, to visually reflect the changes on the chart.
Here is an illustration of the in-range update milestone.
The full source code responsible for the creation of the Consolidation Range breakout strategy based Expert Advisor (EA) in MQL5 is as provided below:
//+------------------------------------------------------------------+
//|                                 CONSOLIDATION RANGE BREAKOUT.mq5 |
//|                                  Copyright 2024, MetaQuotes Ltd. |
//|                                             https://www.mql5.com |
//+------------------------------------------------------------------+
#property copyright "Copyright 2024, MetaQuotes Ltd."
#property link      "https://www.mql5.com"
#property version   "1.00"


#include <Trade/Trade.mqh> // Include the trade library
CTrade obj_Trade; // Create an instance of the CTrade class

#define rangeNAME "CONSOLIDATION RANGE" // Define the name of the consolidation range

datetime TIME1_X1, TIME2_Y2; // Declare datetime variables to hold range start and end times
double PRICE1_Y1, PRICE2_Y2; // Declare double variables to hold range high and low prices

bool isRangeExist = false; // Flag to check if the range exists
bool isInRange = false; // Flag to check if we are currently within the range

int rangeBars = 10; // Number of bars to consider for the range
int rangeSizePoints = 400; // Maximum range size in points

double sl_points = 500.0; // Stop loss points
double tp_points = 500.0; // Take profit points

//+------------------------------------------------------------------+
//| Expert initialization function                                   |
//+------------------------------------------------------------------+
int OnInit(){
//---
   // Initialization code here (we don't initialize anything)
//---
   return(INIT_SUCCEEDED); // Return initialization success
}
//+------------------------------------------------------------------+
//| Expert deinitialization function                                 |
//+------------------------------------------------------------------+
void OnDeinit(const int reason){
//---
   // Deinitialization code here (we don't deinitialize anything)
}
//+------------------------------------------------------------------+
//| Expert tick function                                             |
//+------------------------------------------------------------------+
void OnTick(){
//---

   int currBars = iBars(_Symbol,_Period); // Get the current number of bars
   static int prevBars = currBars; // Static variable to store the previous number of bars
   static bool isNewBar = false; // Static flag to check if a new bar has appeared
   if (prevBars == currBars){isNewBar = false;} // Check if the number of bars has not changed
   else {isNewBar = true; prevBars = currBars;} // If the number of bars has changed, set isNewBar to true and update prevBars

   if (isRangeExist == false && isNewBar){ // If no range exists and a new bar has appeared
      TIME1_X1 = iTime(_Symbol,_Period,rangeBars); // Get the start time of the range
      int highestHigh_BarIndex = iHighest(_Symbol,_Period,MODE_HIGH,rangeBars,1); // Get the bar index with the highest high in the range
      PRICE1_Y1 = iHigh(_Symbol,_Period,highestHigh_BarIndex); // Get the highest high price in the range

      TIME2_Y2 = iTime(_Symbol,_Period,0); // Get the current time
      int lowestLow_BarIndex = iLowest(_Symbol,_Period,MODE_LOW,rangeBars,1); // Get the bar index with the lowest low in the range
      PRICE2_Y2 = iLow(_Symbol,_Period,lowestLow_BarIndex); // Get the lowest low price in the range

      isInRange = (PRICE1_Y1 - PRICE2_Y2)/_Point <= rangeSizePoints; // Check if the range size is within the allowed points

      if (isInRange){ // If the range size is valid
         plotConsolidationRange(rangeNAME,TIME1_X1,PRICE1_Y1,TIME2_Y2,PRICE2_Y2); // Plot the consolidation range
         isRangeExist = true; // Set the range exist flag to true
         Print("RANGE PLOTTED"); // Print a message indicating the range is plotted
      }
   }

   double Ask = NormalizeDouble(SymbolInfoDouble(_Symbol,SYMBOL_ASK),_Digits); // Get and normalize the current Ask price
   double Bid = NormalizeDouble(SymbolInfoDouble(_Symbol,SYMBOL_BID),_Digits); // Get and normalize the current Bid price

   if (isRangeExist && isInRange){ // If the range exists and we are in range
      double R_HighBreak_Prc = (PRICE2_Y2+rangeSizePoints*_Point); // Calculate the high breakout price
      double R_LowBreak_Prc = (PRICE1_Y1-rangeSizePoints*_Point); // Calculate the low breakout price
      if (Ask > R_HighBreak_Prc){ // If the Ask price breaks the high breakout price
         Print("BUY NOW, ASK = ",Ask,", L = ",PRICE2_Y2,", H BREAK = ",R_HighBreak_Prc); // Print a message to buy
         isInRange = false; isRangeExist = false; // Reset range flags
         if (PositionsTotal() > 0){return;} // Exit the function
         obj_Trade.Buy(0.01,_Symbol,Ask,Bid-sl_points*_Point,Bid+tp_points*_Point);
         return; // Exit the function
      }
      else if (Bid < R_LowBreak_Prc){ // If the Bid price breaks the low breakout price
         Print("SELL NOW"); // Print a message to sell
         isInRange = false; isRangeExist = false; // Reset range flags
         if (PositionsTotal() > 0){return;} // Exit the function
         obj_Trade.Sell(0.01,_Symbol,Bid,Ask+sl_points*_Point,Ask-tp_points*_Point);
         return; // Exit the function
      }

      if (Ask > PRICE1_Y1){ // If the Ask price is higher than the current high price
         PRICE1_Y1 = Ask; // Update the high price to the Ask price
         TIME2_Y2 = iTime(_Symbol,_Period,0); // Update the end time to the current time
         Print("UPDATED RANGE PRICE1_Y1 TO ASK, NEEDS REPLOT"); // Print a message indicating the range needs to be replotted
         plotConsolidationRange(rangeNAME,TIME1_X1,PRICE1_Y1,TIME2_Y2,PRICE2_Y2); // Replot the consolidation range
      }
      else if (Bid < PRICE2_Y2){ // If the Bid price is lower than the current low price
         PRICE2_Y2 = Bid; // Update the low price to the Bid price
         TIME2_Y2 = iTime(_Symbol,_Period,0); // Update the end time to the current time
         Print("UPDATED RANGE PRICE2_Y2 TO BID, NEEDS REPLOT"); // Print a message indicating the range needs to be replotted
         plotConsolidationRange(rangeNAME,TIME1_X1,PRICE1_Y1,TIME2_Y2,PRICE2_Y2); // Replot the consolidation range
      }
      else{
         if (isNewBar){ // If a new bar has appeared
            TIME2_Y2 = iTime(_Symbol,_Period,1); // Update the end time to the previous bar time
            Print("EXTEND THE RANGE TO PREV BAR TIME"); // Print a message indicating the range is extended
            plotConsolidationRange(rangeNAME,TIME1_X1,PRICE1_Y1,TIME2_Y2,PRICE2_Y2); // Replot the consolidation range
         }
      }

   }

}
//+------------------------------------------------------------------+

//+------------------------------------------------------------------+
//| Function to plot the consolidation range                         |
//| rangeName - name of the range object                             |
//| time1_x1 - start time of the range                               |
//| price1_y1 - high price of the range                              |
//| time2_x2 - end time of the range                                 |
//| price2_y2 - low price of the range                               |
//+------------------------------------------------------------------+
void plotConsolidationRange(string rangeName,datetime time1_x1,double price1_y1,
   datetime time2_x2,double price2_y2){
   if (ObjectFind(0,rangeName) < 0){ // If the range object does not exist
      ObjectCreate(0,rangeName,OBJ_RECTANGLE,0,time1_x1,price1_y1,time2_x2,price2_y2); // Create the range object
      ObjectSetInteger(0,rangeName,OBJPROP_COLOR,clrBlue); // Set the color of the range
      ObjectSetInteger(0,rangeName,OBJPROP_FILL,true); // Enable fill for the range
      ObjectSetInteger(0,rangeName,OBJPROP_WIDTH,5); // Set the width of the range
   }
   else { // If the range object exists
      ObjectSetInteger(0,rangeName,OBJPROP_TIME,0,time1_x1); // Update the start time of the range
      ObjectSetDouble(0,rangeName,OBJPROP_PRICE,0,price1_y1); // Update the high price of the range
      ObjectSetInteger(0,rangeName,OBJPROP_TIME,1,time2_x2); // Update the end time of the range
      ObjectSetDouble(0,rangeName,OBJPROP_PRICE,1,price2_y2); // Update the low price of the range
   }
   ChartRedraw(0); // Redraw the chart to reflect changes
}
Backtest Results
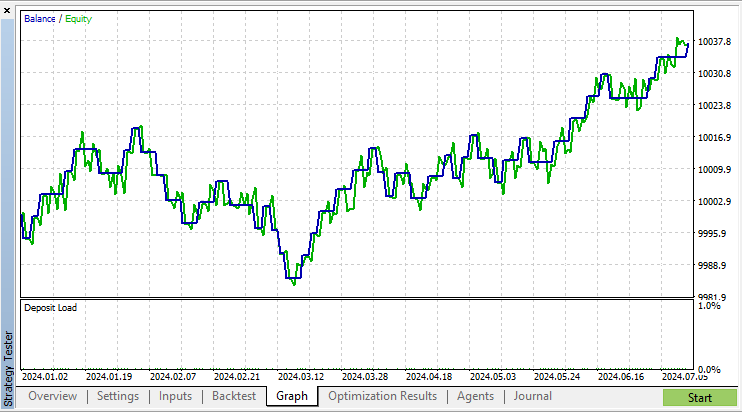
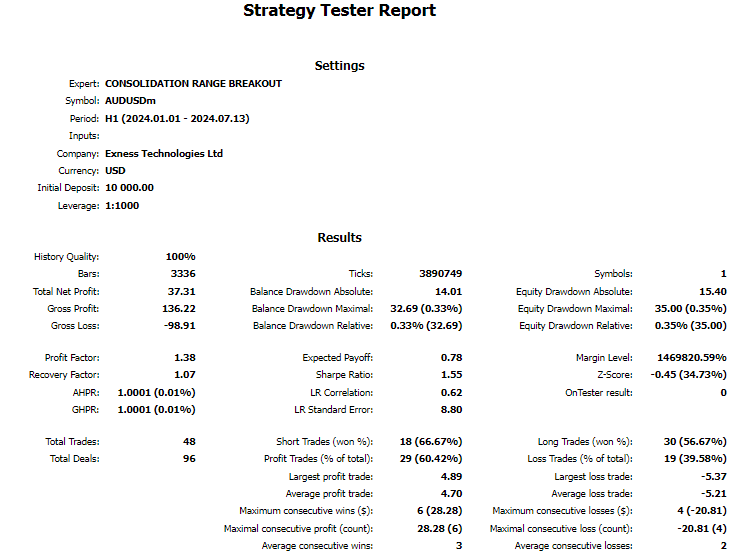
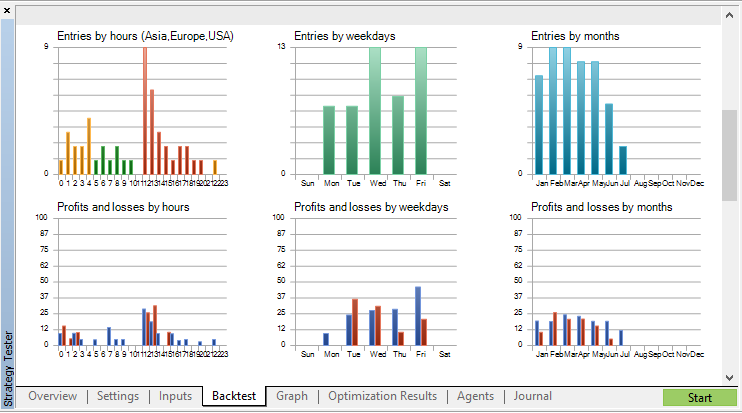
Upon testing on the strategy tester, here are the results.
- Balance/Equity graph:
- Backtest results:
- Trade entries by periods:
Conclusion
In conclusion, we can confidently say that automation of the Consolidation Breakout strategy is not as complex as it is perceived once given the required thought. Technically, you can see that its creation required just a clear understanding of the strategy and the actual requirements, or rather the objectives that must be met to create a valid strategy setup.
Overall, the article emphasizes the theoretical part that must be taken into account and be clearly understood to create a Consolidation Range Breakout forex trading strategy. This involves its definition, and overview besides its blueprint. Moreover, the coding aspect of the strategy highlights the steps that are taken to analyze the candlesticks, identify low volatility periods, identify the support and resistance levels for the periods, track their breakouts, visualize their outputs, and open trading positions based on the signals generated. In the long run, this enables automation of the Consolidation Range Breakout strategy, facilitating faster execution and the scalability of the strategy.
We do hope that you found the article helpful, fun, and easy to understand, in a way that you can make use of the presented knowledge in your development of future expert advisors. Technically, this eases your way of analyzing the market based on the Price Action approach and particularly the Consolidation Range Breakout strategy. Enjoy.
 SP500 Trading Strategy in MQL5 For Beginners
 Portfolio Optimization in Python and MQL5
 Introduction to MQL5 (Part 8): Beginner's Guide to Building Expert Advisors (II)
 Cascade Order Trading Strategy Based on EMA Crossovers for MetaTrader 5
- Free trading apps
- Over 8,000 signals for copying
- Economic news for exploring financial markets
You agree to website policy and terms of use