
MQL5 Wizard Techniques you should know (Part 25): Multi-Timeframe Testing and Trading
Introduction
In our last article we looked at Pythagorean Means which are a group of moving averages of which some are quite novel and not common enough despite their potential in benefiting some traders as we hinted in the test reports. These Pythagorean Means were represented in a semicircle diagram that summarized what each mean value was when presented with two unequal values that added up to the diameter of the semicircle. Among the chord values in the semicircle that was not touched on in the article was the value indicated as Q that represented the quadratic mean of the two values a and b.
The quadratic mean (QM) is also commonly referred to as the root-mean-square and as a mean it tends to be weighted more towards the larger values in the set whose mean is sought, which is unlike the geometric and harmonic mean’s we looked at in the previous article. It is also like the geometric mean only returns positive values, so the sampled set whose mean is sought needs to have only positive values. The title of this article though is implementing multi-timeframe strategies in wizard assembled Expert Advisors, so QM is simply going to be the tool that we use to show how multiple timeframes can be tested on in a wizard-built Expert.
So why is testing on multiple timeframes tricky with wizard-built Experts? Well in my opinion this is because the customization of this should happen for each added signal in the wizard assembly space and this is often missed. The customization of the Symbol-names and Time-frames for a wizard assembled Expert Advisor can be done during the wizard signal selection steps, but often most people assume once you pick a signal then you get to pick the symbol and period, but this should not be the case with wizard assembly. In this prior article, I showed various ways of accommodating multiple symbol trading in wizard assembled Experts by modifying assembled source code. One obvious and primary approach I did not share, performing multiple attachments of signals, where each signal attachment would be for a specific symbol. These multiple attachments happen despite attaching the very same signal. The signal customization in assigning the symbol should be done in these steps indicated below:
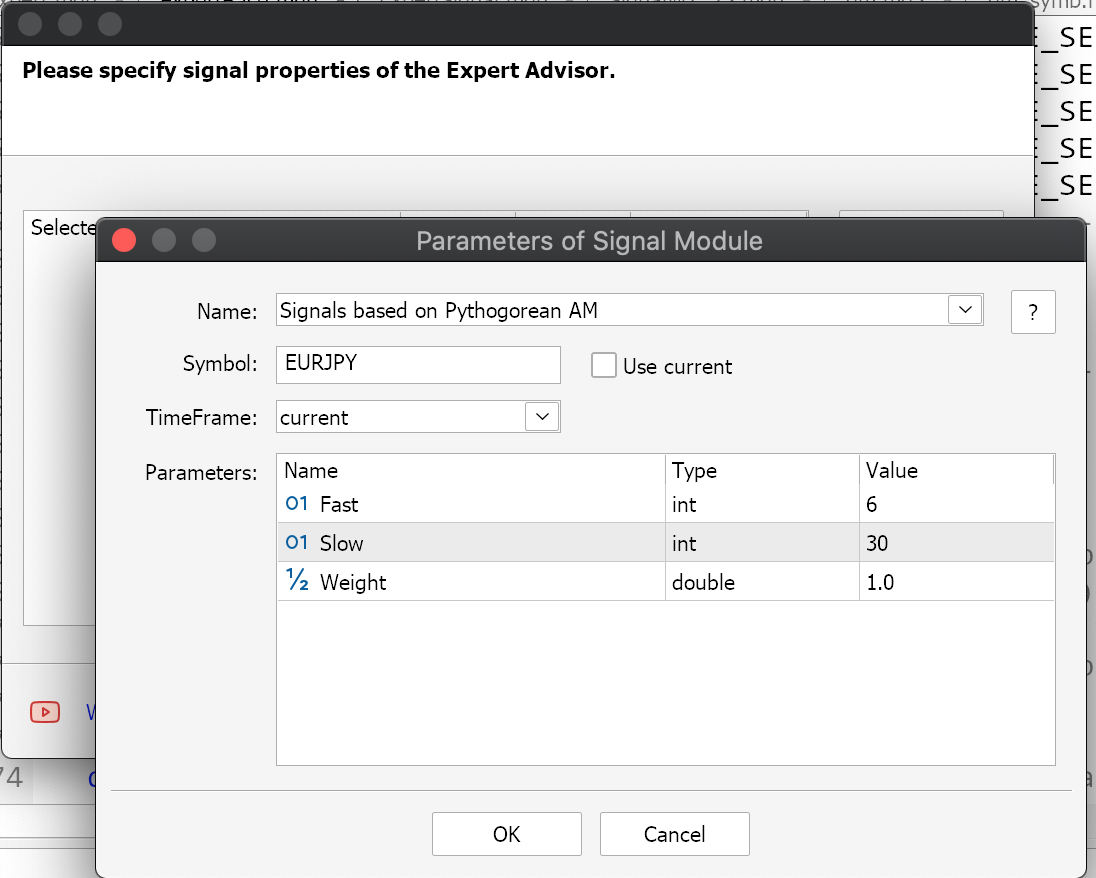
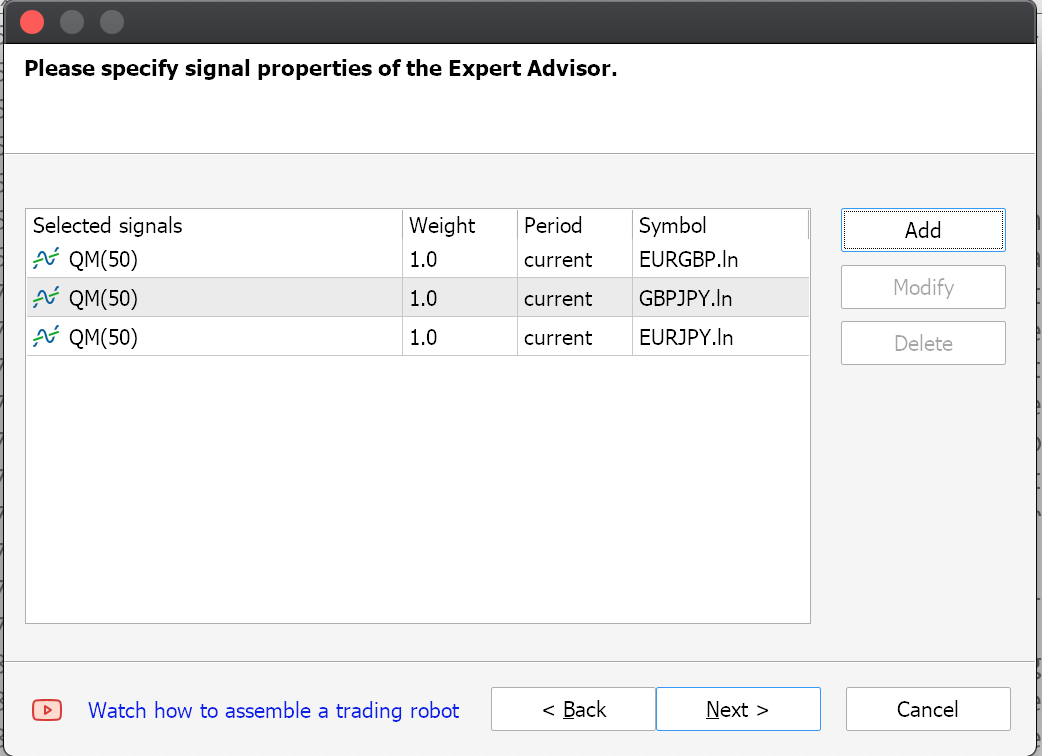
Similarly, multiple timeframes can be customized for each Expert Advisor within a signal as an input parameter (sample code of this is attached). However, the preferred approach could be assigning each required timeframe to a signal and independently attaching this signal in the wizard assembly. Steps in customizing timeframes for each signal are very similar to what we've shared above with multi symbol trading.
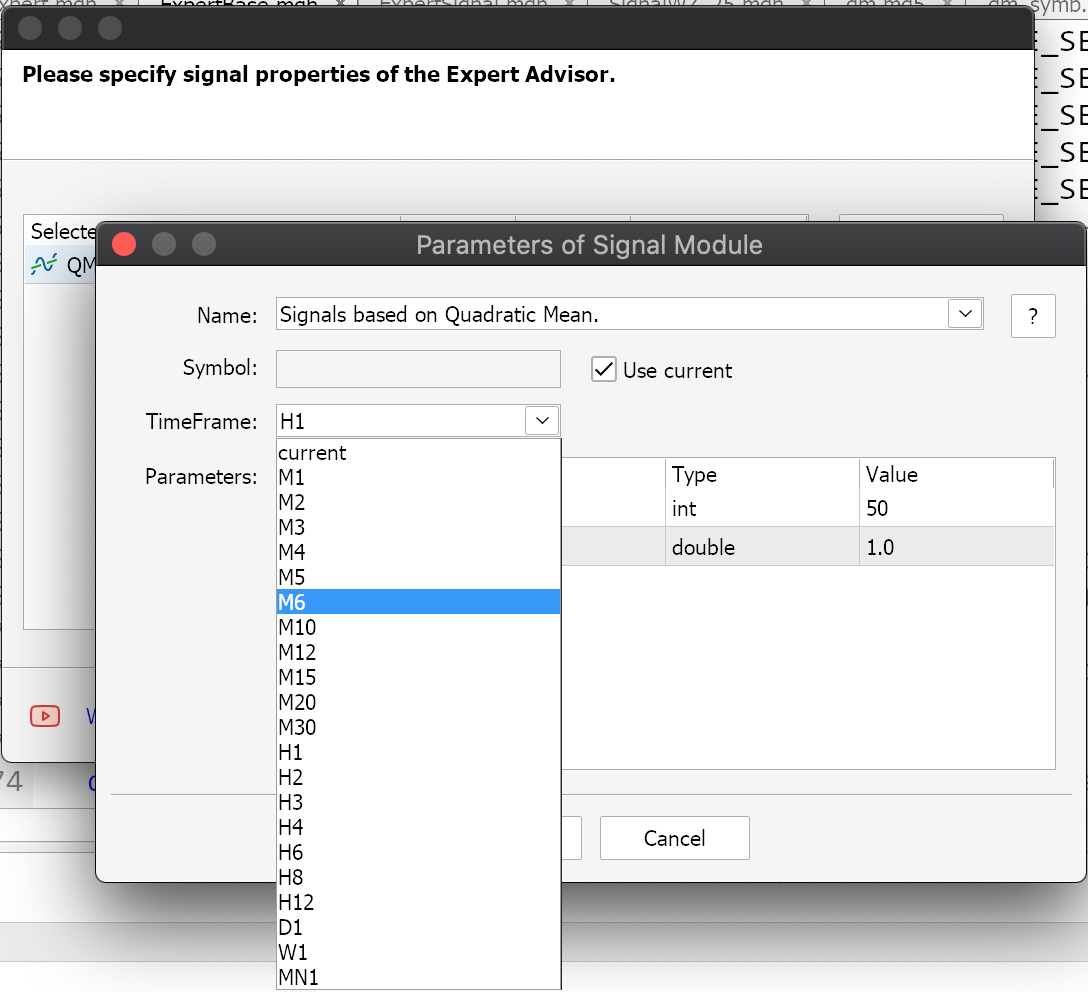
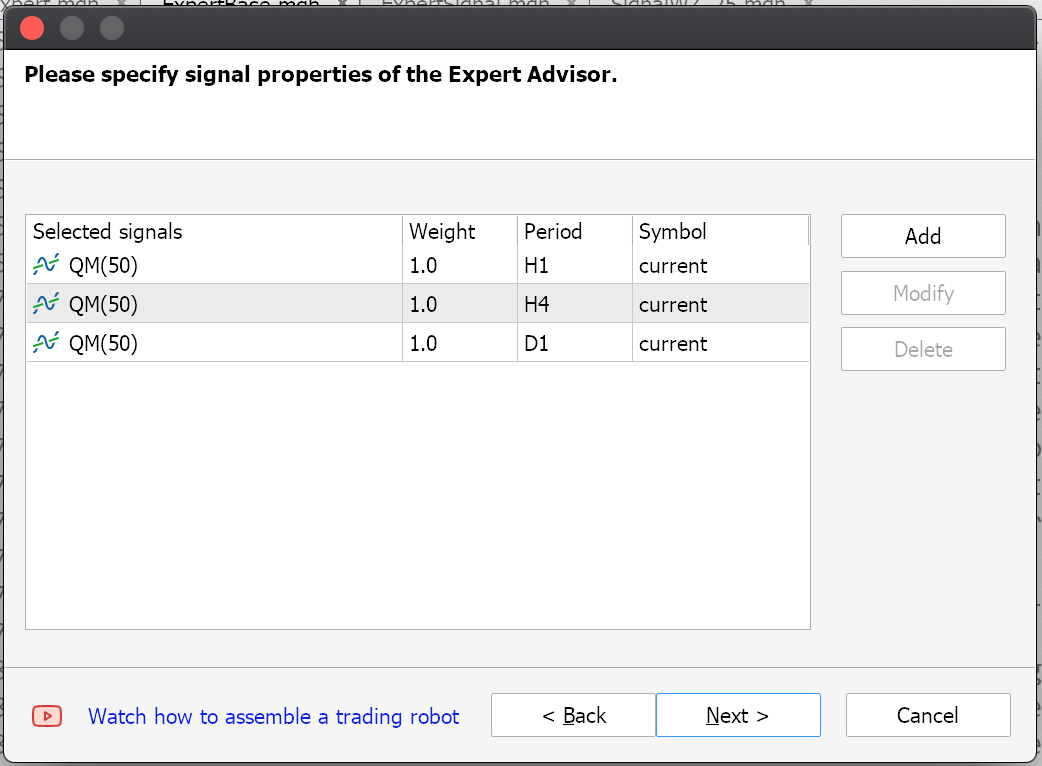
Multiple time frame strategies can be a boon in instances such as when looking for divergence opportunities between the tracked time frames such as a short-term bearish trend in the faster (or shorter time frame) could be a major signal if this is taking place in the backdrop of a major bullish trend in the larger time frame. Alternatively, multiple time frame strategies could evolve around confirmation setups between the two or multiple tested time frames. These and other reasons are why we will delve into multi-time frame strategies implementation in wizard assembled Expert Advisors.
Likewise, the already looked at multi symbol trading in this article, certainly extends a trader's possibilities. For this article though, we will consider 3 pairs of currencies that have the potential to cancel each other out in an arbitrage setup, but we'll not be looking to develop or test hedged arbitrage systems but rather we'll try to explore common moving average settings, if any, when all pairs are being traded by one Expert Advisor.
Multi timeframe trading and multi symbol trading are very interesting and yet because of how wizard assembled Experts are coded, the inherent design is for parallel or multi signals being added at wizard assembly with each added signal catering for a specific symbol or timeframe. The main reason for this in my opinion stems from the initialization phases of the wizard assembled Expert Advisors. There are 4 initialization phases of the ‘CExpertBase’ class, which serves as the anchor class not just for signals but also money management and trailing stop management. These phases are starting Initialization, setting parameter values, checking parameter values, and finally finishing Initialization.
Specifically, in the parameter setting phase is when an instance of the Expert signal class gets assigned its trade symbol and timeframe. According to the documentation,though, this can also happen in the parameter checking phase. I think the parameter setting phase is called the tuning phase, but I have failed to find documentation to that effect. So, because a trade symbol determines a lot of the parameters the signal class would rely on like what OHLC prices to load, the point size, etc. this is something that by design is set once on Initialization. Similarly, the timeframe used to retrieve the OHLC price buffers needs to be predetermined and this also happens during Initialization, and never after.
These design constraints therefore mean that the intended way of using multi symbols and timeframes is where an instance of a signal class gets pre-assigned during the wizard assembly such that these symbol and timeframe values act as constant parameters.
There is still a caveat though when it comes to trading multi symbols under this pre-assigning regime within the wizard. As we saw in the multi-currency article, we still need to create an array instance of the ‘CExpert’ class and re-assign our intended trade symbols to each instance of the expert class in this array. It appears, what the wizard symbol assignment does is only determine what symbol will be used in fetching OHLC price data under the ‘USED_SERIES’ enumerations. However, the actual symbol that gets traded after being initialized under the ‘m_symbol’ Symbol-Info class, is the symbol that is assigned on the very first step of the wizard assembly, before any signal is selected.
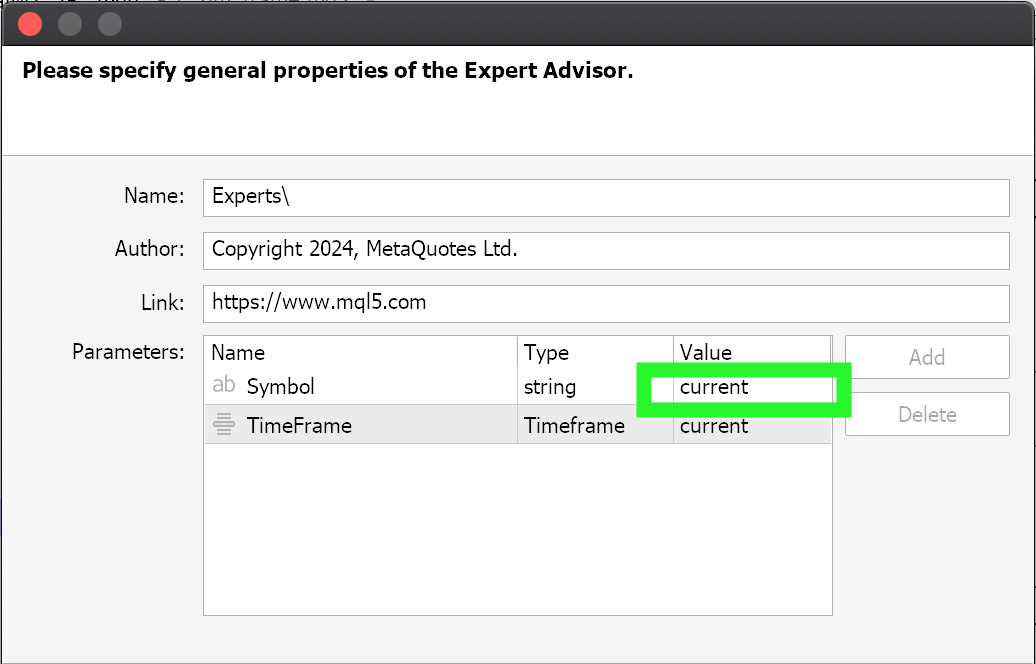
This constraint on multi-symbol trading is not reflected in multi-time frame trading, as the signal assignment of a time frame during wizard assembly is enough to ensure that each assigned time frame will be used in signal processing once the Expert Advisor is trading.
Implications of Tuning Phase in Initialization.
Because we only get to set customizations for trade symbols and timeframes at initialization, this constraint means we are unable to explore or optimize for tradeable symbols or ideal timeframes once an Expert Advisor has been assembled. There are workarounds to this where the sought trade symbol or timeframe can serve as an input parameter to a custom signal class. Such input parameters would take the form of a string and the enumeration-for-time frames, respectively. They naturally would also have default values, and in general the assigning of custom timeframe values should be more straight forward since the options are from the already set ENUM_TIMEFRAMES enumeration. However, when it comes to symbol names for trading then an extra step or function should be used to ensure that the typed symbol name is actually valid, is listed in the market watch, and is tradeable.
Quadratic Moving Averages
Quadratic Averages (QA) which are also referred to as root mean squares are simply the square root of the average of all squared values in a set. Like most non-arithmetic mean averages, they do have a bias or preference weighting and this, unlike the Geometric mean and the Harmonic mean, is towards the larger values in the set. In the semicircle diagram that was shown in this previous article, where the different types of means for two u equal values a and b were represented to scale within the semicircle, the quadratic mean was also indicated, and it was equivalent to the length of the chord marked Q.

Where
- n is the number of values in the set
- x are the values in the set at their respective index
We use the QM to develop and test a custom signal that trades on multiple timeframes and another custom signal that also trades across multiple symbols. In the previous article because of the bias or preference weighting towards smaller values in a set for the geometric mean and harmonic mean, we developed mirror averages that had biases towards larger values. The implementation of QM in MQL5 is given by the code below:
//+------------------------------------------------------------------+
//| Quadratic Mean                                                   |
//+------------------------------------------------------------------+
double CSignalQM::QM(int Index, int Mask = 8)
{  vector _f;
   _f.CopyRates(m_symbol.Name(), m_period, Mask, Index, m_length);
   vector _p = _f*_f;
   double _m = _p.Mean();
   return(sqrt(_m));
}
Before we dig in and start to explore possible applications, it would be prudent to do something similar for the QM since it leans more towards the larger values by having a mirror mean labelled QM’ that is weighted more towards the smaller values. Once again, this dichotomy of smaller value weighting vs larger value weighting can allow us to derive low price buffers and high price buffers respectively.
In the prior article, we used these buffer pairs to generate envelope (Bollinger Bands) and divergence signals. Besides these 2 applications we can generate alternative applications if we were to for instance, derive OSMA signals, however since the main purpose of this article is not QM or Averages introduction per se but the trading of multiple symbols and the trading on multiple time frames, we will stick to the applications already introduced in the prior article. As always, the reader can independently modify the attached code to explore other implementation avenues of QM.
The QM mirror QM' can be given by a formula similar to what we did share in the last article:
//+------------------------------------------------------------------+
//| Inverse Quadratic Mean                                           |
//+------------------------------------------------------------------+
double CSignalQM::QM_(int Index, int Mask = 8)
{  double _am = AM(Index, Mask);
   double _qm = QM(Index, Mask);
   return(_am + (_am - _qm));
}
The central thesis of this formula is that the arithmetic mean provides the most impartial and fair mean, implying that any distance from this mean off an alternative mean can be ‘mirrored’ if we take this raw arithmetic mean as a mirror line. The MQL5 source code that implements this is therefore identical to what we already shared and will not be shared here. It is attached below.
Once again, our objective is showcasing multi-symbol and multi-timeframe trading. Two types of Expert Advisors. It follows therefore that we could have the QM as a Bollinger Bands signal for one and the other using the Divergence signal, with both implementations already introduced in the last article.
As we have highlighted above, the MQL5 Wizard assembled Expert Advisors, were designed to allow multi-timeframe and multi-symbol testing (and trading) on a per signal basis. Each used signal by the Expert Advisor gets its custom symbol and or time frame before it is added in the wizard. This implies we could have tested for multi-symbols and multi-time frames on any signal, however since we just looked at novel averages in the last article, we are continuing in that vein by covering quadratic means.
Developing Custom Signal Classes with QMA
We will not perform tests for the multi-currency symbol Expert Advisor, since what is assembled in the wizard requires modifications that we have already addressed in this article. As mentioned above, testing for multi-symbol and multi-timeframe Expert Advisors can be done with the same signal file, since these symbol and time frame values are assigned per signal. The processing of the long and short conditions will follow the overall approach we had with generating signals for the geometric mean in the previous article. We are making some changes though since in the previous article we were dealing with only one signal, we could afford to look for sharp entry points such as the upper bands price cross we sought when looking for a bearish signal or the lower bands cross that sought a bullish signal.
In this article since we are handling multiple signals in parallel, it is unlikely they all concurrently have a cross at the same time so instead of looking for such sharp entry points we use the bands as a probability gauge for bullishness and bearishness by measuring how far above (for bearishness) or below (for bullishness) the close price is relative to the two bands’ baseline. So, the further above the baseline the current close price is the higher the weight for bearishness, similarly the lower below the baseline the close price is the higher the bullish weight.
So, each of the used signals, which ran at different time frames, provide a condition for either bullishness or bearishness depending on where the positions of their respective close prices. These conditions are then combined using the individual optimized signal weights to arrive at a single condition, via weighted average. It is this average that determines whether current positions can be closed and whether to open any new positions. The code for our modified long and short conditions is shared below:
//+------------------------------------------------------------------+
//| "Voting" that price will grow.                                   |
//+------------------------------------------------------------------+
int CSignalQM::LongCondition(void)
{  int result = 0;
   m_close.Refresh(-1);
   if(m_close.GetData(StartIndex()) > m_close.GetData(StartIndex() + 1) && m_close.GetData(StartIndex()) > BandsDn(StartIndex()) && m_close.GetData(StartIndex() + 1) < BandsDn(StartIndex() + 1))
   {  result = int(round(100.0 * ((m_close.GetData(StartIndex()) - m_close.GetData(StartIndex()+1))/(fabs(m_close.GetData(StartIndex()) - m_close.GetData(StartIndex()+1)) + fabs(BandsUp(StartIndex()) - BandsDn(StartIndex()))))));
   }
   return(result);
}
//+------------------------------------------------------------------+
//| "Voting" that price will fall.                                   |
//+------------------------------------------------------------------+
int CSignalQM::ShortCondition(void)
{  int result = 0;
   m_close.Refresh(-1);
   if(m_close.GetData(StartIndex()) < m_close.GetData(StartIndex() + 1) && m_close.GetData(StartIndex()) < BandsUp(StartIndex()) && m_close.GetData(StartIndex() + 1) > BandsUp(StartIndex() + 1))
   {  result = int(round(100.0 * ((m_close.GetData(StartIndex()+1) - m_close.GetData(StartIndex()))/(fabs(m_close.GetData(StartIndex()) - m_close.GetData(StartIndex()+1)) + fabs(BandsUp(StartIndex()) - BandsDn(StartIndex()))))));
   }
   return(result);
}
Practical Implementation and Testing
Once an Expert that uses our signal above is assembled in the wizard, if we are using multiple time frames, then the header part of the *MQ5 file will look as follows:
//+------------------------------------------------------------------+
//|                                                           qm.mq5 |
//|                                  Copyright 2024, MetaQuotes Ltd. |
//|                                             https://www.mql5.com |
//+------------------------------------------------------------------+
#property copyright "Copyright 2024, MetaQuotes Ltd."
#property link      "https://www.mql5.com"
#property version   "1.00"
//+------------------------------------------------------------------+
//| Include                                                          |
//+------------------------------------------------------------------+
#include <Expert\Expert.mqh>
//--- available signals
#include <Expert\Signal\My\SignalWZ_25.mqh>
//--- available trailing
#include <Expert\Trailing\TrailingNone.mqh>
//--- available money management
#include <Expert\Money\MoneyFixedMargin.mqh>
//+------------------------------------------------------------------+
//| Inputs                                                           |
//+------------------------------------------------------------------+
//--- inputs for expert
input string Expert_Title           = "qm_frame"; // Document name
ulong        Expert_MagicNumber     = 2028; //
bool         Expert_EveryTick       = false; //
//--- inputs for main signal
input int    Signal_ThresholdOpen   = 10;   // Signal threshold value to open [0...100]
input int    Signal_ThresholdClose  = 10;   // Signal threshold value to close [0...100]
input double Signal_PriceLevel      = 0.0;  // Price level to execute a deal
input double Signal_StopLevel       = 50.0; // Stop Loss level (in points)
input double Signal_TakeLevel       = 50.0; // Take Profit level (in points)
input int    Signal_Expiration      = 4;    // Expiration of pending orders (in bars)
input int    Signal_0_QM_Length     = 50;   // QM(50) H1 Averaging Length
input double Signal_0_QM_Weight     = 1.0;  // QM(50) H1 Weight [0...1.0]
input int    Signal_1_QM_Length     = 50;   // QM(50) H4 Averaging Length
input double Signal_1_QM_Weight     = 1.0;  // QM(50) H4 Weight [0...1.0]
input int    Signal_2_QM_Length     = 50;   // QM(50) D1 Averaging Length
input double Signal_2_QM_Weight     = 1.0;  // QM(50) D1 Weight [0...1.0]
//--- inputs for money
input double Money_FixMargin_Percent = 10.0; // Percentage of margin
As can be seen, we assign a moving average length parameter and weighting parameter to each of the three chosen time frames, which in this case are PERIOD_H1, PERIOD_H4, and PERIOD_D1. Since the generated signal for the Expert Advisor is a weighted mean of the distance between the close price and the Bollinger Band's baseline, this implies we always have a signal at any time, unlike the sharp entries we explored with the geometric mean in the previous article. This does mean it would probably be a good idea to perform tests without price targets for exits like stop loss or take profits. In the last article, the only price target we used was the take profit. Stop loss setting is always touted as a sound loss limiting strategy however the stop loss price is never guaranteed and also from extensive testing most accounts do run out of margin mostly because their position sizing was too optimistic as opposed to not having a stop loss. Obviously, the debate on the importance of a stop loss is something that am sure will carry on, but that is my take. For this article though we will stick to the take profit only target price and the reader is welcome to make changes in the input parameters when testing to suite his loss management approach.
Strategy Tester Reports and Analysis
If we do test runs for the year 2023 on the one-hour time frame for the EURJPY pair, while seeking a balanced signal from the 1-hour, 4-hour, and Daily time frames, we do get the following as some of our fair results:
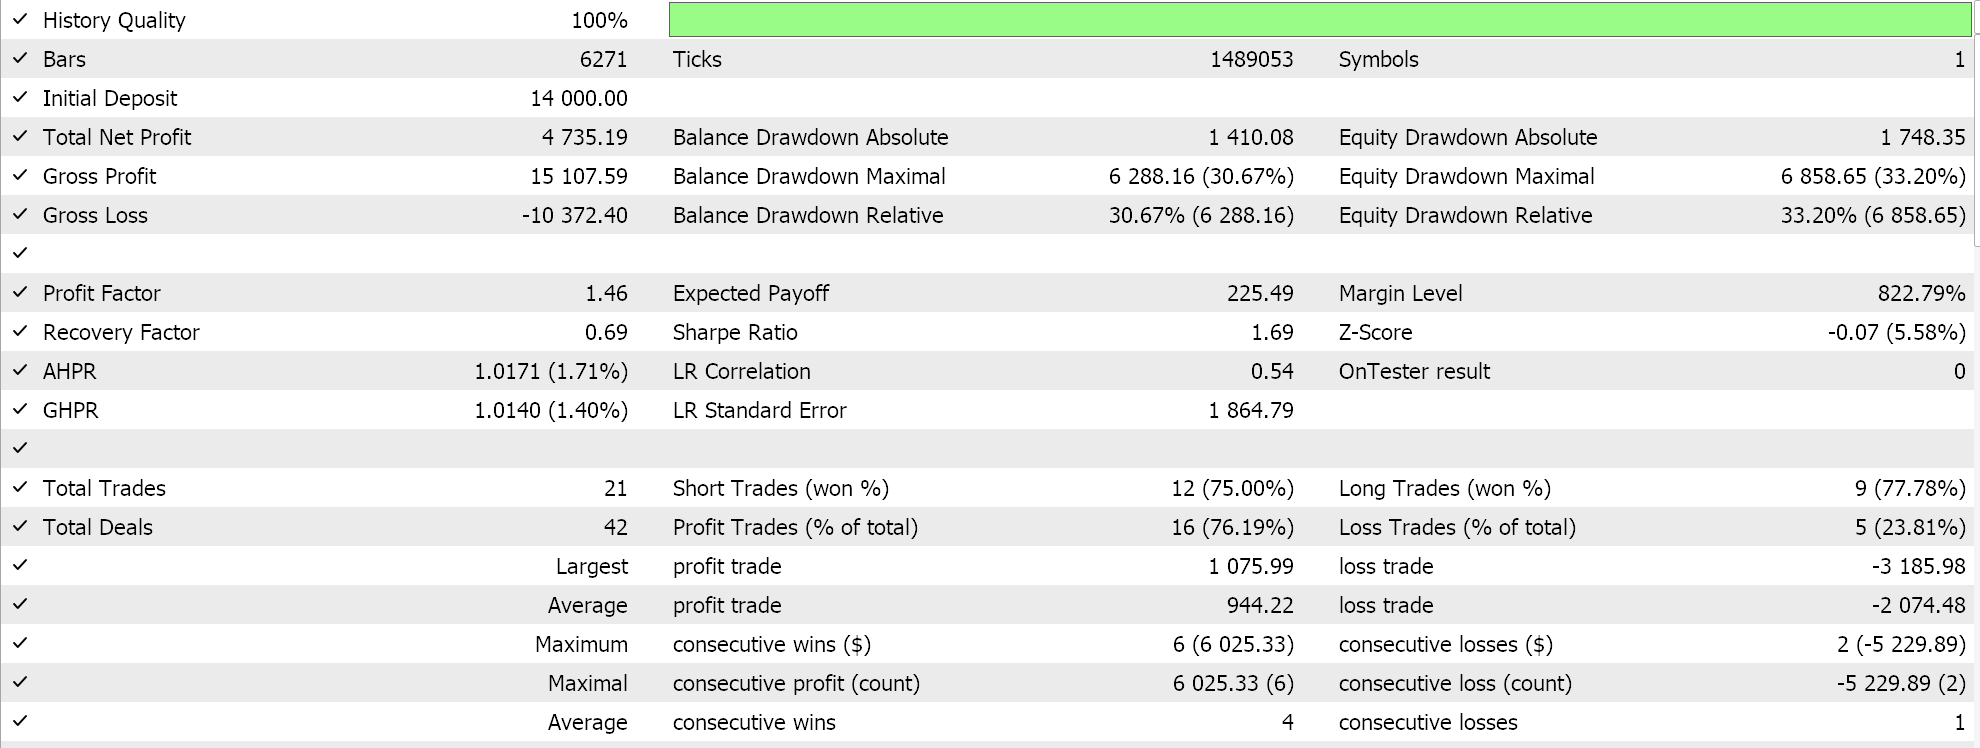
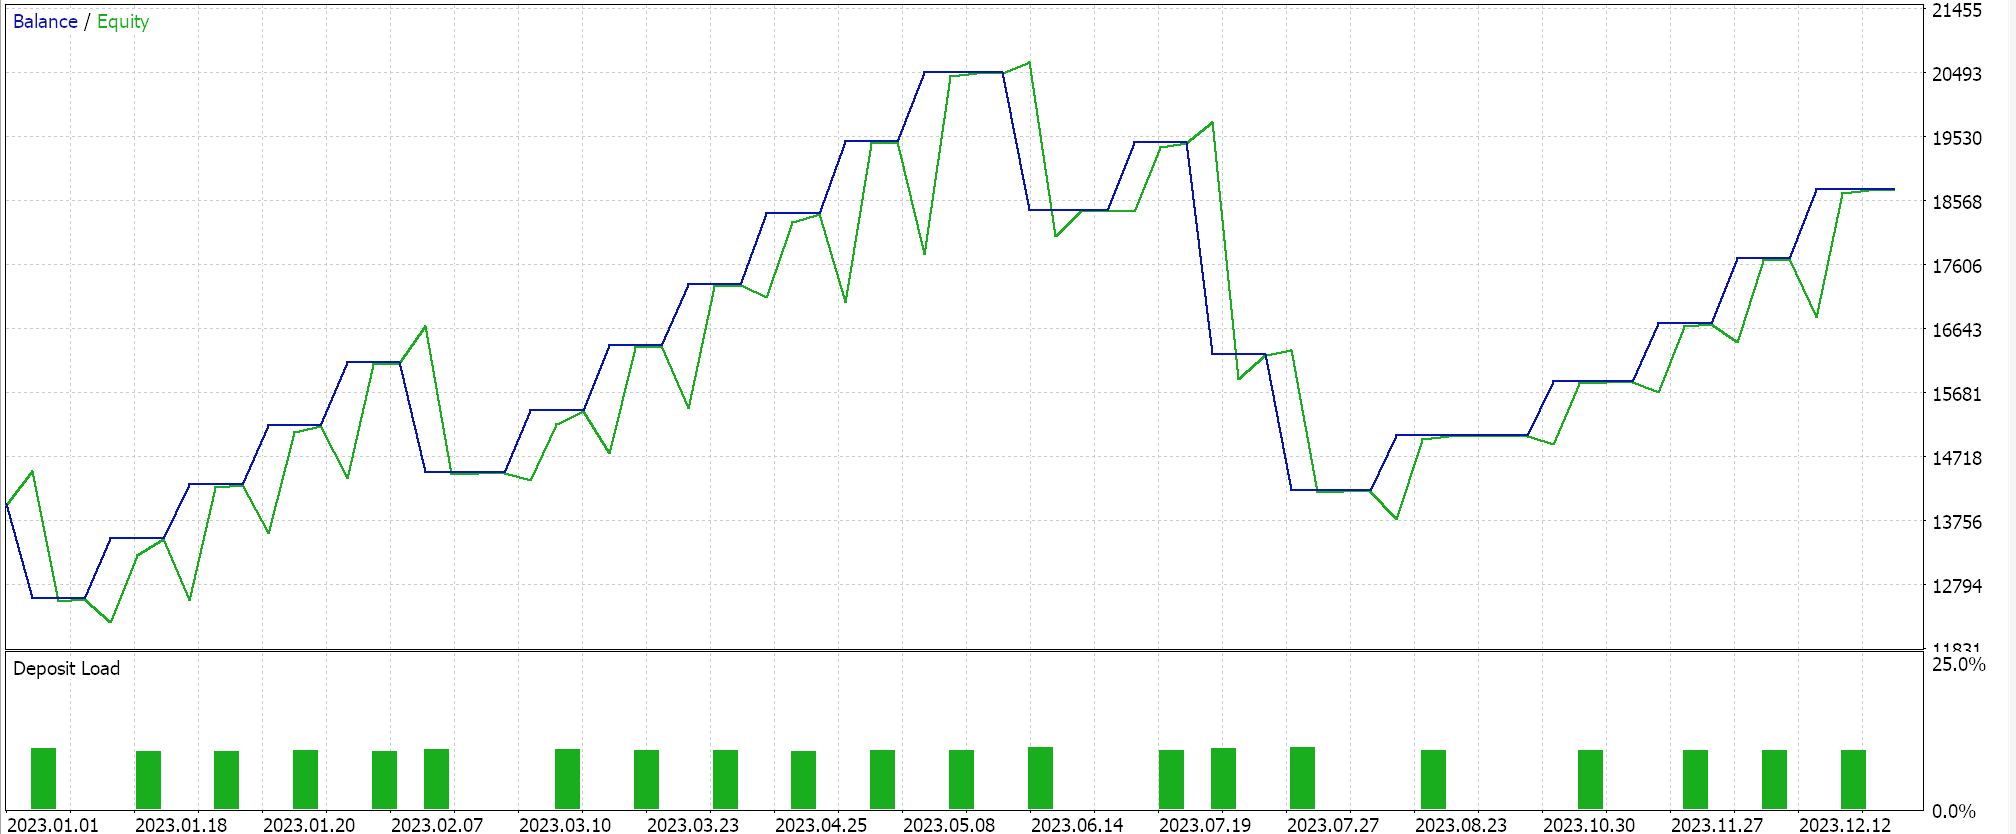
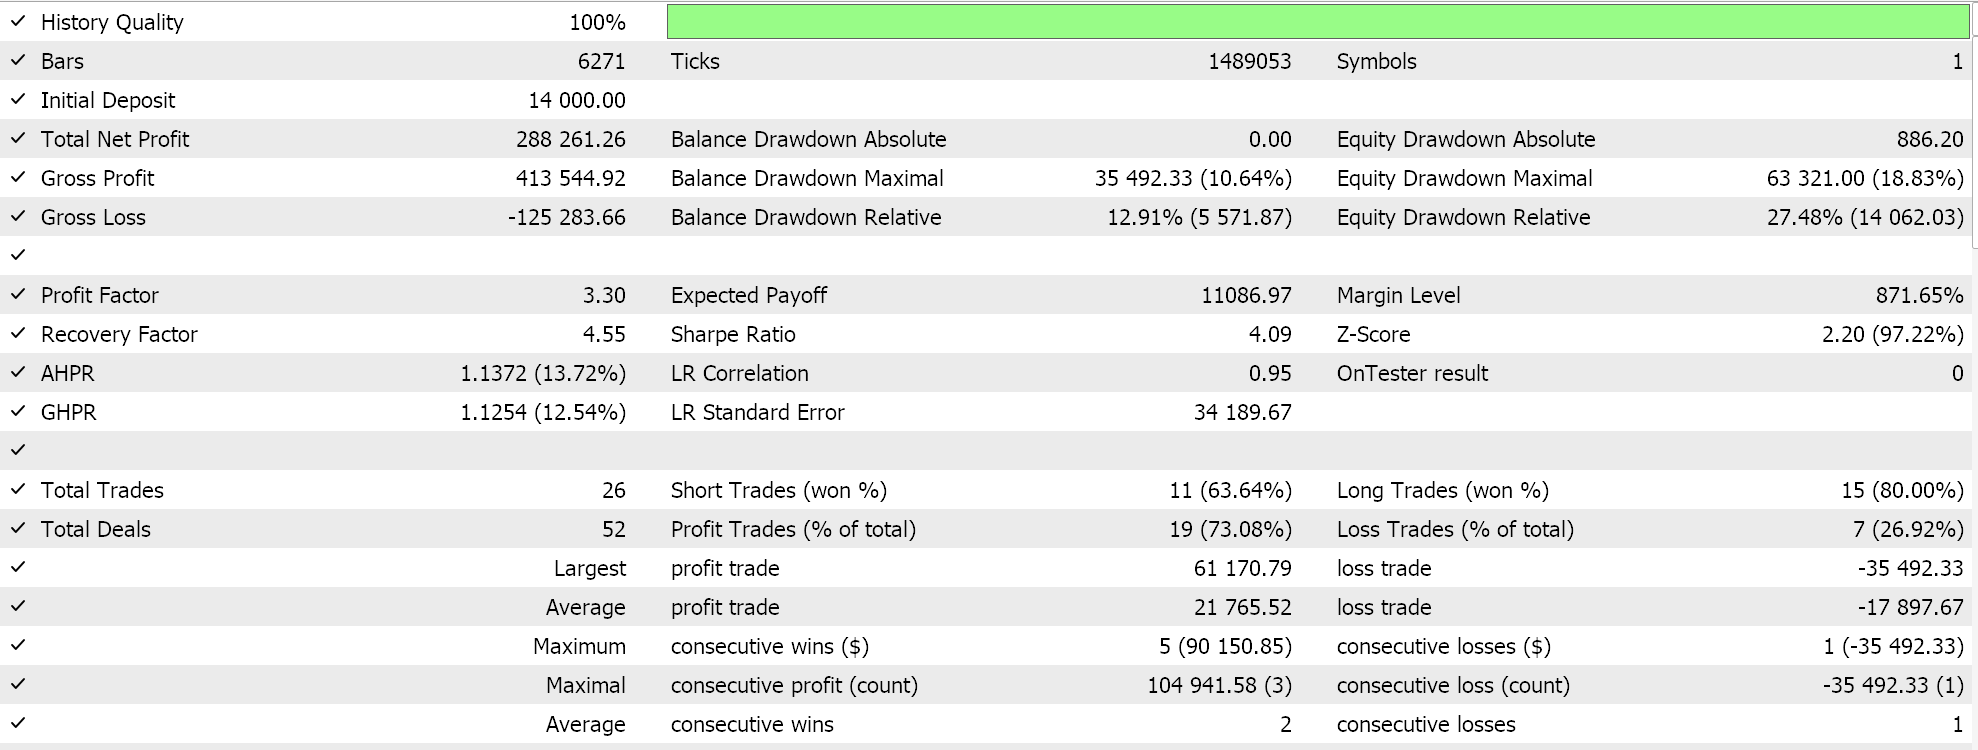
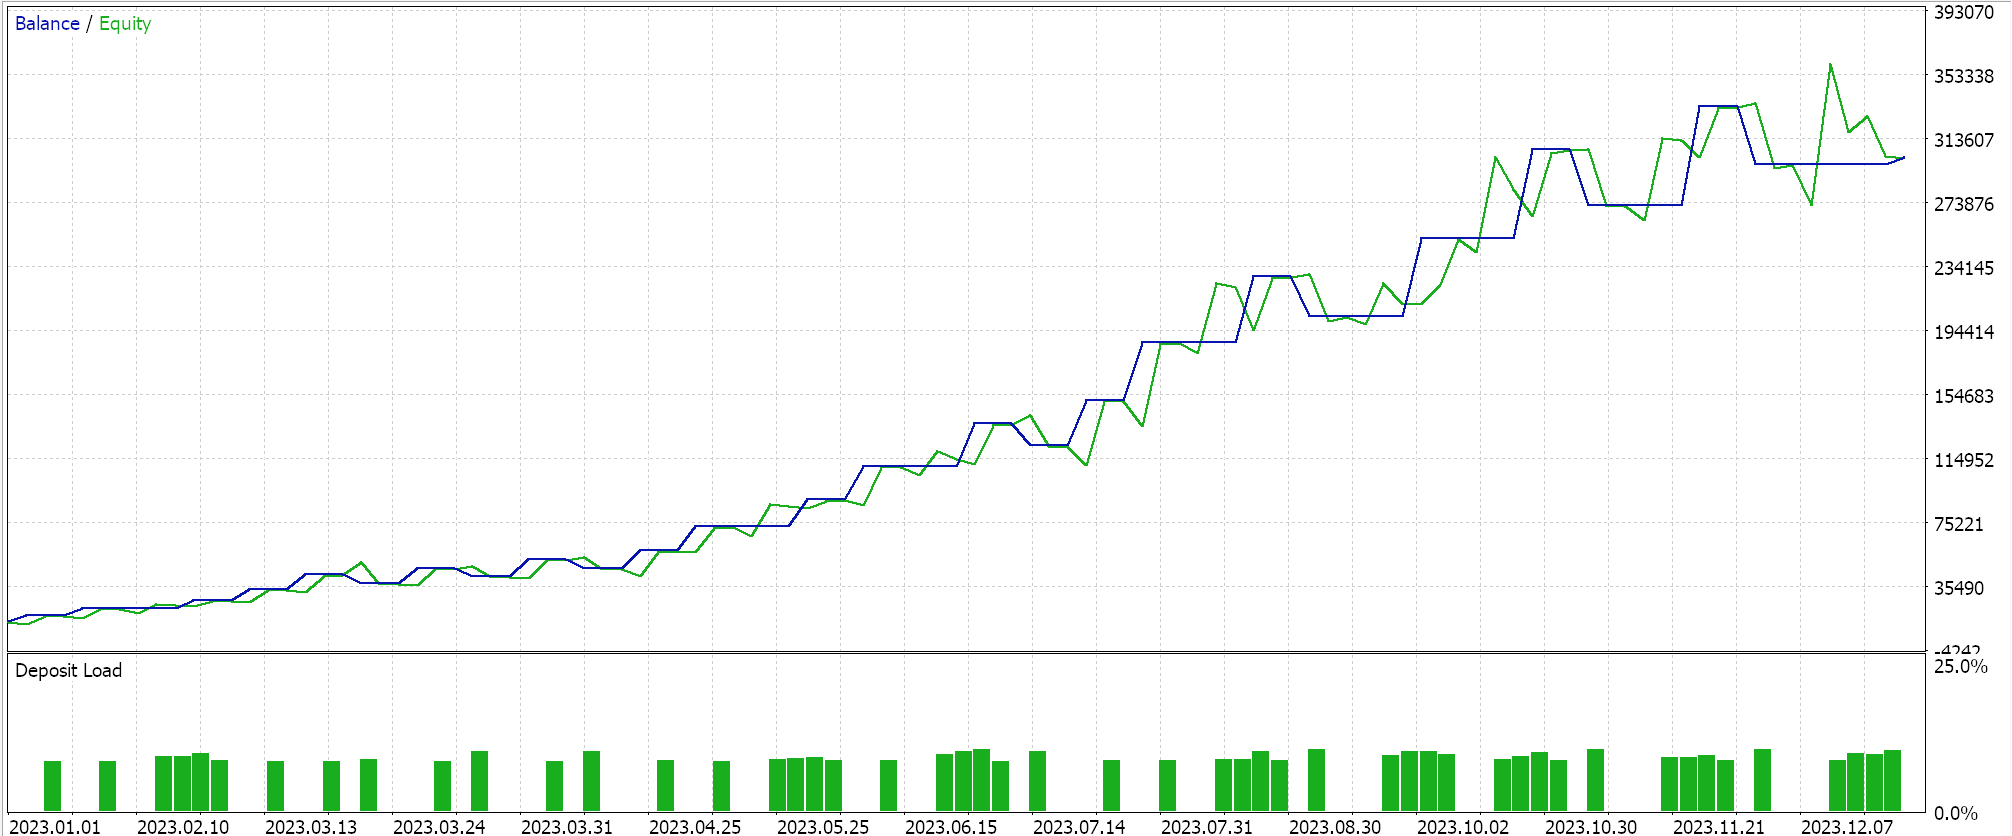
The results in a sense are a far cry from what we achieved when we were relying on sharp entries off the upper bands and lower bands price crosses. We therefore did perform tests with multiple timeframes while utilizing the sharp entry from the price crossing of the Bollinger Bands and surprisingly, the performance aside, the number of trades placed when waiting for these crossovers was more than in the weighted average approach we just adopted above. Below are the results:
Conclusion
In conclusion, we have shown how multiple time frames can be used in wizard assembled Expert Advisors. The main point we covered in showing this is that the wizard assembly process allows each signal to not only have its own time frame, but also its own trade symbol. Customizing a signal by assigning it a specific time frame implies the OHLC buffers for that signal will be bound to that time frame, and this is a relatively straight forward process, unlike the customization of a signal to trade a particular symbol. This is because when signals are assigned to trade a specific symbol, extra changes need to be made to the ‘CExpert’ class instance where it should be in an array format to accommodate each symbol that is to be traded.In demonstrating multi-time frame trading, we used Quadratic Means as our signal where like in the previous article we derived a mirror version of it that is more weighted towards the smaller values in the averaged set given that the quadratic mean by default is weighted more towards the larger values. We tested this in two settings, where one was always assessing probabilities and another was looking for specific entry signals, and we got significantly different results with either approach.
Multi-time frame trading in general though is meant to target the sharp or ‘most correct’ entry points by concurrently monitoring a large time frame for the macro trend while picking the signal for actual entry on the shorter time frame. To this end it perhaps would have been more prudent to use different signals each with a different time frame where the larger time frame takes the probability approach we considered in our first case of testing above, and the smaller time frame considers the actual cross-over points as the trigger point for the signal.
This can be implemented and tested by the reader since both instances of these signal classes are attached at the bottom and in addition there are alternative multi-time frame implementations that can take an indicator time frame as an input where this time frame would be different from the time frame of the chart to which the Expert Advisor is attached. This approach provides a work around the problem of not being able to select the optimal time frame that is present when time frames are assigned to a signal during wizard assembly. By having it as a signal input parameter, it could be optimized to best fit the strategy. Interestingly enough, this approach can even be used to assigning a time frame to a custom OHLC series buffer. Its main shortcoming is in multi-symbol trading where even though price and indicator readings can be made off a symbol name that is a parameter, placing of trades can only be made if changes are made to the assembled Expert file as mentioned above.
Warning: All rights to these materials are reserved by MetaQuotes Ltd. Copying or reprinting of these materials in whole or in part is prohibited.
This article was written by a user of the site and reflects their personal views. MetaQuotes Ltd is not responsible for the accuracy of the information presented, nor for any consequences resulting from the use of the solutions, strategies or recommendations described.
 Developing a Replay System (Part 41): Starting the second phase (II)
 Data Science and Machine Learning (Part 25): Forex Timeseries Forecasting Using a Recurrent Neural Network (RNN)
 Building A Candlestick Trend Constraint Model (Part 5): Notification System (Part III)
 Developing an MQL5 RL agent with RestAPI integration (Part 4): Organizing functions in classes in MQL5
- Free trading apps
- Over 8,000 signals for copying
- Economic news for exploring financial markets
You agree to website policy and terms of use
Hi Stephen
Your article is very wonderful, thank you for it. Can you attach the files so we can try it, or is the code in the article all the code used in the experiment?