
MQL5 Wizard Techniques you should know (Part 24): Moving Averages
Introduction
We continue this series on MQL5 Wizards by looking at the moving average indicator and how it could be added to the library of tools already available in ways that could be novel to some traders. The Moving Average has very many variants as a single time series attachable to a chart, but also other variants as an oscillator and even others an envelopes' indicator.
We will explore these multiple applications or variants within a special category of 3 Moving Averages (MA) called the Pythagorean Means. The 3 MAs under this name are Arithmetic Mean(AM), Geometric Mean(GM) and Harmonic Mean(HM). The first of these, the arithmetic mean, is what everyone first thinks of with the mention of MA. It is simply the average of any number of values in a set. Wikipedia has a very interesting summary of all these 3 means in a diagram. It is shared below:
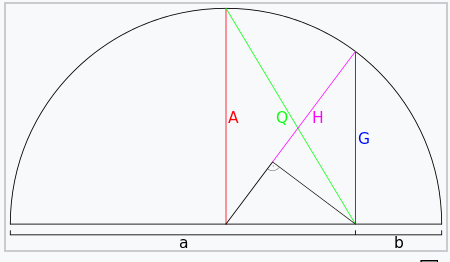
What is presented above is a semicircle whose diameter is split unevenly into two values a and b. The arithmetic mean of these two values is marked as A in red on the diagram, which is equivalent to the radius of the semicircle, as one would expect. For purposes of completeness, the formula for the arithmetic mean is shared below as:
where
- AM is the arithmetic mean
- x are the values in the set whose mean is computed
- n is the set size
Now, the geometric mean is given by the formula:
where
- GM is the geometric mean
- x and n represent the same as with AM above
The GM value on the semicircle above is equivalent in length to the blue chord marked G which makes it more weighted towards the smaller b value than the larger a. Also, noteworthy is that the GM will always be positive even if all values are negative! This scenario could be addressed by assigning a negative value to the computed GM if the set had entirely negative numbers, but in the event it’s a mixed bag of negative and positive values, then coming up with the real GM becomes problematic.
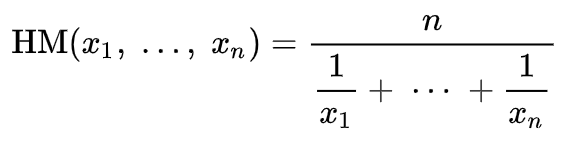
For the Harmonic mean, the semicircle representation is the line marked H whose length is equivalent to the mean of a and b. Its formula is represented by:
where
- HM is of course the harmonic mean
- x and n represent the same as above
If for some reason the value b, was zero, as can be seen from the semicircle diagram, both the geometric and harmonic means would be zero. (This is despite getting a ‘zero-divide’ when computing the harmonic mean). Interestingly enough, this would be true regardless of the count (i.e. if they are more than 2) of the numbers whose means are computed; as long as any of those numbers is a zero, then the geometric mean and harmonic mean of all the values is zero.
This property in essence measures the extent to which the smallest value in a set is close to zero. So, what does this mean for traders? It could mean a number of things, depending on the data of moving average is being considered.
If it is just the price of securities, then the moving average could act a good proxy for support. Why? It (the GM & HM) gives greater weight to the low prices. This could mean for instance that a price break below these averages would have greater significance than a break below a regular moving average.So, GM and HM could be resourceful on the support end of most price-actions. What about on the resistance side? We could get a mirror equivalent of both GM and HM from the following formulae:
HM’ = AM + (AM - HM)
GM’ = AM + (AM - GM)
Where:
- HM’ is the reflected harmonic mean
- GM’ is the geometric mean reflection
- AM, GM, & HM are same as above.
By introducing mirror equivalents or reflections of GM and HM we are in a sense adding a balance to the averages since the weightings of these reflections are bound to lean towards the larger values in any set of values whose mean is being computed. This also means, to answer the question on resistance, we can now use either GM’ or HM’ as higher price weighted averages to serve as more effective proxies in defining the resistance level.
The significance of GM vs HM for our purposes will be one of degree only. This is because both are weighted towards the smaller values, with the main difference being that HM has a higher weighting towards zero than GM.
Custom Implementations
We now look at how these simple averages could be put to use in MQL5 to harness their unique properties. First up, is the basic Arithmetic Mean. Of these 3 this is the most ordinary since it takes the very basics of averages without any modifications and the simplest way to use this mean should be by monitoring price cross-overs. There are many applications of moving averages when tracking price-structure, and this should arguably be the most straight forward and common. So, this application is presented here primarily for comparison purposes with the other not so common means of GM and HM already introduced above.
Benchmarking and comparison are inherent MQL5 wizard assembled experts, especially for the signal classes, since each chosen signal class in the wizard can be assigned a weighting, or a say, in determining the long and short conditions of a traded security. Thanks to the vector data types, we easily get the AM buffer from this function:
//+------------------------------------------------------------------+
//| Arithmetic Mean                                                  |
//+------------------------------------------------------------------+
double CSignalAM::AM(int Index, int Mask = 8)
{  vector _am;
   _am.CopyRates(m_symbol.Name(), m_period, Mask, Index, m_fast);
   return(_am.Mean());
}
And also, we can measure the current price gap, that is key in tracking moving average cross-over, with this function below:
   double            CrossOver(int Index)
   {                 m_close.Refresh(-1);
      return(AM(Index) - m_close.GetData(Index));
   }
Typically, in cases where one is trading manually, it would make more sense to have this as well as the GM & HM coded as a custom indicator. We are not trading manually since this is for an Expert Advisor, and so a function that accesses inbuilt class price buffers will do just fine.
The HM average like the GM is weighted towards smaller values and as we’ve seen above this can be mirrored to create another mean, HM’ that is weighted towards higher values. So, HM & HM’ being means that are weighted towards the extremes do lend themselves to the ability to pick up divergences. Now, when one thinks of divergences, the first thing that could come to mind could be a difference in trend between an oscillator and its security price. These bouts happen over very short periods and one needs to be on the look-out to catch them. Alternatively, it could be a divergence entirely in prices of one security but on different time frames, like a drop-in price on the one-hour time frame when on the weekly time frame a strong bullish trend is in place.
However, to capitalize on the harmonic mean ‘biases’, we will look to divergences in high and low prices. Specifically, we’ll look to open positions only when the change in high prices is different in direction from the change in low prices. This, though, could still be explored in two ways. Either we would open a position on falling highs and rising lows, or we would open on rising highs and falling lows. For this article we are exploring the latter, but since all source is attached at the end of this article the reader can customize this and try to exploit the more popular engulf divergence that we have not looked at.
So, we’ll be looking for a rise in the highs’ harmonic mean that is concurrent with a fall in the lows’ harmonic mean to open positions. A follow-up indicator to help guide on opening a long or short position can be customized here, but what we will use as a follow-up is simply the change in close price. If we have a rise in the close price, following a divergence on the previous bar, then we go long and vice versa.
The code for implementing this, as we saw with AM, is also two-fold. First, we have the HM function and its mirror, which is presented below:
//+------------------------------------------------------------------+
//| Harmonic Mean                                                    |
//+------------------------------------------------------------------+
double CSignalHM::HM(int Index, int Mask = 8)
{  vector _hm, _hm_i;
   _hm_i.CopyRates(m_symbol.Name(), m_period, Mask, Index, m_slow);
   _hm = (1.0 / _hm_i);
   return(m_slow / _hm.Sum());
}
//+------------------------------------------------------------------+
//| Inverse Harmonic Mean                                            |
//+------------------------------------------------------------------+
double CSignalHM::HM_(int Index, int Mask = 8)
{  double _am = AM(Index, Mask);
   double _hm = HM(Index, Mask);
   return(_am + (_am - _hm));
}
Then we have the divergence function, and this is as follows:
   double            Divergence(int Index)
   {                 return((HM_(Index, 2) - HM_(Index + 1, 2)) - (HM(Index, 4) - HM(Index + 1, 4)));
   }
In using the vectors to copy and load data the ‘rates mask’ index is indispensable as it allows us to quickly switch between various prices (OHLC) and at the same time the use of the vector data type inbuilt statistics functions saves on the need to code a lot. In addition, our test functions for these Pythagorean means use two moving average periods, a fast period and a slow period. This is common practice, especially when using the cross-over strategy to determine entry and exit points. For both the harmonic mean and geometric mean buffers, we are relying on the slow period to compute our values. The fast periods are being used only for the arithmetic mean buffer.
This of course can be modified or adjusted to better suite one’s strategy and approach, but we are sticking with it here purely for test purposes.
Finally, the geometric mean which like the harmonic will be applied in a fashion similar to Bollinger Bands. It like the harmonic is weighted more to small values and to a slightly greater extent. It is this much weighting that would make it ideal in deriving a Bollinger-bands-like indicator since, as is well known, the Bollinger bands are a moving average plus 2 standard deviations. Before we get to the implementation, though, the code for getting a geometric mean and its mirror (high value weighted equivalent) would be as indicated below:
//+------------------------------------------------------------------+
//| Geometric Mean                                                   |
//+------------------------------------------------------------------+
double CSignalGM::GM(int Index, int Mask = 8)
{  vector _gm;
   _gm.CopyRates(m_symbol.Name(), m_period, Mask, Index, m_slow);
   return(pow(_gm.Prod(), 1.0 / m_slow));
}
//+------------------------------------------------------------------+
//| Inverse Geometric Mean                                           |
//+------------------------------------------------------------------+
double CSignalGM::GM_(int Index, int Mask = 8)
{  double _am = AM(Index, Mask);
   double _gm = GM(Index, Mask);
   return(_am + (_am - _gm));
}
Once again, we are using the vector data types and their inbuilt functions to expedite our coding process. The bands’ buffers are two, consisting of an upper band and lower band. These too are retrieved from the two functions listed below:
   double            BandsUp(int Index)
   {  vector _bu;
      _bu.CopyRates(m_symbol.Name(), m_period, 2, Index, m_slow);
      return(GM_(Index, 2) + (2.0 * _bu.Std()));
   }

   double            BandsDn(int Index)
   {  vector _bd;
      _bd.CopyRates(m_symbol.Name(), m_period, 4, Index, m_slow);
      return(GM(Index, 4) - (2.0 * _bd.Std()));
   }
The two functions simply return the upper bands price and the lower band price for the functions ‘BandsUp’ and ‘BandsDn’ respectively. These returned values can easily be reconstituted into parallel buffers for analysis in a number of forms. We are simply using them in a cross-over fashion to establish if we potentially have openings for long or short positions. To check for a long position, we would need confirmation that the price has crossed the lower band from below, i.e. it was below the lower band but is now above it. Similarly, to check for short positions we would need to confirm a price cross of the upper band from above where price had been above the upper band but in a subsequent price bar is now below it.
Custom Signal Classes
Each of these 3 Pythagorean MAs can be combined into a single class with an additional parameter that allows the selection of one of them to be used in an Expert Advisor. We however implement these as separate signal classes because we are going to explore the weight setting of the signal classes by performing an optimization for the ideal weighting of each average so as to get a sense of which of these signals and by extension which of the averages, is more useful in forecasting and placing orders with our Expert Advisor.
However, before we get an idea of relative importance, it may be diligent to first run independent tests of each signal class on their own such that whatever relative weights we get in the end can serve as a validation (or refutation) of these first test runs that we’d have made. So, we’ll start by developing an Expert Advisor for each of the 3 averages and test them independently to assess their own performance. Once we have these results, we’d then run tests on an Expert Advisor that combines all three averages that we’ll optimize for the relative weightings of each of these averages.
To develop a long and short condition for the arithmetic mean signal class, we’ll simply check for a change in the cross-over value as returned by the ‘Crossover’ function, whose code is shared above. Our long and short condition code are quite short, and both of these are shared below:
//+------------------------------------------------------------------+
//| "Voting" that price will grow.                                   |
//+------------------------------------------------------------------+
int CSignalAM::LongCondition(void)
{  int result = 0;
   if(CrossOver(StartIndex()) > 0.0 && CrossOver(StartIndex()+1) < 0.0)
   {  result = int(round(100.0 * ((CrossOver(StartIndex()) - CrossOver(StartIndex()+1))/fmax(fabs(CrossOver(StartIndex()))+fabs(CrossOver(StartIndex()+1)),fabs(CrossOver(StartIndex()+1))+fabs(CrossOver(StartIndex()+2))))));
   }
   return(result);
}
//+------------------------------------------------------------------+
//| "Voting" that price will fall.                                   |
//+------------------------------------------------------------------+
int CSignalAM::ShortCondition(void)
{  int result = 0;
   if(CrossOver(StartIndex()) < 0.0 && CrossOver(StartIndex()+1) > 0.0)
   {  result = int(round(100.0 * ((CrossOver(StartIndex()+1) - CrossOver(StartIndex()))/fmax(fabs(CrossOver(StartIndex()))+fabs(CrossOver(StartIndex()+1)),fabs(CrossOver(StartIndex()+1))+fabs(CrossOver(StartIndex()+2))))));
   }
   return(result);
}
As always, it appears the crux comes to normalizing the result value in the event that you have a potential signal. For the AM, we are using the current change in cross-over values divided by the largest in magnitude of the prior cross-over values. Clearly this is an area that can be customized a lot and the reader is welcome to their own implementation, this chosen one though does tend to capitalize on the arithmetic mean and is therefore used.
The harmonic mean long and short condition will in turn use the ‘Divergence’ functions to filter for potential openings of both long and short positions. We do have the short and long conditions as indicated below:
//+------------------------------------------------------------------+
//| "Voting" that price will grow.                                   |
//+------------------------------------------------------------------+
int CSignalHM::LongCondition(void)
{  int result = 0;
   m_close.Refresh(-1);
   if(Divergence(StartIndex()+1) > 0.0 && m_close.GetData(StartIndex()) > m_close.GetData(StartIndex()+1))
   {  result = int(round(100.0 * (Divergence(StartIndex()+1)/(fabs(Divergence(StartIndex()))+fabs(Divergence(StartIndex()+1))))));
   }
   return(result);
}
//+------------------------------------------------------------------+
//| "Voting" that price will fall.                                   |
//+------------------------------------------------------------------+
int CSignalHM::ShortCondition(void)
{  int result = 0;
   m_close.Refresh(-1);
   if(Divergence(StartIndex()+1) > 0.0 && m_close.GetData(StartIndex()) < m_close.GetData(StartIndex()+1))
   {  result = int(round(100.0 * (Divergence(StartIndex()+1)/(fabs(Divergence(StartIndex()))+fabs(Divergence(StartIndex()+1))))));
   }
   return(result);
}
With the harmonic mean, we are looking for any positive divergence where highs are rising and lows are falling, and this is followed by a close price rise for a bullish opening or a close price fall for a bearish opening. These two events happen sequentially and not on the same bar. This divergence is in many ways the opposite of the more popular engulf pattern that features, usually, falling highs and rising lows.
Once we have an opening, for either long or short, the next question then is to determine the integer value of the result which is always the output for the long and short conditions of these signal class functions. Once again there are several approaches that can be taken here in quantifying the result and several of these approaches could be related to other indicators besides the harmonic mean. However, for our purposes we want to lean even more on the harmonic mean in establishing the result amount, which is why we are using a ratio of the current divergence to the magnitude of previous values in coming up with an integer value in the 0 – 100 range.
This result therefore simply means that the larger the current divergence, the more bullish or bearish we would be. In the denominator of this result ratio (that we normalize to the 0 – 100 range via percentage) is the current and previous divergence values. This leads us to applying the geometric mean.
The GM is implemented by computing upper and lower Bollinger bands values that are based on the GM buffers, as shared above. To get this into an actionable signal, we’d check for a lower band price cross and an upper band price cross for bullish and bearish setups respectively, as mentioned above. This is coded as follows in the long and short conditions:
//+------------------------------------------------------------------+
//| "Voting" that price will grow.                                   |
//+------------------------------------------------------------------+
int CSignalGM::LongCondition(void)
{  int result = 0;
   m_close.Refresh(-1);
   if(m_close.GetData(StartIndex()) > m_close.GetData(StartIndex() + 1) && m_close.GetData(StartIndex()) > BandsDn(StartIndex()) && m_close.GetData(StartIndex() + 1) < BandsDn(StartIndex() + 1))
   {  result = int(round(100.0 * ((m_close.GetData(StartIndex()) - m_close.GetData(StartIndex()+1))/(fabs(m_close.GetData(StartIndex()) - m_close.GetData(StartIndex()+1)) + fabs(BandsUp(StartIndex()) - BandsDn(StartIndex()))))));
   }
   return(result);
}
//+------------------------------------------------------------------+
//| "Voting" that price will fall.                                   |
//+------------------------------------------------------------------+
int CSignalGM::ShortCondition(void)
{  int result = 0;
   m_close.Refresh(-1);
   if(m_close.GetData(StartIndex()) < m_close.GetData(StartIndex() + 1) && m_close.GetData(StartIndex()) < BandsUp(StartIndex()) && m_close.GetData(StartIndex() + 1) > BandsUp(StartIndex() + 1))
   {  result = int(round(100.0 * ((m_close.GetData(StartIndex()+1) - m_close.GetData(StartIndex()))/(fabs(m_close.GetData(StartIndex()) - m_close.GetData(StartIndex()+1)) + fabs(BandsUp(StartIndex()) - BandsDn(StartIndex()))))));
   }
   return(result);
}
The size of the result as we have followed with the arithmetic mean and harmonic mean will also lean more towards the geometric mean and not use some other indicator. So, to that end, with GM, the result is a ratio of the change in close price to the gap between the upper and lower bands of our derived Bollinger bands. Once again, this result means that a bigger price move relative to the compression of the bands gap, should indicate a larger entry or close signal. Close signal because the long and short condition not only set the opening thresholds, but they also determine the threshold at which their reverse positions are closed. So, in the input settings, we always have an open threshold and a close threshold. The later should be less than the former because you want to close long positions before taking on any short positions and vice versa.
In addition, possible alternative implementations of the GM derived Bollinger bands in establishing a signal could look at options that track the size of the gap between the upper and lower bands with the slope of the baseline average, and a few other iterations. Our application here is not the only way we could use or look at the Bollinger Bands.
Strategy Testing and Performance Evaluation
So, we are going to first perform independent test runs with each Pythagorean moving average on its own in an Expert Advisor and once we have the independent results of each we do a test run of an Expert Advisor that is assembled with all 3 Pythagorean mean signals, and we optimize this Expert Advisor to find the relative weighting of each of our means.
For uniformity, we’ll perform tests on one symbol EURJPY on the 20-minute time frame for the year 2023. For the arithmetic mean, we do get the following results:


For the harmonic mean, we get the following:


And finally, for the geometric mean, we have:


From the independent performance it seems the geometric mean carries a lot of sway followed by the simple cross-over arithmetic mean and with the laggard being the harmonic mean divergence. Our results are of course influenced by the fact that we are testing over a very small window and have performed specific customizations on how we interpret and implement the entry signals for each of the means. More testing is clearly needed in order to draw conclusions of relative performance, but what this points to is a relatively wide variability in performance, which can be a promising signal in preliminary testing.
If we now perform tests with all three averages and try to optimize them for relative weighting, we do get the following as one of our better results:


Clearly the independent results of the geometric mean are still the bell weather, of course subject to testing over longer periods. Interestingly, or ironically, in order to have all 3 signals perform together the best independent performer needs to be given the least weighting of 0.4. The independent laggard performers of harmonic mean and arithmetic mean are given heavier weightings of 1.0 and 0.9 which might explain why the overall performance of all three averages combined is not only less than the independent performance of the geometric mean, but the GM’s performance is still better even if you add the independent performances of both the arithmetic and harmonic mean. The settings for the combination Expert Advisor are shared below:

Conclusion
Past performance does not guarantee future results and as already mentioned extensive testing preferably over longer periods is always warranted and safer than going at it with little testing such as the one year we have here. As always, we assemble the attached code for these signals following the guidelines shared in the articles here and here. The geometric mean that is most weighted to smaller values of the three means considered in this article shows promise in the Bollinger Bands setting, however we have not looked at the harmonic mean in a similar bands setting to have any more definitive conclusions on this relative performance. And also, besides Bollinger Bands, the AM cross-over or the HM divergence there are other moving average implementations in oscillator form like the OSMA or TRIX that we have not explored. These and other methods can be considered in weighing the relative potential of the Pythagorean means.
- Free trading apps
- Over 8,000 signals for copying
- Economic news for exploring financial markets
You agree to website policy and terms of use