
MQL5 Wizard Techniques you should know (Part 52): Accelerator Oscillator
Introduction
The Accelerator Oscillator is another Bill Williams Indicator that is designed to keep track of momentum and though common as it is derived from another oscillator that we covered in an earlier article, we take look at how various patterns exhibited by it could be used or even combined in ways that may give one an edge. This indicator specifically aims to track acceleration or deceleration of the momentum, which can be used in providing signals for possible trade entries and exits. Acceleration is different from velocity.
The difference between the two in financial markets is bound to be nuanced, especially for traders that operate manually from the MetaTrader terminal. While velocity points to rate of change of price and acceleration rightly implies rate of change of velocity. To properly quantify each separately, we use different indicators. For velocity, the common go-to indicators are: Rate of Change (ROC), MACD? RSI, and probably Simple Exponential Moving Average. For acceleration, we typically have acceleration Bands, MACD histogram, Stochastic Oscillator, and our feature for this article, the Accelerator Oscillator. This Oscillator as mentioned is derived from the Awesome Oscillator that we considered in an earlier article and to recap its formula was:
![]()
However, that for the Accelerator oscillator is:
![]()
Where, as before:
AO is the current Awesome Oscillator reading
SMA is the simple moving average
Key Components of this Oscillator are the zero line which stands for a balance point of the accelerating momentum, whereas one would expect positive AC values point to a bullish momentum while negative values indicate a bearish momentum. The colour indication also follows closely what we saw with previous Bill Williams’ oscillators where green bars above or below the zero line are an indication of increasing momentum for bullish or bearish setups respectively, while red bars also on either side of the zero line would indicate waning momentum.
The AO is useful for its early detection of Trend Reversals by focusing on shifts in momentum before price reversals. It also tends to be versatile across markets including forex, stocks, and commodities, plus it is relatively simple to interpret given the familiar histogram visual representation. So, to sum up here, practical use cases are in identifying entry-signals where in principle buying is when the AC is above the zero line and selling when it is below; plus trend confirmation where AC can work in tandem with other indicators such as the already covered Awesome Oscillator or even moving averages in affirming market trends.
It does, though, have its limitations, as with many indicators. Besides often requiring complementary indicators to confirm its signals, such as trend and volume indicators, it tends to lag a lot in Sideways or choppy markets. In addition, AO is generally sensitive to short-term price fluctuations, which makes it potentially prone to a lot of false signals. And finally, its zero line cross-overs are often less trustworthy than those of its counterpart the Awesome Oscillator, which speaking of it would be good to compare and contrast with AO before we delve into AO's patterns.
Since we have already covered the basic formula definitions of each, we will skip to their respective purpose and interpretation. The Awesome Oscillator (AO) shows overall market momentum and helps identify trends and reversals, while AC builds on AO to help show the rate of change of momentum to better gage whether momentum is picking up or decelerating. If AC is above zero and on the up and up, momentum is accelerating, if it is below zero and decreasing, then momentum is accelerating bearishness.
The zero line is also significant for both oscillators as with the AO, a crossing is a major indication of momentum shift where any movement to the upper side is bullish while to the lower end is bearishness. For AC, though, the zero-line is often less critical, with more emphasis being put on the direction of the histogram bars as to whether they are rising or falling. Since it is not as powerful an indicator as the AO per se, it is often best applied at identifying positive but falling histograms to signify deceleration or negative but rising bars to indicate reducing bearish pressure.
Visually, both are often represented as histograms with AO being generally smoother with its movements while AC, because of its sensitivity to acceleration or deceleration is more rugged with fluctuations. With this general pro-AO sentiment mentioned, it is also worth noting that of the two oscillators, AO is often the laggard. This is because it relies on long-term averages (SMA-5 and SMA-34) which smoothen out noise but make AO less sensitive to short-term changes. The AC, on the other hand, is more responsive and reflects momentum shifts earlier due to its focus on the rate of change of AO.
This then leads to suitability of each. If we consider AO first, it is often adept at trend identification since it relies on the zero-line crossovers; in reversal identification of its twin peak signal is often used and for long-term momentum analysis, AO is often ideal for traders seeking a broader view of market momentum. The AC, on the other hand, is geared towards: detecting momentum acceleration, which can point to earlier entry/ exit than the AO; identifying short-term signals that often serve to confirm the signals of a secondary more long-term indicator like the AO, and a high sensitivity to price action which could come in handy for some traders that utilize strategies like scalping.
So, to sum up the AO-AC comparison, AO is better at understanding broader trends and identifying reversals, but it is slower to react; while AC offers faster nimbler signals by dwelling on momentum acceleration making it ideal for traders needing fast decisions made. And as already argued both can be used together with AO identifying the trends and AC timing entries and exits based on momentum change.
With those clarifications, let's move on to the AC patterns. We are considering 8 patterns in total and as always, we test each pattern individually first and then towards the end of the article we look at how a combination of some or all of the patterns could make a difference in the performance of the Expert Advisor over its limited test windows.
We are testing the pair GBP USD for this article on the 4-hour time frame for the year 2023. The test results presented for each pattern are from optimization runs and are not cross validated for arguments that have already been presented in previous articles. For new readers though, who may be curious, you look at them in the past indicator pattern articles. Also, the code that is attached at the bottom is meant to be assembled via the MQL5 Wizard, and there are guides here and here on how to do this.
Zero-Line Crossover
Our first pattern, pattern-0 is basic and centres on the zero line. Its bullish Signal is when the AC crosses the zero line from below to above it, suggesting a shift from deceleration to acceleration of bullish momentum. Like wise, when the AC crosses the zero line from above to go below it, this indicates a shift from deceleration to acceleration of bearish momentum. We implement this pattern in MQL5 as follows:
//+------------------------------------------------------------------+
//| Check for Pattern 0.                                             |
//+------------------------------------------------------------------+
bool CSignalAccelerator::IsPattern_0(ENUM_POSITION_TYPE T)
{  if(T == POSITION_TYPE_BUY && AC(X() + 1) < 0.0 && AC(X()) > 0.0)
   {  return(true);
   }
   else if(T == POSITION_TYPE_SELL && AC(X() + 1) > 0.0 && AC(X()) < 0.0)
   {  return(true);
   }
   return(false);
}
For this article, all our tests are on the pair GBP USD on the one-hour time frame for the year 2023. If we test our wizard assembled Expert Advisor with just this pattern, pattern-0, we would need to assign the input parameter for patterns used to 1. Favourable test runs from optimized settings present us with the following report:

Key points to consider with pattern-0 are that, as already stressed in the intro, it is not a stand-alone indicator. It is best paired with other indicator for price action analysis. Furthermore, even though it would be paired with another indicator, confirmation is always key. It is always best to stagger the gathering of entry/ exit signals, meaning if we get a cross-over on the current bar, then the signal from the secondary indicator is best read off on subsequent future bars. False Signals are bound to happen, as with most indicators, what is Key to look out for is if the markets are choppy or whipsawing a lot. Choppy markets tend to be fraught with false signals for this pattern. If market conditions are trendy, though, then traders can expect to capitalise on a winning streak(s) since it tends to be more reliable then.
Consecutive Green Bars Above Zero
Our second pattern, pattern-1, is based on the count of coloured bars above or below the zero line. If the AC shows two or more consecutive green bars above zero, this can be taken as a strong bullish momentum signal, which portends continuation of an uptrend. On the flip, if more than one bar appears below the zero line, this can be taken to represent an up tick in bearish momentum and also a potential continuation in the downtrend. We implement this in MQL5 as follows:
//+------------------------------------------------------------------+
//| Check for Pattern 1.                                             |
//+------------------------------------------------------------------+
bool CSignalAccelerator::IsPattern_1(ENUM_POSITION_TYPE T)
{  int _i = X();
   if(T == POSITION_TYPE_BUY && UpperColor(_i) == clrGreen && UpperColor(_i + 1) == clrGreen && UpperColor(_i + 2) == clrGreen)
   {  return(true);
   }
   else if(T == POSITION_TYPE_SELL && LowerColor(_i) == clrRed && LowerColor(_i + 1) == clrRed && LowerColor(_i + 2) == clrRed)
   {  return(true);
   }
   return(false);
}
This signal does call for observing the magnitude of the bars as their size whether increasing or not does indicate the build up to the prevalent trend, i.e. whether it is waning or firing up. Other key Considerations for pattern 1 are confirmation, as with the previous one, and using it in preferably trending markets. Test runs that use strictly this pattern by assigning the pattern's used input parameter to 2 do give us the following report:

Divergence Between AC and Price
Pattern-2 exploits divergence, with a bullish Signal being indicated if the price forms lower lows while the AC is forming higher lows. On the flip, when price forms higher highs and the AC is indicating lower highs, this is often taken as it portends a reversal to the downside. We do implement this in MQL5 as follows:
//+------------------------------------------------------------------+
//| Check for Pattern 2.                                             |
//+------------------------------------------------------------------+
bool CSignalAccelerator::IsPattern_2(ENUM_POSITION_TYPE T)
{  if(T == POSITION_TYPE_BUY && Low(X() + 3) > Low(X()) && AC(X() + 3) < AC(X()))
   {  return(true);
   }
   else if(T == POSITION_TYPE_SELL && High(X() + 3) < High(X()) && AC(X() + 3) > AC(X()))
   {  return(true);
   }
   return(false);
}
This pattern serves as a significant technical analysis signal with potential to identify reversals. Divergence is in essence when price-action and the AC are on different trajectories, which often (as a rule) implies the exhibited price-action has underlying weaknesses and therefore a reversal is imminent. Testing with just this pattern, whose index for patterns used is 4, does give us the following report:

As already mentioned with patterns 0 & 1, accompanying this with a confirmation, studying what market conditions it's best adept to, being wary of false signals by leaning more to the larger time frames than smaller ones, and proper risk management; are all factors that should be paid attention to.
Reversal Signal Near Zero
Pattern-3 whose solo use index (index assigned to the input parameter, ‘patterns-used’) is 8, is the reversal of the AC when close to its zero line. With this pattern, a bullish reversal is when the AC moves from red to green when above but close to the zero-bound, while a bearish reversal is as expected a flip from green to red when below but close to the zero line. The quantification of how close AC is to the zero is certainly a matter for fine-tuning.
The arguments why this could be crucial are obvious and perhaps bear mentioning nonetheless. It is important to identify and ‘separate’ strong signals from the weak.
This is because magnitude often acts as a proxy for momentum strength, with larger values near the zero line often signalling significant reversals (which are in effect continuations from the prior trend given the large gap from zero). So to filter from false signals, a sizeable threshold value that filters out the many reversals or U shaped patterns the AO may indicate. This proper sizing of the AO zero gap can also act to fine tune entry and exits if it's taken as a gauge of market sentiment because its distance can be used as a guide for the distance of the stop loss level. It's also informative in some comparative analyses in cases where it is important in identifying standard pullbacks from proper reversals, for instance when back testing.
The quantification of this gap can be accomplished in probably an unlimited number of ways. For our purposes, we will dwell on just a few that are more closely related to the AO Oscillator itself. First up would be absolute indicator values, where for instance depending on the security traded this value could be 0.005 if the point size is 1e-5 or 0.5 if the traded security is a YEN cross. With this threshold, the only AO reversals that will get considered would be those whose magnitude value from zero is more than the absolute Value.
Another quantification metric could be relative Magnitude, where current AO values are weighed against recent or historical averages of the AO. This approach can be thought of as an adaptable threshold that changes depending on market conditions. A user-defined multiplier k can be applied to the historical AO averages or recent values in fine-tuning the threshold amount. Another possible threshold is the standard deviation-based threshold. This is also slightly formulaic, as follows:
![]()
where
- mu is mean
- sigma is the standard deviation
- and n is a user optimized parameter.
Time specific magnitudes are another way of quantifying the zero bound magnitude. With this approach, an absolute value can be assigned for volatile or news-event periods and an alternative threshold can be used when the markets are calmer. This in principle works like the relative Magnitude threshold mentioned above, but it is more time-centric.
These are a few of the possible ways this threshold of the AO from the zero line could be set. In doing to do, though, it may be important to be mindful of a few pitfalls that could ensnare this process and lead to unintended results. Without being too elaborate, these are: setting overly specific thresholds, ignoring Market Context, not considering the lagging nature of the AO Oscillator, misinterpreting Small Values, and market noise.
For our purposes in this article we are not quantifying how close the AC needs to be to the zero bound as we'll simply be looking for any U turn that is close to the zero. We implement this in MQL5 as follows:
//+------------------------------------------------------------------+
//| Check for Pattern 3.                                             |
//+------------------------------------------------------------------+
bool CSignalAccelerator::IsPattern_3(ENUM_POSITION_TYPE T)
{  if(T == POSITION_TYPE_BUY && AC(X() + 2) > AC(X() + 1) && AC(X() + 1) > 0.0 && AC(X() + 1) < AC(X()))
   {  return(true);
   }
   else if(T == POSITION_TYPE_SELL && AC(X() + 2) < AC(X() + 1) && AC(X() + 1) < 0.0 && AC(X() + 1) > AC(X()))
   {  return(true);
   }
   return(false);
}
Solo testing with just this pattern, with the input parameter for patterns used being assigned 8, presents us with the following results:

Pattern-3 is inherently not a new signal formation pattern or a reversal pattern but more of a trend continuation pattern. Guidelines on its use are not very different from what we've shared above.
Increasing Coloured Bar Sizes
Our pattern-4 is a bit broad in that it aims to capitalise on the increasing size of AC bars that are of a specific colour. When the AC displays an increasing number of green bars (regardless of whether they are above or below the zero line), it does provide a sign of accelerating bullish momentum. Similarly, if a display of an increasing number of red bars is exhibited regardless of their position relative to the zero, this portends accelerating bearish momentum.
Because this pattern is therefore a bit too broad, we are implementing it in a slightly narrow sense of considering only increasing coloured bar count when on the opposite side of the indicated momentum. So for the bullish Signal, we'd have an increasing number of green bars below the zero line (often marked by shortening bars). Likewise, for the bearish Signal, we would have an increasing number of shortening red bars above the zero line as an indication of picking up bearish momentum. We implement this in MQL5 as follows:
//+------------------------------------------------------------------+
//| Check for Pattern 4.                                             |
//+------------------------------------------------------------------+
bool CSignalAccelerator::IsPattern_4(ENUM_POSITION_TYPE T)
{  int _i = X();
   if(T == POSITION_TYPE_BUY && LowerColor(_i) == clrGreen && LowerColor(_i + 1) == clrGreen && LowerColor(_i + 2) == clrGreen)
   {  return(true);
   }
   else if(T == POSITION_TYPE_SELL && UpperColor(_i) == clrRed && UpperColor(_i + 1) == clrRed && UpperColor(_i + 2) == clrRed)
   {  return(true);
   }
   return(false);
}
Key Considerations for this pattern is that it can overlap quite a bit with the divergence pattern we've already covered above. If higher lows of green bars below the zero line are being formed and the price action is also signalling lower to flattening lows, then that could serve as extra confirmation for a bullish Signal with a price divergence to the upside potentially in play. Conversely, lower highs of red bars above the zero line with price action showing higher to flattening highs could signal a price pullback is on the cards. As with the bullish Signal, this then would require little to no extra confirmation. Test results for this pattern alone when we assign patterns used input parameter to 16, present us with the following report:

As always these indicated test runs are meant to speak to the ‘potential’ of the pattern not future results per se. They are from input settings of a short optimization stint, and these settings have not been forward walked or cross validated. The reader, as always, is invited to take this on with his intended trade security, and his intended broker’s data.
AC Peaks and Troughs
Our sixth pattern, pattern-5, combines the action of the AC Oscillator with the price action patterns with emphasis being placed on the fractal points. A bullish peak signal is defined when a price peak is followed by an increase in the green bar size of the AC Oscillator, when the oscillator is above the zero line. This serves to suggest a continuation of bullish momentum. Similarly, a bearish trough signal is when a trough fractal in price action is followed by a lower red AC bar that would be below the zero line. This would also suggest a continuation of bearish momentum. We code this in MQL5 as follows:
//+------------------------------------------------------------------+
//| Check for Pattern 5.                                             |
//+------------------------------------------------------------------+
bool CSignalAccelerator::IsPattern_5(ENUM_POSITION_TYPE T)
{  if(T == POSITION_TYPE_BUY && Close(X() + 2) < Close(X() + 1) && Close(X() + 1) > Close(X()) && UpperColor(X()) == clrGreen && AC(X()) > 0.0)
   {  return(true);
   }
   else if(T == POSITION_TYPE_SELL && Close(X() + 2) > Close(X() + 1) && Close(X() + 1) < Close(X()) && LowerColor(X()) == clrRed && AC(X()) < 0.0)
   {  return(true);
   }
   return(false);
}
It's worth noting that this pattern ought to be handled with some caution as a peak high point on the AC or even in price can indicate a potential reversal in the same way that a trough fractal or AC can also point to a bullish reversal. Interpretation of pattern-5 can also be a bit subjective given that a few metrics could to be put into consideration if one is to properly size up or weigh the magnitude of each signal value. These include height & depth of the peak/ troughs, their frequency, and tick value of their divergence.
Higher peaks and deeper troughs often indicate stronger momentum so to modify our code implementation above, we could add a point threshold or multiple of the current ATR in gauging threshold size such that, as a filter, only peaks/ troughs whose swing move is more than the threshold are deemed pattern-signals. Also, the frequency metric, whose count in this case relates inversely yo the strength of the signal, could count as a denominator to the peak/ trough swing size. This is because the more frequent the peaks and troughs , usually the more volatile the markets. Because as a rule peaks always follow troughs and vice versa, an effective way of counting them would be to see how many a present within a fixed look back period which could be a week or a day, depending on the timeframe that is being used.
Finally, divergence could lend itself to pattern-5 since peaks and troughs are under consideration here, and they may not align as defined in the pattern but rather form a trough-peak pair for instance, which condition could indicate a divergence. On testing with just this pattern by assigning the input pattern for maps used as 32, we do get the following test run results:

Colour Change After a Strong Trend
Our seventh pattern, pattern-6, stems from colour changes to the AC Oscillator. And because this change is significant depending on where it happened relative to the zero line, this could be too broad, as we saw with pattern-4. We therefore restrict our definitions of each signal to a particular side of the zero line. Exhaustion of bullish momentum would thus be a change in the AC bars above the zero line from colour green to colour red, which would indicate a bearish Signal. Likewise, a change from red bars to green bars when below the zero line would suggest exhaustion of bearish momentum and therefore suggest a bullish pullback is in the offing. We implement this as follows in MQL5:
//+------------------------------------------------------------------+
//| Check for Pattern 6.                                             |
//+------------------------------------------------------------------+
bool CSignalAccelerator::IsPattern_6(ENUM_POSITION_TYPE T)
{  if(T == POSITION_TYPE_BUY && ((UpperColor(X() + 1) == clrRed && UpperColor(X()) == clrGreen) || (LowerColor(X() + 1) == clrRed && LowerColor(X()) == clrGreen)))
   {  return(true);
   }
   else if(T == POSITION_TYPE_SELL && ((UpperColor(X() + 1) == clrGreen && UpperColor(X()) == clrRed) || (LowerColor(X() + 1) == clrGreen && LowerColor(X()) == clrRed)))
   {  return(true);
   }
   return(false);
}
This colour change occurs after a strong trend, so this needs to be checked for besides the colour change for a signal to be registered. Besides being an entry signal as we are applying it in this case, it can also serve as a point of profit taking given that we are reversing after a long trend. In fact, this idea of profit taking emphasises that this signal is not necessarily as strong or as reliable on its own, since it always occurs at the end or more likely in the middle of a strong trend. A test run with just this pattern with the input for patterns used assigned to 64 gives us the following report:

Flat AC Near Extreme Levels
Our eighth and final pattern, pattern-7, is got from observing the AC Oscillator when it is close to its extreme levels. With this pattern, a bullish opportunity is presented if the AC becomes flat near a significant low, with mostly red bars, and then begins to form green bars. Conversely, a bearish Opportunity is if the AC becomes flat near a significant high, with lots of green bars, and then a few red bars develop. As expected in this scenario, the AC would have to be below the zero line for the bullish Signal, while for the bearish it would have to be above the zero line. We code pattern-7 as follows in MQL5:
//+------------------------------------------------------------------+
//| Check for Pattern 7.                                             |
//+------------------------------------------------------------------+
bool CSignalAccelerator::IsPattern_7(ENUM_POSITION_TYPE T)
{  if(T == POSITION_TYPE_BUY && LowerColor(X() + 3) == clrRed && LowerColor(X() + 2) == clrRed && LowerColor(X() + 1) == clrRed && LowerColor(X()) == clrGreen)
   {  return(true);
   }
   else if(T == POSITION_TYPE_SELL && UpperColor(X() + 3) == clrGreen && UpperColor(X() + 2) == clrGreen && UpperColor(X() + 1) == clrGreen && UpperColor(X()) == clrRed)
   {  return(true);
   }
   return(false);
}
The flattening of the AC, especially at a particular threshold level, can be a huge signal that the prevalent trend is waning. Our implementation above does not include a threshold for the AC oscillator to reach before this pattern can be considered, however this would be a meaningful addition if the reader wants to make this pattern more inciseful. Test runs with input parameter of maps used assigned to 128 gives us the following report:

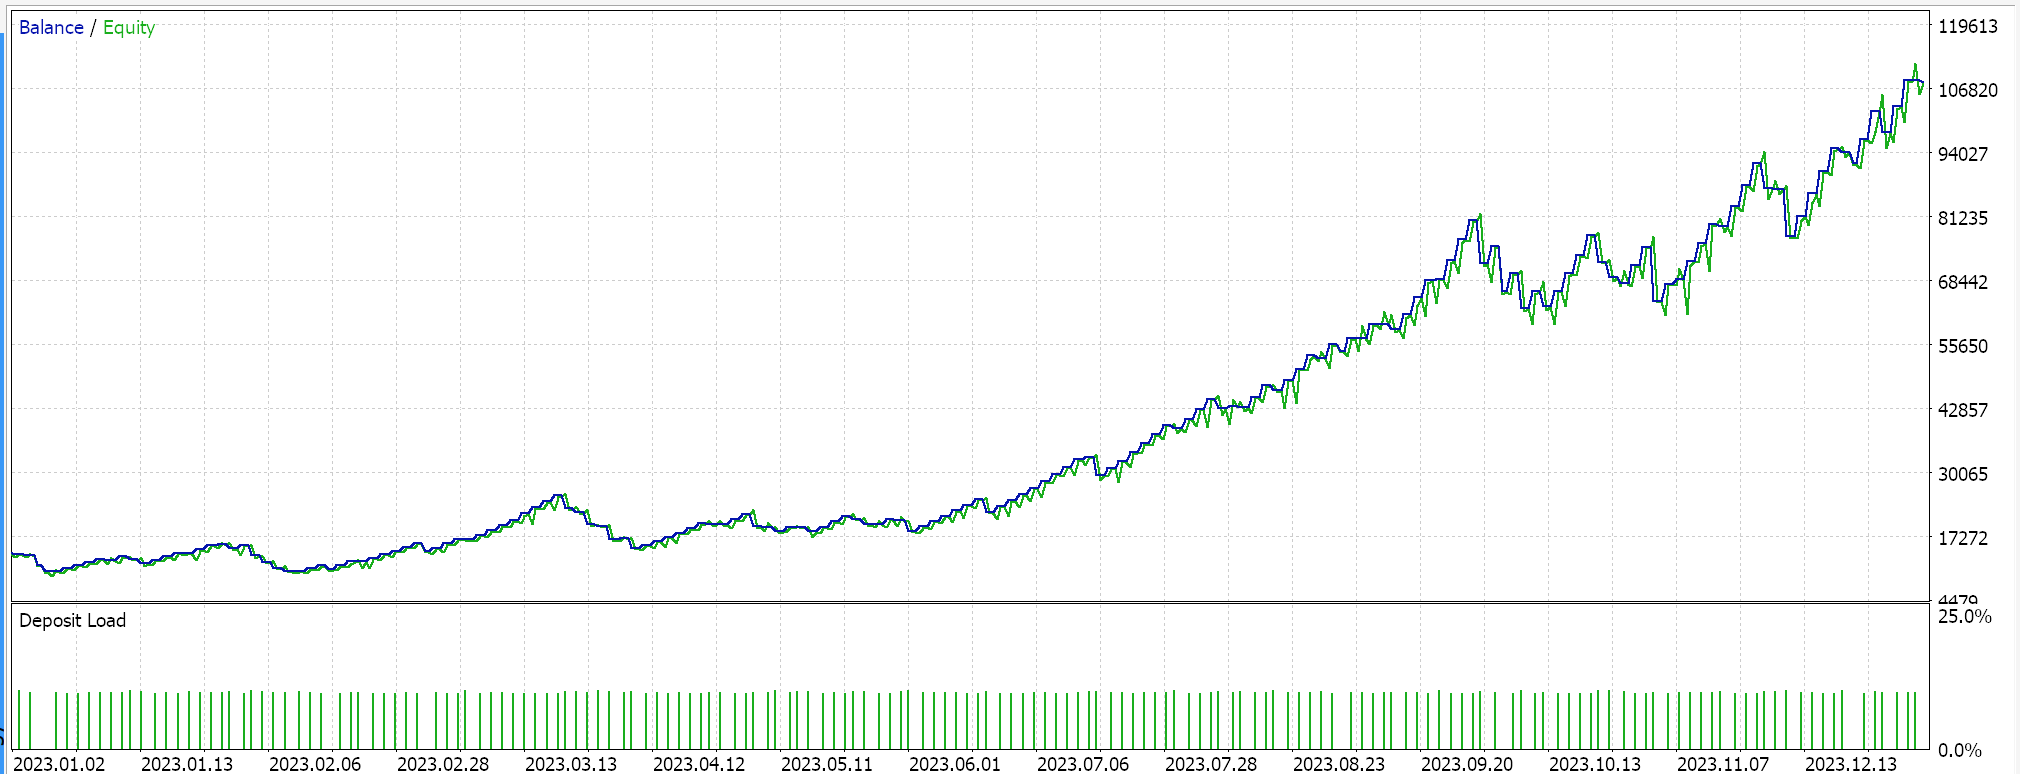
All the Patterns
If we perform an optimization run that seeks to establish the ideal combination of patterns, by primarily optimising the input parameter of maps used from 0 up to 255, some of our favourable results present us with the following report:

Conclusion
We have examined another Bill Williams Oscillator indicator that, though very similar to the Awesome Oscillator we considered in a recent article, it is more geared towards tracking accelerating momentum in price and not just it's changes. In addition, some slight changes were made to how the colors were determined by the custom signal from what was used in the Awesome oscilltor signal. These are viewable in the attached sourc code below. We now look to wrap up these indicator series, for now, with a couple of more pieces soon.
| File Name | Description |
|---|---|
| SignalWZ_52.mqh | Custom Signal Class File |
| WZ_52 | Wizard Assembled Expert Advisor whose header serves to show files used. |
- Free trading apps
- Over 8,000 signals for copying
- Economic news for exploring financial markets
You agree to website policy and terms of use