
Bill Williams Strategy with and without other indicators and predictions
Introduction
Bill Williams is a recognized trader, writer and psychologist from the USA, who has won credit for his contributions to trading and financial analysis. During his trading life, he has developed indicators and various trading strategies that have been used by plenty of traders.
Bill Williams has a doctorate in Psychology. Perhaps that is why he studied market sentiment. So, an extended approach can be implemented with a sentiment analysis script using AI to score the sentiment of traders' feelings by scraping web markets, such as social media platforms. At the end of the article, there will be an example of sentiment analysis applied to market news.
Bill Williams' psychological background helped him adapt psychological concepts to trading. He studied markets from a human perspective, trying to understand how emotions affect traders and their trading. Having a holistic view of the market, Bill Williams thought the market was chaotic and markets must be studied and traded taking this into account. To study the market, he suggested certain indicators, which we will study in this article.
This is an image of the EA with the indicators and oscillators we are going to use:
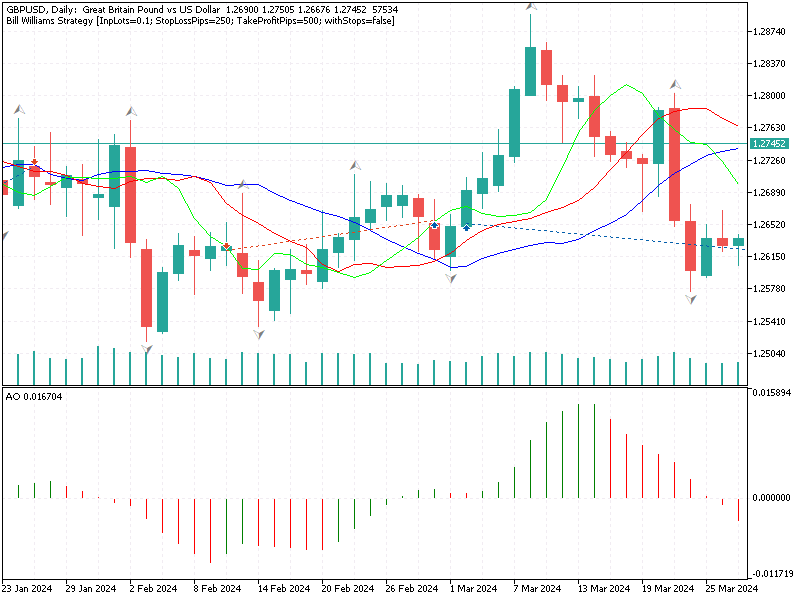
The image shows three indicators: The Alligator Indicator, The Awesome Oscillator (AO) and the Fractals. All these indicators together reflect the human behavior and the chaotic market.
The Alligator Indicator
The Alligator Indicator is made with three MAs, the Jaw (blue line), Teeth (red line) and Lips (green line). This indicator is designed to identify phases of sleepiness and wake time, it reflects human behavior as the market has series where the market is asleep (low activity), followed by a series where it wakes up (intense activity). Markets have consolidation phases followed by trend phases. Alligator helps identify when the market is asleep to not make trades because traders obtain benefits from the high volatility of the market.
In the low activity phase, the Alligator Indicator has its lines very near and intertwined.
In the high activity phase, the Alligator Indicator has its lines separated, indicating it wakes up and followed by a trend.
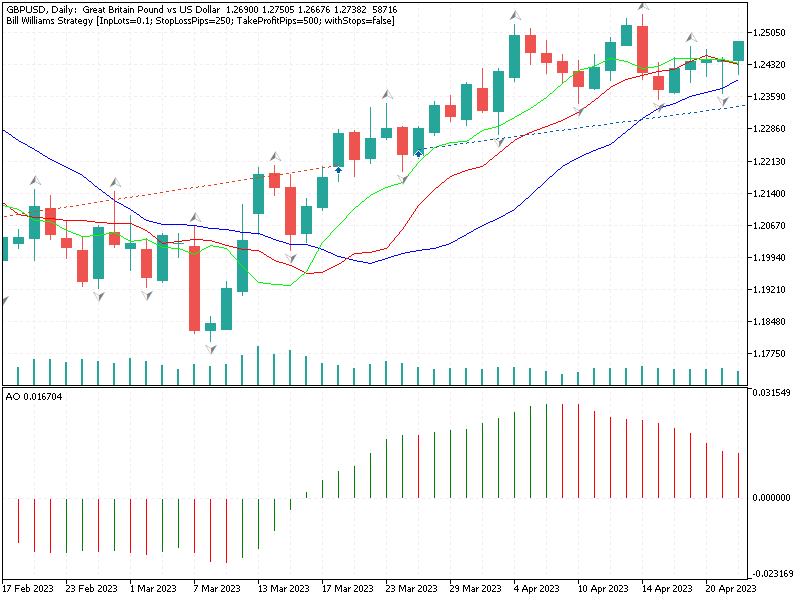
Note: As you can see in the image, the strategy tries to get a short position in a bullish trend to follow it. There are also more possibilities to adjust the strategy, you can make the order when the Alligator Indicator crosses and when the AO goes from below to above 0 and gets a longer run.
In the sleep phase, traders seem to be unwilling to trade, they are waiting for new data to appear or for the emergence of something that will cause a market trend. The sleep phase is where traders should not make decisions till they can see clearly where the market goes to. They should be aware of market movement directions, which become visible when it wakes up and shows the next trend.
So, in sleep phase, lines tend to be close to each other and move sideways. Thus, the indicator tells you there is no trend, and it is better to be out of trades.
When the lines start to separate, this means higher activity. If the green line is over red and over blue, there is an uptrend; if the green line is under red and under blue, this means a downtrend. Both situations mean it's the perfect moment to enter the market.
Green == Lips
Red == Teeth
Blue == Jaw
What does the Alligator Indicator have in common with Psychology?
The MAs are the average of the mean prices (ex: 2+3 / 2 = 2.5), but smoothing fluctuations of the prices and taking more into account the last prices, so, the fluctuations have less weight. This allows having a better scope of the trend. This is very human, trying to see with clarity the most important things among the noise existing in the market.
The Awesome Oscillator (AO)
AO shows the difference between the SMA of 5 periods and a SMA of 34 periods using the medium points of ((High + Low )/ 2).
The difference of two SMAs with two different periods shows the impulse of the market: the short SMA measures the impulses or quick changes of the market, and the long SMA measures the tendencies. This is similar to humans where they have short impulses and in the long run they have a tendency.
The impulse: The AO measures the strength of the impulse of the market, a positive AO means a positive impulse and a cross to the negative one the opposite.
The Fractals
The fractals, as defined by Bill Williams, are a series of five candlesticks that have specific requirements to be classified as either Bullish or Bearish Fractals.
- A Bullish Fractal is one that has a low lower than the two preceding bars' lows and the two succeeding bars' lows.
- A Bearish Fractal is the opposite; it has a high higher than the two preceding bars' highs and the two succeeding bars' highs.
Fractals identify possible points where the market may change direction. The psychology behind fractals is that they reflect key points of support and resistance. Traders identify these points to anticipate changes in direction based on the collective behavior of market participants.
Williams thought that financial markets were chaotic systems influenced by human behavior. He thought participants in the market conduct from emotions and psychological behaviors, which create patterns that look random but have subjacent structural bases that are identifiable.
When applying psychology to his indicators, it helped traders to understand human emotions like, hope, fear, avarice, and others, which affect decisions in trading. Trends and Consolidations reflect human psychology of periods of activity and relax.
Let's go with the strategy used. In the first code, we will make use of fractals, AO and Alligator Indicator.
The conditions to make a buy are shown below (very clear from the code). Remember, [0] is the actual place at that instant, and [1] is the minus 1 position:
alligatorLips[1] > alligatorTeeth[1] && alligatorTeeth[1] > alligatorJaw[1] && ao[1] > 0 && ao[1] > ao[2] && fractalsUp[1] != 0 && PositionsTotal()==0
The sell conditions are these:
alligatorLips[1] < alligatorTeeth[1] && alligatorTeeth[1] < alligatorJaw[1] && ao[1] < 0 && ao[1] < ao[2] && fractalsDown[1] != 0 && PositionsTotal()==0
As an example of strategies based on Bill Williams indicators, we can use crosses of AO from positive to negative and vice versa. You can try more possibilities and modify the code as you want. Please leave a comment in the article discussion if you managed to get much better results over the same periods used in the MetaTrader 5 Strategy Tester.
The conditions for closing the orders are as follows.
For Buy positions:
ao[0] < 0 || (alligatorLips[1] < alligatorTeeth[1] && alligatorTeeth[1] < alligatorJaw[1])
For Sell positions:
ao[0] > 0 || (alligatorLips[1] > alligatorTeeth[1] && alligatorTeeth[1] > alligatorJaw[1])
The entire code is available in the file Bill Williams Strategy.mq5 attached to the article.
Here I share the results which I received in the tester.
I used the following inputs and settings:


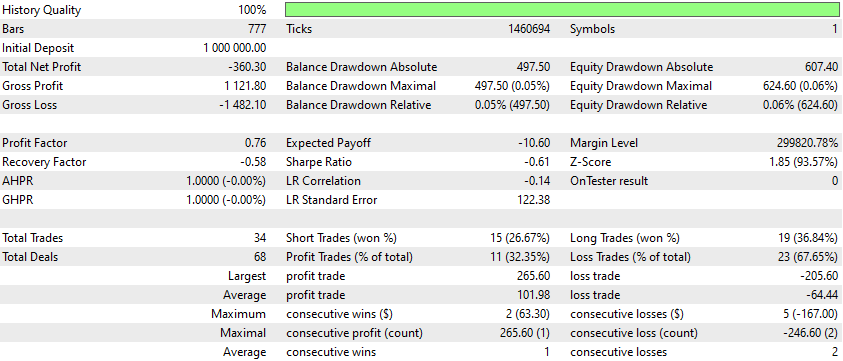
Ok, these results don't look very good, but this strategy seems to work on other time periods, so, we will keep this strategy and try to get better results adding other indicators or/and adding predictions.
How would this strategy evolve if we used ADX with it? With ADX, it should "see" better trending patterns, so let's see what we have to change:
 ADXHandle = iADX(Symbol(), Period(), 14);
   if(ADXHandle == INVALID_HANDLE)
     {
      Print("Error initializing ADX indicator: ", GetLastError());
      return INIT_FAILED;
     }
CopyBuffer(ADXHandle, 0, 0, 3, adx);
if(alligatorLips[1] > alligatorTeeth[1] && alligatorTeeth[1] > alligatorJaw[1] && ao[1] > 0 && ao[1] > ao[2] && fractalsUp[1] != 0 && adx[1] > ADXThreshold && PositionsTotal() == 0)
Now the results are:
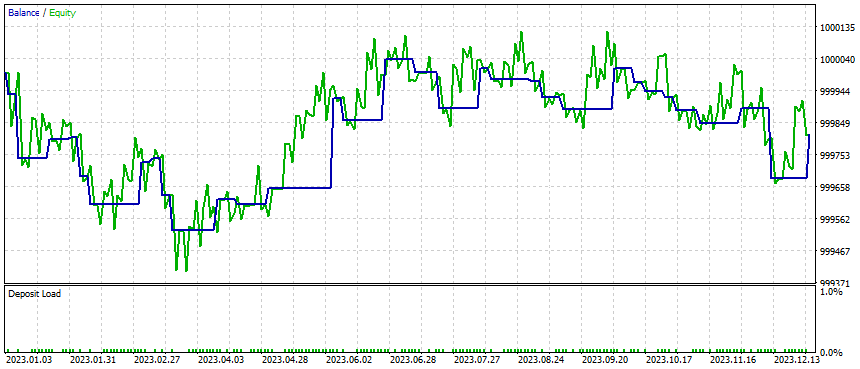
Still bad. Let's see if we use stops based on ATR.
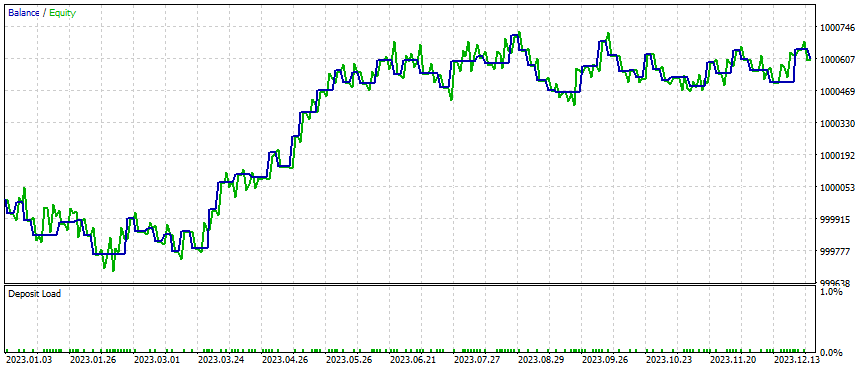
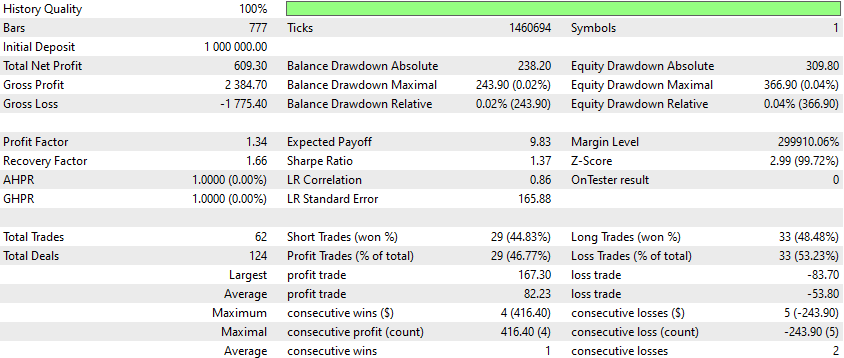
OK, this seems to be better. Now, what if we use deep learning and predictions? Let's see the results:
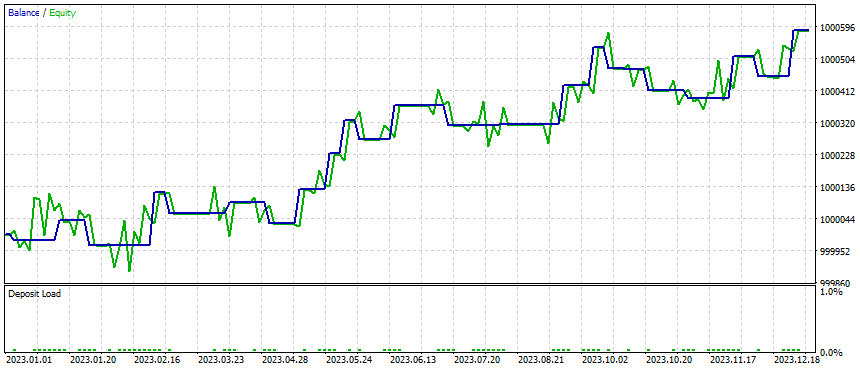
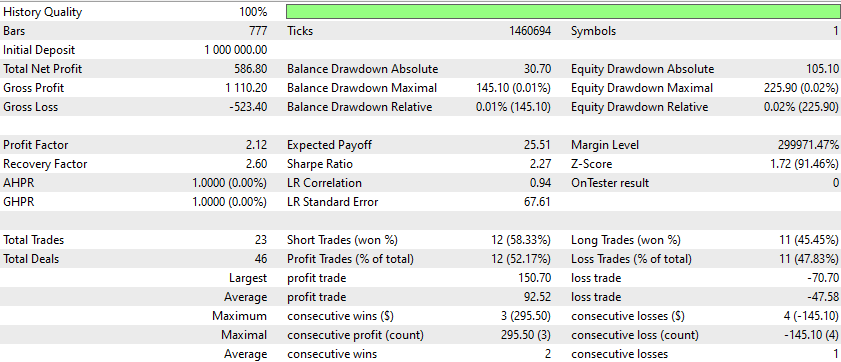
Take into account that the model uses 120 values as steps, so, I would at least redo the model each 120 days. So, results can be better if the model is actualized with last days.
The strategy uses 8-hour timeframe periods, and the ONNX model is set for 1-day values. So, remember when changing the script to apply 1D Periods to what's needed.
With optimizations when applying deep learning predictions, we have the following the overall results, and nearly all seem pretty good:
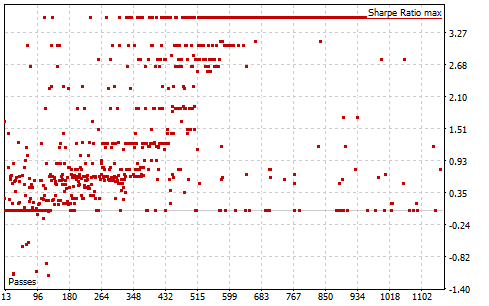
As you can see in this graph, nearly all the optimizations give positive Sharpe, this means the strategy is very reliable and performs well.
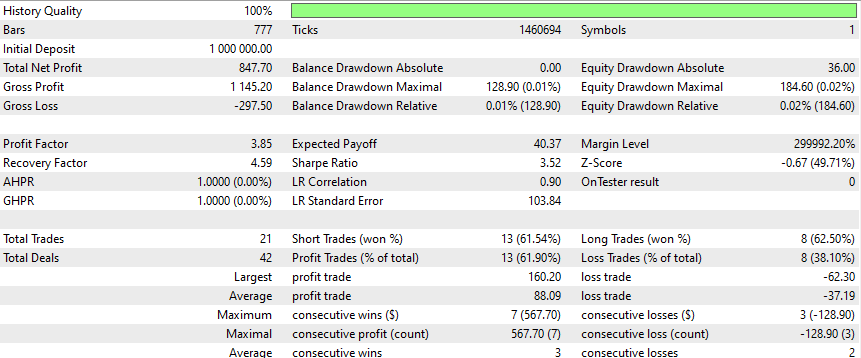
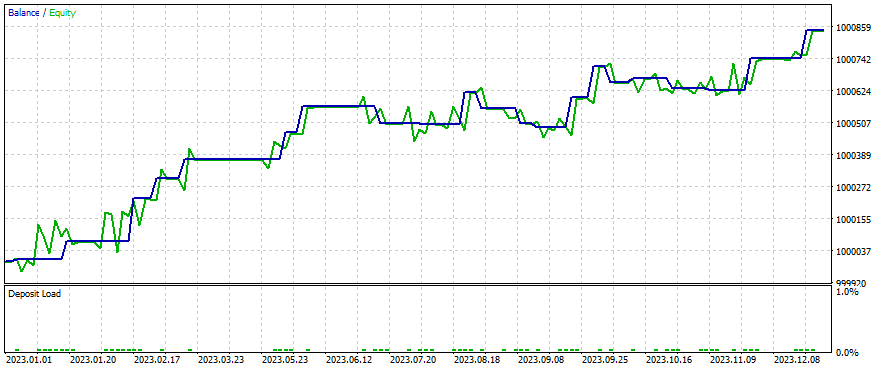
Note that we use the 8-hour time period for all tests and simulations, but we use a 1-day period for predictions. The aim of this is to have a prediction not too far away and not too soon, so we can get into trends. If you use predictions too far away, you will still get into trends, but you will not get into short trends, so you will have fewer orders in the test, and that is not useful for knowing if the whole strategy is good or not. For Stop Losses, we use ATR. We also added ADX to the strategy.
What can we see from this optimized version of the EA:
- The strategy is profitable with a total net profit of $847.70 and a high profit factor of 3.85, indicating that the strategy makes significantly more money on winning trades than it loses on losing trades.
- The recovery factor of 4.59 suggests the strategy can recover from losses relatively quickly.
- Both AHPR and GHPR are 1.0000, indicating no significant deviation in the average and geometric returns.
- The Sharpe Ratio of 3.52 is quite strong, suggesting good risk-adjusted returns.
- The balance and equity drawdown percentages are very low, implying minimal risk of significant losses.
What will we use to make the ONNX models?
We will use the recurrent script from python that I always use for this series of articles. It's attached at the end of the article. We just have to modify the symbol, and, if we know what we are doing, we can modify the time period or other things.
I will also attach the model used, so you can reproduce my results.
In addition, I will attach another .py script to create ONNX models with correlation and metrics, to know if the model is correct to use. The results of this script are here:
train_mse=0.000
test_mse=0.000
train_r2=0.994
test_r2=0.970
train_corr=0.997
test_corr=0.989
With the R2 of 97 % and a test correlation of 98.9 % we now know we can use this model for the EA.
These stats mean that, for example with the correlation of 98.9 %, the model has a prediction precision over the testing of 1 error against 99 good prediction. The R2 of 97 % is the coefficient of determination, which is the statistical measurement of the proportion of variance over the dependent variable (in this case the close prices) that is explained by the independent variable (the model). In other words, R2 expresses how good the values of the model prediction are adjusted compared to the real price values.
A good result for R2 is 85 %, and a good result for correlation is 95%. Any values above are considered good results, but you should be careful to avoid overfitting.
If you want to know more about Bill Williams, I recommend you read some of his best books, like:
- "Trading Chaos" (1995): This is one of his best and most known books, where he introduces the theory of chaos in financial markets and explains the indicators we have used in this article and how they can be used as opportunities to know points where to invest in trading.
- "New Trading Dimensions: How to Profit from Chaos in Stocks, Bonds, and Commodities" (1998): This book gets deeper in his methods and explains newer strategies more complex and advanced. He introduces his indicators and shows how to use them and combine them to get a better approach to the trading signals.
- "Trading Chaos: Maximize Profits with Proven Technical Techniques" (Second edition, 2004): This is an actualization of his original book and includes new strategies and new focus based on his experience and additional feedback of traders that have used his techniques.
Example of Sentiment Analysis of Markets News
Let's now consider some sentiment analysis of market news using an example in Python.
You must first install these libraries for Python:
pip install requests beautifulsoup4 textblob
Create a new Python script and copy and paste this code:
import requests
from bs4 import BeautifulSoup
from textblob import TextBlob

def get_eurusd_news():
    url = 'https://www.investing.com/currencies/eur-usd-news'
    headers = {'User-Agent': 'Mozilla/5.0'}
    response = requests.get(url, headers=headers)
    soup = BeautifulSoup(response.content, 'html.parser')

    # Encontrar todos los elementos <li> que contienen artículos de noticias
    articles = soup.find_all('li', class_='border-b')

    news = []
    for article in articles:
        title_tag = article.find('a', class_='mb-2 inline-block text-sm font-bold leading-5 hover:underline sm:text-base sm:leading-6 md:text-lg md:leading-7')

        if title_tag:
            title = title_tag.get_text(strip=True)
            news.append(title)

    return news

def analyze_sentiment(news):
    sentiment_results = []
    for article in news:
        analysis = TextBlob(article)
        sentiment = analysis.sentiment.polarity
        sentiment_results.append((article, sentiment))

    return sentiment_results

def summarize_sentiment(sentiments):
    positive = sum(1 for _, sentiment in sentiments if sentiment > 0)
    negative = sum(1 for _, sentiment in sentiments if sentiment < 0)
    neutral = len(sentiments) - positive - negative

    total = len(sentiments)
    summary = {
        'total': total,
        'positive': positive,
        'negative': negative,
        'neutral': neutral
    }

    return summary

news = get_eurusd_news()
if news:
    sentiments = analyze_sentiment(news)
    summary = summarize_sentiment(sentiments)

    for i, (article, sentiment) in enumerate(sentiments, 1):
        sentiment_type = 'Positive' if sentiment > 0 else 'Negative' if sentiment < 0 else 'Neutral'
        print(f"{i}. {article}\n   Sentiment: {sentiment_type} (Polarity: {sentiment})\n")

    print(f"Sentiment Summary: {summary}")
    print(f"Total articles: {summary['total']}, Positive: {summary['positive']}, Negative: {summary['negative']}, Neutral: {summary['neutral']}")
else:
    print("No news articles found for EUR/USD.")
This scrapes the news from Investing.com, reads the titles, and analyzes the data, giving a score. All the news releases add up, and end up giving a total score of the articles, so, with this, you can see how the market feels about a symbol and that can give you an idea if it is sleeping, is in a trend or is waking
1. Dollar edges lower, but on track for hefty weekly gains
   Sentiment: Neutral (Polarity: 0.0)

2. European stocks hit by weak global sentiment; UK retail sales slump
   Sentiment: Negative (Polarity: -0.125)

3. Dollar higher on US business activity boost
   Sentiment: Positive (Polarity: 0.25)

4. Dollar steadies after sharp gains post Fed minutes; sterling retains strength
   Sentiment: Negative (Polarity: -0.125)

5. European stocks largely higher; Nvidia earnings, PMI data in focus
   Sentiment: Positive (Polarity: 0.125)

6. Dollar higher against euro as Fed minutes support
   Sentiment: Positive (Polarity: 0.25)

7. Dollar steady ahead of Fed minutes, sterling gains on CPI release
   Sentiment: Positive (Polarity: 0.16666666666666666)

8. EUR/USD rally expected to persist, says BofA
   Sentiment: Negative (Polarity: -0.1)

9. Dollar firm as Fed officials urge patience on rate cuts
   Sentiment: Negative (Polarity: -0.2)

10. Dollar steady; Fed speakers could provide impetus
   Sentiment: Positive (Polarity: 0.16666666666666666)

Sentiment Summary: {'total': 10, 'positive': 5, 'negative': 4, 'neutral': 1}
Total articles: 10, Positive: 5, Negative: 4, Neutral: 1
Conclusion
Although the Bill Williams Strategy is known for being more profitable than what we can see in this test, we have managed to get better results with some modifications and by adding deep learning predictions with another period. By adding predictions to the strategy, we managed to make the strategy more stable and reduce errors when trying to know if it's bullish or bearish. With the added ADX, we helped the EA in making decisions for long-run trends, and by adding ATR we managed to make better decisions with the lot risks.
This is not a complete EA, so if you want or need to trade with it, you must finish it or ask someone, for example in the Freelance, to finish it.
Next, I will study the strategies and try to take them to the next level, if possible, by using other indicators or even deep learning. If you find this interesting, please let me know and give feedback about this article or others you want to hear about.
I will probably make another article with Bill Williams indicators using the strategies from his second book: New Trading Dimensions: How to Profit from Chaos in Stocks, Bonds, and Commodities" (1998). Please let me know if you find this interesting or you want some other things to be implemented as an EA.
Also, if you want an article from a specific strategy, please let me know by writing to me or leaving a comment in the article discussions. Sooner or later, I will create such an article (if the publishers also find it interesting).
I hope you liked this article.
 Integrate Your Own LLM into EA (Part 3): Training Your Own LLM with CPU
 Trailing stop in trading
 Neural networks made easy (Part 71): Goal-Conditioned Predictive Coding (GCPC)
 Modified Grid-Hedge EA in MQL5 (Part IV): Optimizing Simple Grid Strategy (I)
- Free trading apps
- Over 8,000 signals for copying
- Economic news for exploring financial markets
You agree to website policy and terms of use
Thanks for taking a swing at improving this trading methodology.
Something similar is the 3 8 trap system which trades dips of the 3 EMA into the 8 EMA during up trends of the 20 EMA, and trades pull backs of the 3 EMA into the 8 EMA during down trends of the 20 EMA
I get a very similar equity curve as the first test report you showed in your article.
A lot of my current work involves using hedges as the risk mitigation method instead of stop losses, then being able to time the sell off of the hedge so that all hedge trades and original strategy trades can be sold off as profitable positions. Regression to the mean is the main method of trying to do that.
Very interesting. Thanks for publishing.
I'll take a closer look at trying to add some additional technical trade filters.
For Reference: 3/8 Trap:
thank you very much for this informative discussion/training. i am new to this and would love to know much much more.
regards
gerrit
thank you very much for this informative discussion/training. i am new to this and would love to know much much more.
regards
gerrit
Thanks! you're welcome! in MQL5 Articles you have lots to start with.
Thanks for taking a swing at improving this trading methodology.
Something similar is the 3 8 trap system which trades dips of the 3 EMA into the 8 EMA during up trends of the 20 EMA, and trades pull backs of the 3 EMA into the 8 EMA during down trends of the 20 EMA
I get a very similar equity curve as the first test report you showed in your article.
A lot of my current work involves using hedges as the risk mitigation method instead of stop losses, then being able to time the sell off of the hedge so that all hedge trades and original strategy trades can be sold off as profitable positions. Regression to the mean is the main method of trying to do that.
Very interesting. Thanks for publishing.
I'll take a closer look at trying to add some additional technical trade filters.
For Reference: 3/8 Trap:
Thank's you are welcome!
There are more than 9 Million combinations! If you take into account the timeframes .... more than 90 Million... My preferred combo is adding DL.
Great work you do! Best of all wishes!