
Visualize a Strategy in the MetaTrader 5 Tester

We all know the saying "Better to see once than hear a hundred times". You can read various books about Paris or Venice, but based on the mental images you wouldn't have the same feelings as on the evening walk in these fabulous cities. The advantage of visualization can easily be projected on any aspect of our lives, including work in the market, for example, the analysis of price on charts using indicators, and of course, the visualization of strategy testing.
Does everyone know the possibilities of the strategy tester?
As practice shows, not everyone. The advantage of the MetaTrader 5 trading platform over its competitors is not only a more convenient user-friendly interface, ample opportunities of the terminal and MQL5, a multicurrency tester with the possibility of cloud computing using the MQL5 Cloud Network and many other options. The advantage is also that all the tools that a trader needs are available in one place.
The purpose of this article is to show traders one more important feature of all the possibilities of MetaTrader 5 - namely visualization of strategy testing and optimization. Analysis of the behavior of an Expert Advisor on historical data and selection of the best parameters is not only a laborious analysis of figures, trades, balance, equity, etc. Sit down in a chair, make yourself comfortable, put on your "3D" glasses and let's start.
And I think to myself what a wonderful world chart...
When publishing Expert Advisors in the Code Base or the Market, authors usually attach a statistical report on their testing, as well as the balance and equity graphs. However, more interesting charts are available in the statistics on the "Results" tab of the strategy tester:

Based on these charts you can analyze the months, days or hours, when your EA trades best, when it actively enters the market. You can also evaluate the performance of the EA in terms of whether profitable positions are closed in proper time, whether the EA "sits out" losses based on the MFE (Maximum Favorable Excursion) and MAE (Maximum Adverse Excursion) distribution graphs:

Further scrolling down the testing results, you will find another graph:

The diagram shows the dependence of the position profit on its lifetime. This diagram will be very helpful for the upcoming Automated Trading Championship 2012. One of the ATC rules prohibits scalping. Test your Expert Advisor and make sure it complies with the rules.
A Historical Movie or Visual Testing
One of the revolutionary features of the strategy tester is its visual testing mode. Well, the analysis of deals by dates, plotting of charts and other "interesting" routine procedures constitute quite a complicated process. However, the strategy tester is like giving you a player remote control, you press "Play" and watch a historical movie. You can slow down or speed up the film, stop it and analyze the situation. In real time you see how charts are constructed based on the simulated historical data and how the Expert Advisor responses to the price changes.
The visualizer fully supports multicurrency, like the strategy tester. The Expert Advisor in the video uses 4 currency pairs for trading. All simulated prices are available in the Market Watch and on the charts.
2D Optimization Results
Before we introduce a three-dimensional image that has become quite popular among television manufacturers, have a look at the 2D visualization in the strategy tester. The rectangles that may seem strange at first glance, allow you to see the mutual influence of two optimization parameters on the optimization criterion (in our case it is the maximum balance value). The darker the shade of green, the higher the balance:

We see that the relationship is of a wave-like character, and the maximum result is achieved when using the mean values of the period and shift of the moving average. These are the results of optimization of the Moving Average EA, which is available in the standard distribution pack of the terminal. Even here you can find something interesting.
Now in 3D
A three-dimensional image provides even better visualization options. Below is the same dependence of the two parameters and the final result. You can switch to this advanced mode using the context menu of the Optimization Graph tab.

After the three-dimensional optimization appeared in the MetaTrader 5 Strategy Tester, traders started to post their own examples of visualization of mathematical calculations on the forum:
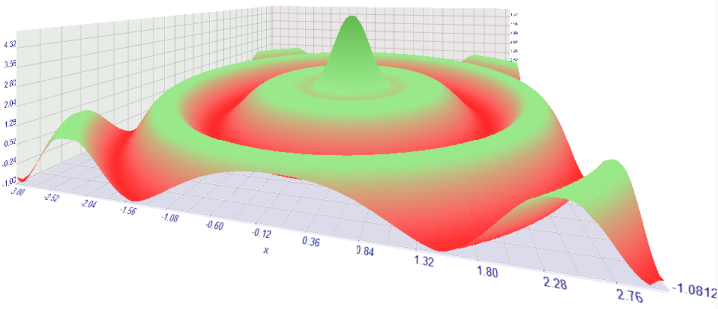
Three-dimensional graphics are fully interactive - you can zoom in and out, rotate to a convenient angle, etc. An important feature is that any results of testing and optimization can be exported as images or XML/HTML reports.
Visualizing Optimization
And finally welcome - work with optimization results! To process results, the trader had to prepare data, download them and process somewhere. Now you can do it on the spot during optimization! To demonstrate this possibility, we need several header files that implement the simplest examples of such processing.
Download the MQH files attached below and save them in folder MQL5\Include. Take any Expert Advisor and paste this block at the end of its code:
//--- Add a code for working with optimization results
#include <FrameGenerator.mqh>
//--- генератором фреймов
CFrameGenerator fg;
//+------------------------------------------------------------------+
//| Tester function                                                  |
//+------------------------------------------------------------------+
double OnTester()
  {
//--- Insert here your own function for calculating the optimization criterion
   double TesterCritetia=MathAbs(TesterStatistics(STAT_SHARPE_RATIO)*TesterStatistics(STAT_PROFIT));
   TesterCritetia=TesterStatistics(STAT_PROFIT)>0?TesterCritetia:(-TesterCritetia);
//--- Call at each end of testing and pass the optimization criterion as a parameter
   fg.OnTester(TesterCritetia);
//---
   return(TesterCritetia);
  }
//+------------------------------------------------------------------+
//| TesterInit function                                              |
//+------------------------------------------------------------------+
void OnTesterInit()
  {
//--- Prepare the chart to show the balance graphs
   fg.OnTesterInit(3); //The parameter sets the number of balance lines on the chart
  }
//+------------------------------------------------------------------+
//| TesterPass function                                              |
//+------------------------------------------------------------------+
void OnTesterPass()
  {
//--- Process the testing results and show the graphics
   fg.OnTesterPass();
  }
//+------------------------------------------------------------------+
//| TesterDeinit function                                            |
//+------------------------------------------------------------------+
void OnTesterDeinit()
  {
//--- End of optimization
   fg.OnTesterDeinit();
  }
//+------------------------------------------------------------------+
//|  Handling of events on the chart                           |
//+------------------------------------------------------------------+
void OnChartEvent(const int id,const long &lparam,const double &dparam,const string &sparam)
  {
   //--- Starts frames after the end of optimization when clicking on the header
   fg.OnChartEvent(id,lparam,dparam,sparam,100); // 100 is a pause between frames in ms
  }
//+------------------------------------------------------------------+
We use the Expert Advisor Moving Averages.mq5 available in the standard delivery pack. Paste the code and save the Expert Advisor as Moving Averages With Frames.mq5. Compile and run the optimization.
Thus, traders now can run visual optimization and process its results or display the required information during the optimization process.
Do You Want More?
We keep expanding the possibilities of the MetaTrader 5 trading platform by adding new tools to help traders. Post your comments and share your ideas on how to further improve visualization in the strategy tester. We will try to implement the most interesting and useful of them.
How to Use the Files
All files with the .mqh extension should be put in the MQL5\Include folder, that's where the compiler will look for them when compiling the Moving Average_With_Frames.mq5 Expert Advisor. The EA files can be put right in the MQL5\Experts folder or in any of its sub-folders.
Translated from Russian by MetaQuotes Ltd.
Original article: https://www.mql5.com/ru/articles/403
 The Golden Rule of Traders
 Get 200 usd for your algorithmic trading article!
 Limitless Opportunities with MetaTrader 5 and MQL5
 Kernel Density Estimation of the Unknown Probability Density Function
- Free trading apps
- Over 8,000 signals for copying
- Economic news for exploring financial markets
You agree to website policy and terms of use