
Reversing: Formalizing the entry point and developing a manual trading algorithm
Introduction
For already two articles (Reversing: The holy grail or a dangerous delusion? and Reversing: Reducing maximum drawdown and testing other markets), we have been studying the Reversing trading strategy. We considered the use of the trading strategy in different markets, found the most suitable markets and formalized the basic rules for proper reversing. The subject seems to be fully discussed. What else can be written about the reversing technique? However, there is a problem which we mentioned earlier, but the solution to which we never approached.
The problem is connected with the entry point, which is not formalized in our strategy. It means a deal entry can be performed at any moment. The result of this can be unpredictable. Someone may have a deal closed by Take Profit. Another trader may enter 5 minutes later and get the entire chain of deals closed by Stop Loss.
That is why, all tests performed in previous articles can be considered reliable only for the cases, when you decide to enter exactly on the same historical day, hour and minute, as was done in the Strategy Tester. The same profit growth cannot be guaranteed, if you enter a trade a minute earlier or later.
So, we need some rules to determine "when to enter a deal" and "the entry direction". Such rules should not worsen our profit charts much. Let us try to find such rules.
Tested symbols
Testing will be performed on the symbols, which showed the best performance in the previous article. Also, the symbols need to have a sufficient amount of history, to avoid randomness of obtained results.
As in the previous article, we will test the strategy with several brokers. Symbols from different markets will be used for testing, except for Forex pairs. This is because we could not achieve better or comparatively similar results using standard indicators. So, we found out in the first article that none of the tested indicators could produce results similar to a random-time entry in the Forex market.
In this article, we will test the following securities:
Broker 1, Stock Market: TripAdvisor, Sberbank, Nintendo_US, Tencent, Michael_Kors, Starbucks, Gazprom, Petrobras, Snap, SQM.
Broker 2, Stock Market: ORCL.m, INTC.m, FOXA.m, SBUX.m, NKE.m, HPE.m, MSFT.m, KO.m, ATVI.m.
Broker 1, indices: YM.
Broker 2, commodity: BRENT.
What's new in RevertEA
The following changes have been implemented in RevertEA compared to the previous article:
- the new Close button allows closing any open position;
- added possibility to display current position profit on the chart (next to the Close button);
- added possibility to set stop loss as a percentage of the current price;
- added parameters Use constant trailing after N profit points and Constant trading in points;
- added possibility to use the ORDER_FILLING_IOC filling mode.
What's new in RevertManualEA
The following changes have been made in RevertManualEA:
- the new Close all button allows closing all open positions managed by the EA;
- the total profit of all positions managed by the EA is displayed near the Close all button;
- the buttons of all positions managed by the EA are displayed in the chart;
- added possibility to use the ORDER_FILLING_IOC filling mode.
Buttons for positions managed by the EA. A click on a symbol button opens the chart of the corresponding symbol. Also, these buttons display related information, such as the symbol name, the current step, as well as the current position profit. If the button color has changed, it means the position has been fully closed (either by a take profit or upon reaching the maximum number of the chain steps).
Also pay attention to the new parameter Show the sum of last losses by a symbol button click. It is set to true by default. This means that the amount of last losses will be displayed in a comment to the chart, which opens at a click on the appropriate symbol button. This enables the fast access to data about the minimum profit required to cover all losses in the chain.
Formalizing the entry point
In order to eliminate the dependence of trading system results on the entry time, we need to find some rules, which would allow to enter under certain conditions, instead of entering whenever there are no open positions for that symbol.
In my opinion, the Moving Average is the most suitable tool for determining such an entry point.
First, it allows the determining of a global trend and therefore the entry direction: if the moving average grows, enter a Long position, otherwise go Short.
Second, an additional rule allows limiting the entry. For example, after the previous bar crossed the Moving Average upwards or downwards.
These rules will be used as entry conditions. Possibilities for the use of such rules were implemented in the RevertEA Expert Advisor long ago. The only thing we need to do to enable the use of the Moving Average is to change the following parameters:
- Open short positions — set to true, otherwise the EA will only open Long positions, while ignoring Short signals;
- Period — set the desired period in this parameter under the Indicator MA #1 block;
- Configure all other settings under the Indicator MA #1 block as you need.
An archive attached below contains all SET files with proper settings for specific symbols.
in this article, we will use a simple Moving Average. If you prefer any other MA type, you may select the desired one in the appropriate parameter under the Indicator MA #1 block in the EA settings.
Stock market. In the previous article, we found out that the Stock market is the most suitable one for the reversing strategy. Let us start with this market.
First, we will compare results with various symbols for Broker 1. This broker offers individual swaps for each symbol (you may check the swap from a table published in the previous article), but in any case, the swaps for Long positions are at least twice as large as those offered by Broker 2. However, the broker also has advantages: swap is positive for Short positions, i.e. swap is paid to you for holding short positions.
Testing results for all markets will be presented in appropriate tables. Each table row first presents information on testing results without the use of any indicators. I.e. a position is opened immediately after the previous chain is closed by Take Profit or Stop Loss. Then, a new line in the same table row presents testing results for the same symbol with the same SL and TP values, but with the use of the Simple Moving Average indicator.
Since RevertEA also supports trading without reversing, we will also check the profitability of classical trading, using the Moving Average. The best results of these tests will be presented in the third line of each table row.
Trading strategy testing results with reversing, without indicators, differ from results published in the previous article. This is because more than a month has passed since its publication. So, we can check what has changed since that time.
Before proceeding to testing results, let us recall the purpose of some table columns:
- Annual % — the value is calculated according to the following formula: ((profit/max. drawdown)*100)/number of years for which the historic symbol data are available, it is an approximate number and is also provided for the purpose of comparative analysis;
- Max. losses — the maximum number of consecutive losses, i.e. how deep into the chain we had to go before reaching Take Profit;
- Trades (year/total) — the average number of positions which will be opened for that symbol per year (the total number of trades is divided by the number of years, for which historical data is available).
Broker 1, Stock Market:
| Symbol | Trades (year/total) | Profit factor | Max. drawdown | Profit Column | Annual % | Max. losses | SL | TP |
|---|---|---|---|---|---|---|---|---|
| TripAdvisor, revert TripAdvisor, revert + MA TripAdvisor, no revert | 98 / 246 46 / 116 65 / 164 | 1.36 1.6 1.69 | 98 53 6 | 231 156 49 | 94 % 117 % 326% | 6 4 9 | 155 155 60 | 195 195 155 |
| Sberbank, revert Sberbank, revert + MA Sberbank, no revert | 150 / 225 118 / 178 231 / 347 | 1.34 1.31 0.79 | 45 17 43 | 86 49 -37 | 127 % 192 % - | 5 5 9 | 420 420 155 | 510 510 360 |
| Nintendo_US, revert Nintendo_US, revert + MA Nintendo_US, no revert | 169 / 339 32 / 64 25 / 51 | 1.49 1.72 1.12 | 18 16 7 | 104 59 4 | 288 % 184 % 28 % | 6 4 5 | 55 55 35 | 80 80 55 |
| Tencent, revert Tencent, revert + MA Tencent, no revert | 74 / 223 26 / 80 18 / 54 | 2.54 2.48 1.47 | 43 69 6 | 527 381 20 | 408 % 184 % 111 % | 5 5 3 | 450 450 530 | 1500 1500 880 |
| Michael_Kors, revert Michael_Kors, revert + MA Michael_Kors, no revert | 36 / 109 23 / 70 15 / 46 | 1.51 1.57 1 | 134 71 15 | 240 140 0 | 59 % 65 % - | 5 4 4 | 190 190 200 | 330 330 400 |
| Starbucks, revert Starbucks, revert + MA Starbucks, no revert | 15 / 231 11 / 171 20 / 300 | 1.69 1.64 1.07 | 38 36 13 | 251 174 11 | 45 % 33 % 5 % | 4 4 6 | 160 160 95 | 195 195 105 |
| Gazprom, revert Gazprom, revert + MA Gazprom, no revert | 265 / 398 101 / 152 36 / 54 | 1.33 1.42 1.03 | 59 18 20 | 142 55 2 | 160 % 203 % 6 % | 6 4 5 | 150 150 240 | 180 180 480 |
| Petrobras, revert Petrobras, revert + MA Petrobras, no revert | 23 / 337 15 / 219 11 / 162 | 1.61 1.64 1.16 | 86 160 28 | 623 388 39 | 49 % 16 % 9 % | 5 5 7 | 240 240 240 | 300 300 410 |
| Snap, revert Snap, revert + MA Snap, no revert | 62 / 93 24 / 36 24 / 37 | 1.97 3.47 1.49 | 44 12 7 | 227 95 12 | 343 % 527 % 114 % | 4 2 6 | 75 75 45 | 135 135 120 |
| SQM, revert SQM, revert + MA SQM, no revert | 64 / 162 29 / 74 22 / 57 | 1.81 1.89 1.02 | 55 68 12 | 288 142 1 | 209 % 83 % 3 % | 5 5 5 | 125 125 150 | 240 240 185 |
Let's not draw conclusions now. First, view the corresponding charts. Conclusions will be made at the end of this section for all markets.
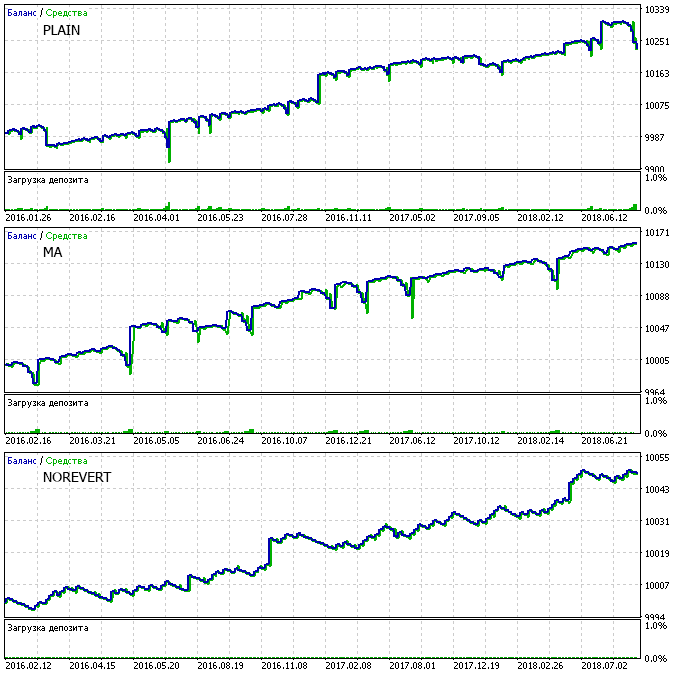
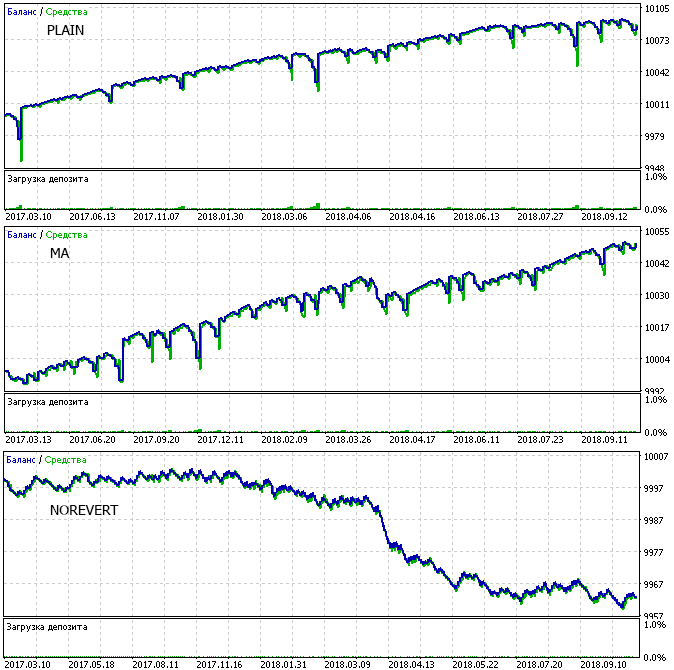
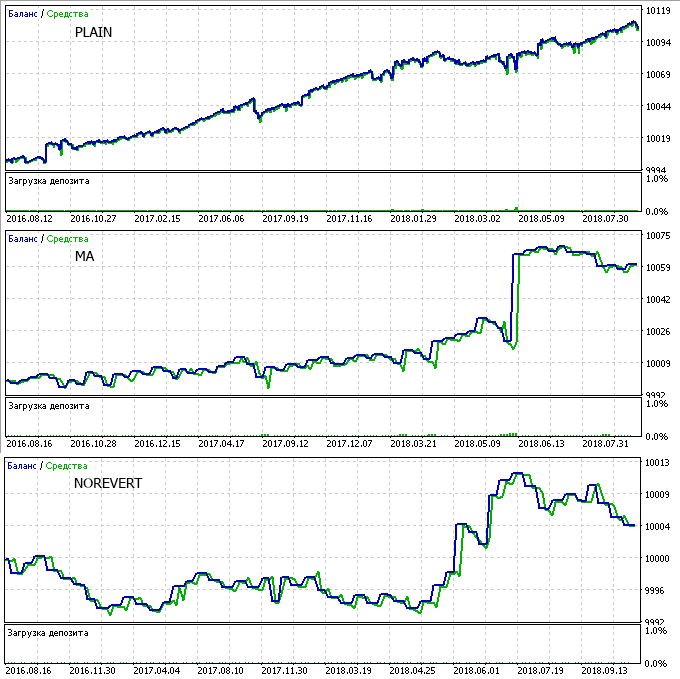
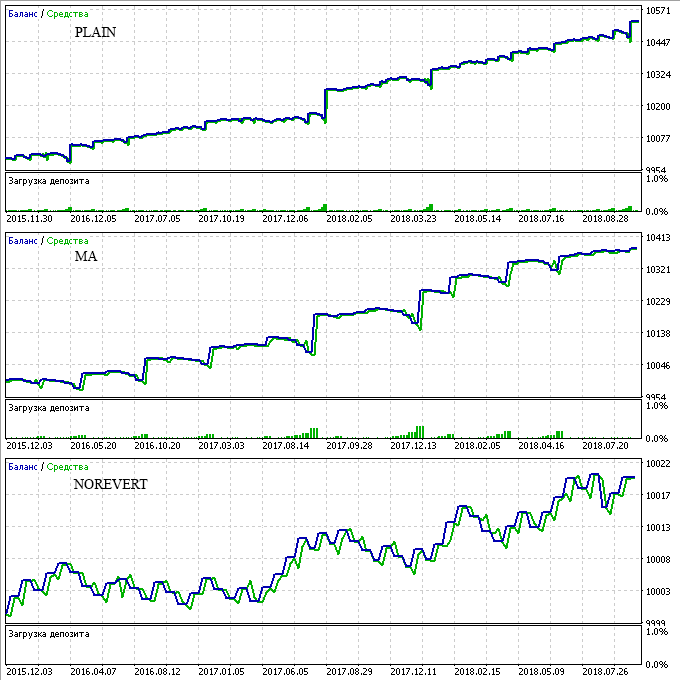
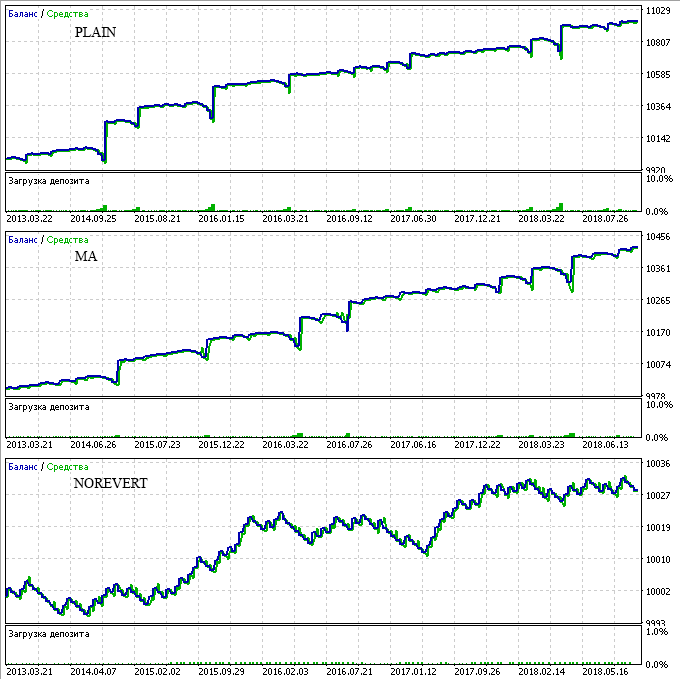
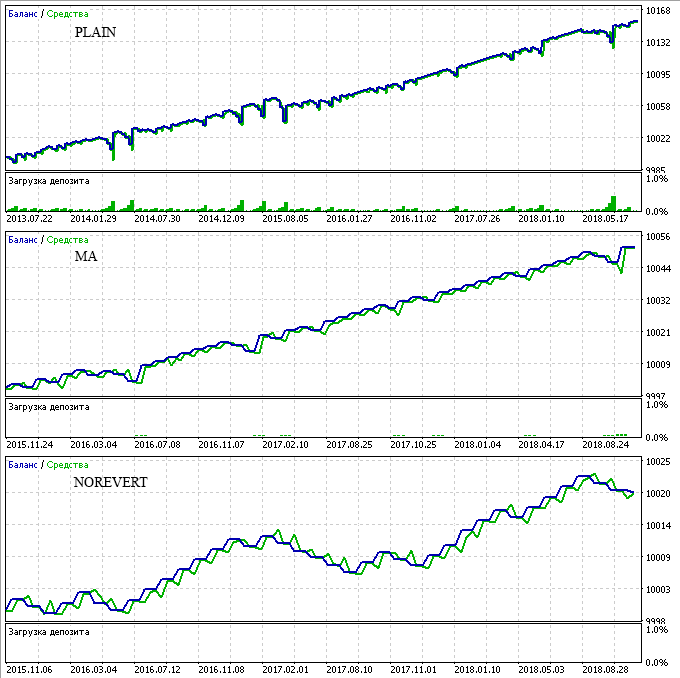
As for the charts, the following abbreviations are used on them:
- PLAIN — the chart of a trading strategy without any indicator (a Long entry is performed immediately, once there are no positions for the symbol);
- MA — entry based on Moving Average signals;
- NOREVERT — entry based on Moving Average signals without using the reversing technique.
TripAdvisor:
Sberbank:
Nintendo_US:
Tencent:
Michael_Kors:
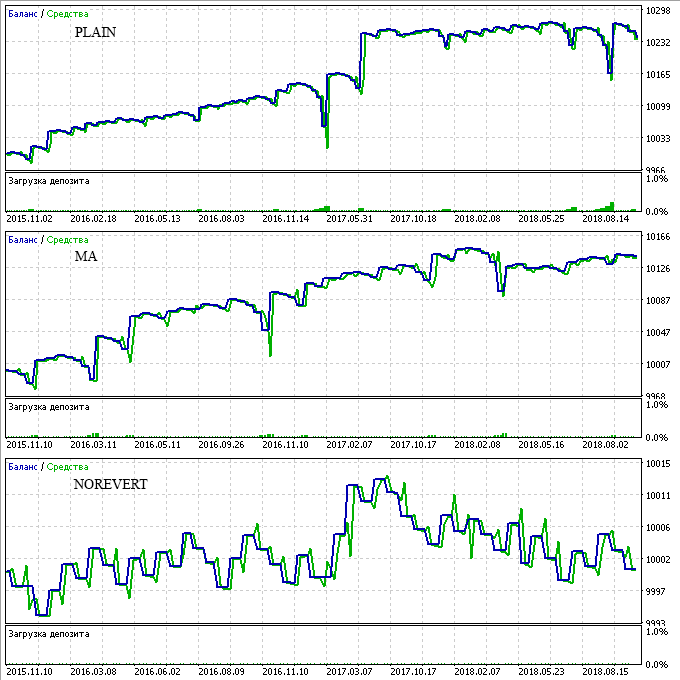
Starbucks:
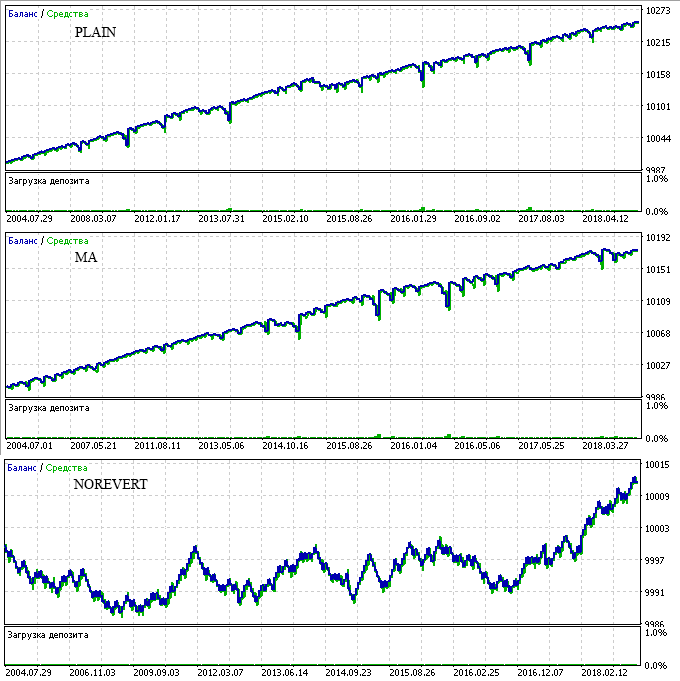
Gazprom:
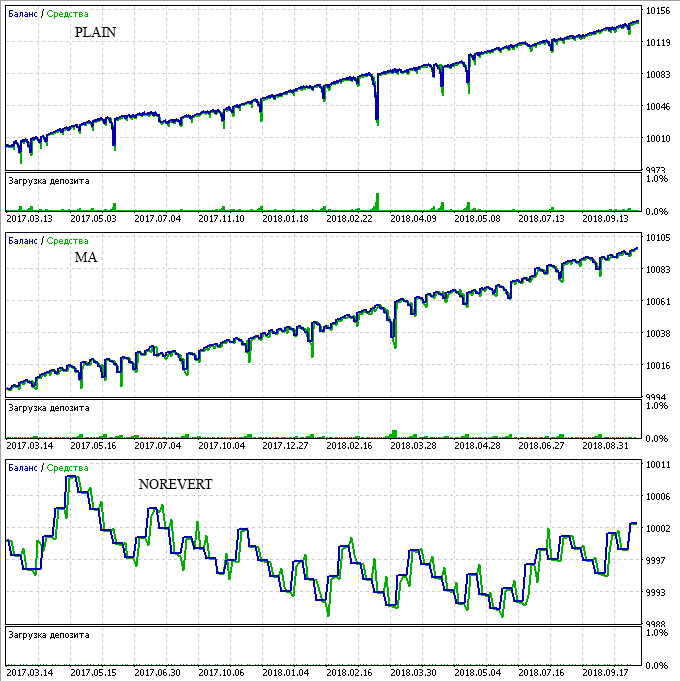
Petrobras:
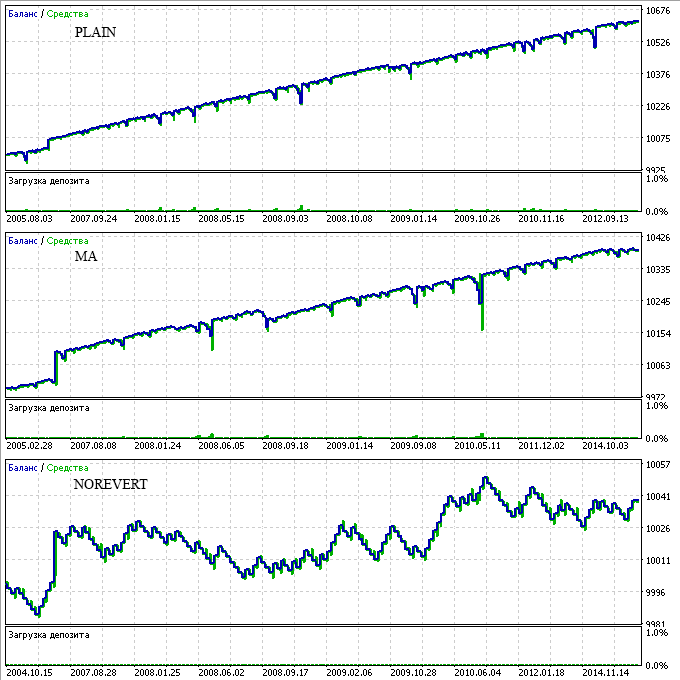
Snap:
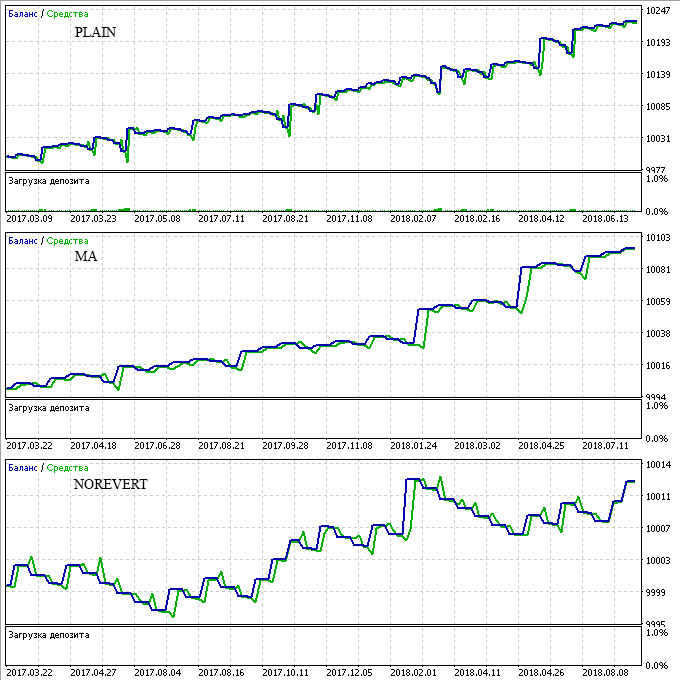
SQM:
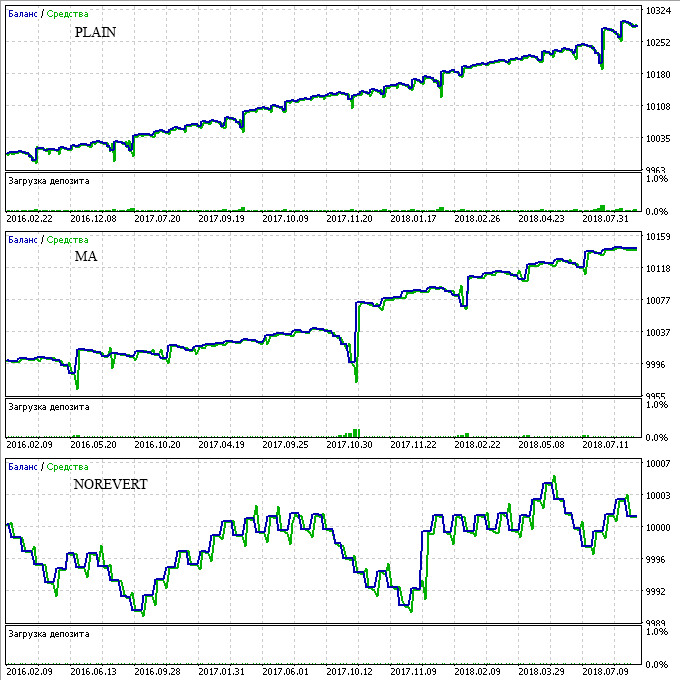
Now let us view results for Broker 2. This broker provides negative swap regardless of the position direction. Another difference from Broker 1: Broker 2 does not pay dividends for your Long positions. However, the advantage is that this broker does not charge dividends for Short positions.
Broker 2, Stock Market:
| Symbol | Trades (year/total) | Profit factor | Max. drawdown | Profit Column | Annual % | Max. losses | SL | TP |
|---|---|---|---|---|---|---|---|---|
| ORCL.m, revert ORCL.m, revert + MA ORCL.m, no revert | 44 / 246 26 / 147 13 / 76 | 1.07 1.64 1.51 | 275 65 9 | 46 281 24 | 3 % 78 % 48 % | 8 6 7 | 90 90 100 | 150 150 235 |
| INTC.m, revert INTC.m, revert + MA INTC.m, no revert | 33 / 182 19 / 109 29 / 162 | 1.92 1.94 1.31 | 23 24 6 | 219 116 22 | 173 % 87 % 66 % | 4 4 7 | 130 130 70 | 180 180 145 |
| FOXA.m, revert FOXA.m, revert + MA FOXA.m, no revert | 53 / 268 41 / 207 28 / 144 | 1.6 1.66 1.07 | 47 28 8 | 201 150 6 | 85 % 107 % 15 % | 5 4 5 | 90 90 115 | 120 120 135 |
| SBUX.m, revert SBUX.m, revert + MA SBUX.m, no revert | 49 / 270 28 / 154 31 / 173 | 1.5 1.86 1.11 | 58 22 11 | 217 143 9 | 68 % 118 % 13 % | 5 4 8 | 130 130 70 | 160 160 150 |
| NKE.m, revert NKE.m, revert + MA NKE.m, no revert | 35 / 197 22 / 123 26 / 146 | 2.26 2.32 1.29 | 140 75 11 | 947 422 28 | 122 % 102 % 46 % | 6 5 8 | 135 135 105 | 275 275 205 |
| HPE.m, revert HPE.m, revert + MA HPE.m, no revert | 33 / 99 16 / 48 12 / 38 | 1.89 3.55 2.05 | 27 8 7 | 104 51 19 | 128 % 212 % 90 % | 4 2 5 | 55 55 55 | 70 70 85 |
| MSFT.m, revert MSFT.m, revert + MA MSFT.m, no revert | 36 / 199 28 / 158 37 / 206 | 2.11 2.06 1.23 | 70 73 12 | 508 478 31 | 131 % 119 % 46 % | 7 5 9 | 150 150 100 | 275 275 205 |
| KO.m, revert KO.m, revert + MA KO.m, no revert | 20 / 110 16 / 93 14 / 82 | 2.02 1.77 1.75 | 29 51 7 | 144 147 31 | 90 % 52 % 80 % | 4 5 3 | 100 100 120 | 160 160 150 |
| ATVI.m, revert ATVI.m, revert + MA ATVI.m, no revert | 77 / 425 24 / 135 19 / 109 | 1.34 1.99 1.52 | 54 15 7 | 235 109 33 | 79 % 132 % 85 % | 5 3 4 | 135 135 115 | 140 140 155 |
Of all the analyzed symbols, only ORCL.m shows disappointing results during the past month. It managed to reach the maximum 8th chain step. In that case, the entire chain was closed with a loss. That was a strategy without indicators. Due to this, annual percentage of profit was very small. The loss could be avoided if we traded using the indicator.
ORCL.m:

INTC.m:

FOXA.m:
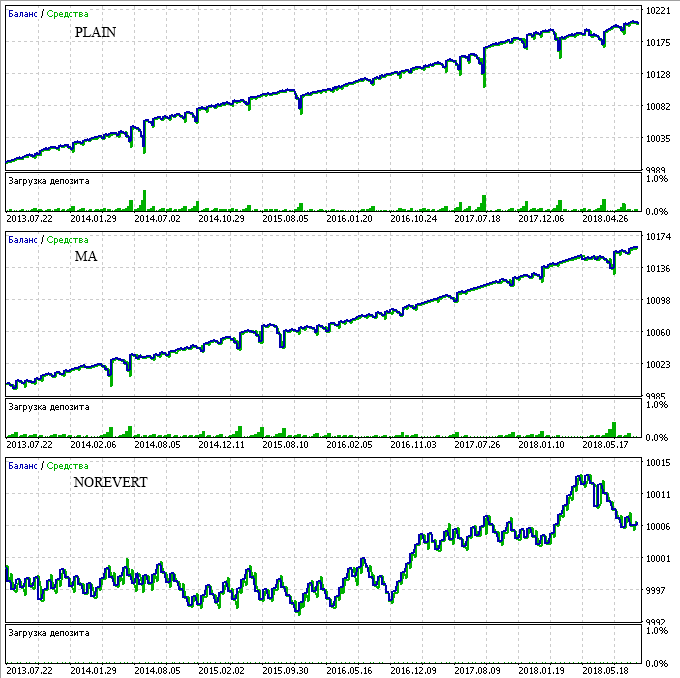
SBUX.m:
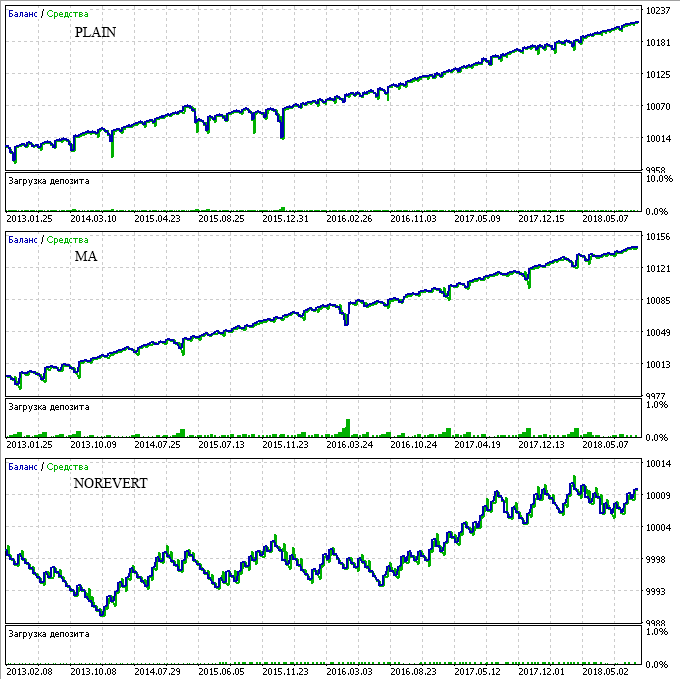
NKE.m:
HPE.m:
MSFT.m:

KO.m:

ATVI.m:
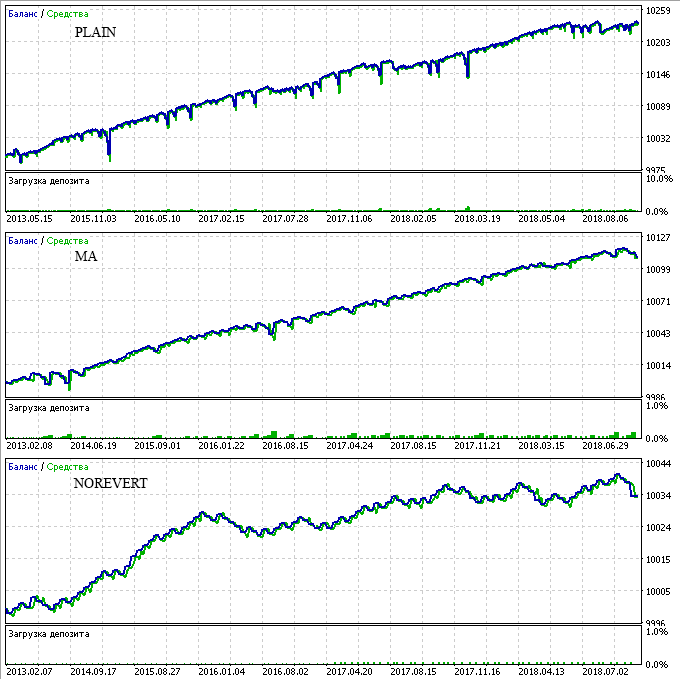
Indices. We will consider only one index — Dow Jones (YM) with Broker 1. Its profit chart could be called perfect... To be more precise, the profit chart from the previous article was perfect. But in new tests, the profitable chain was unexpectedly interrupted in 2009. But the addition of a Moving Average helped to avoid the loss of the entire chain, as shown in the below chart.
Broker 1, indices
| Symbol | Trades (year/total) | Profit factor | Max. drawdown | Profit Column | Annual % | Max. losses | SL | TP |
|---|---|---|---|---|---|---|---|---|
| YM, revert YM, revert + MA YM, no revert | 106 / 1 287 76 / 958 54 / 678 | 1.46 1.51 0.9 | 2 797 1 343 820 | 20 089 13 216 -636 | 57 % 78 % - | 8 6 11 | 155 155 170 | 210 210 200 |
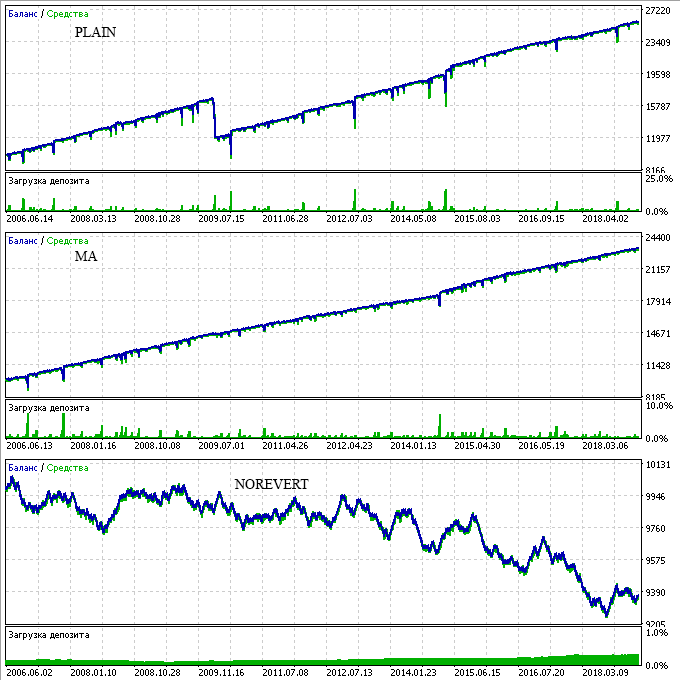
Commodities. Here we also consider only one security — Brent oil with Broker 2. Only this symbol showed good profit and balance chart in the previous article. Although the use of the Moving Average helped in reducing the maximum number of consecutive losses, the total results became much worse.
Broker 2, commodity:
| Symbol | Trades (year/total) | Profit factor | Max. drawdown | Profit Column | Annual % | Max. losses | SL | TP |
|---|---|---|---|---|---|---|---|---|
| Brent, revert Brent, revert + MA Brent, no revert | 146 / 733 137 / 685 136 / 682 | 1.5 1.26 1.1 | 8 721 8 962 154 | 31 144 18 624 338 | 71 % 41 % 43 % | 21 19 17 | 70 70 60 | 275 275 215 |
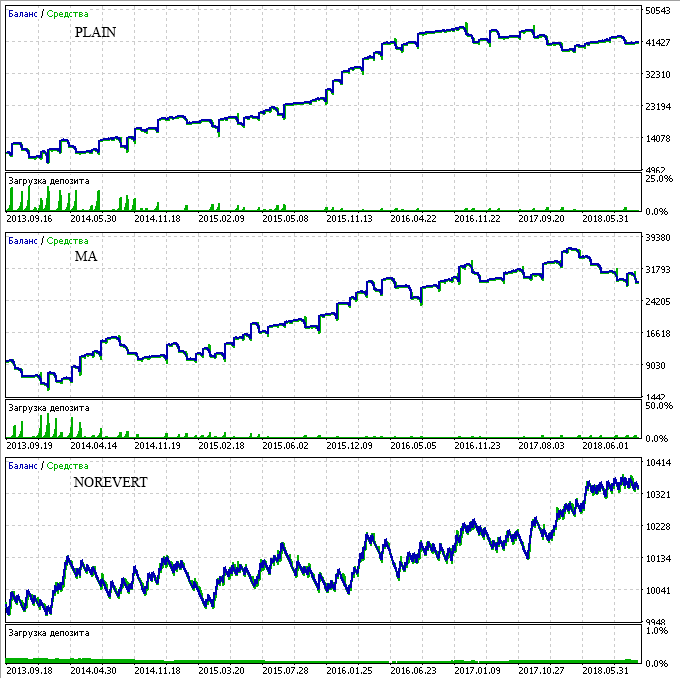
Let's sum up.
So, what do we have? We have succeeded in formalizing the entry point. So now, the testing start date does not affect testing results so much.
In addition, this increased the profitability for most of the securities, as well as reduced the maximum number of consecutive losses by 1-2 steps.
However, the net profit of all symbols decreased due to a lower number of executed trades (the total number reduced by 1.5-2 times). Here it is up to you to decide: you may choose either larger profit or lower risks.
Testing Stop Loss percentage of the price and ATR
In comments to previous articles, users mentioned that it was not right to use fixed Stop Loss and Take Profit values, and it would be better to use percentage of ATR. There is some logic in this statement. Indeed, we used the same Stop Loss and Take Profit level for 15 years of testing. But a financial symbol may have different volatility in different time periods. Moreover, symbol price can change greatly within 15 years, so that a 15 year old Stop Loss may no longer be suitable.
Therefore, RevertEA has been modified to enable Stop Loss specification in points, as percentage of the current price or of ATR. The desired type can be selected using the Stop Loss type parameter in the Expert Advisor settings.
ATR in this case is determined according to Gerchik's method. That is, ATR will be calculated on a daily chart, without taking into account too small and too large bars. If the number of bars is not enough for the calculation, the standard method will be used.
If this ATR determining function does not suit you, you can easily re-write the getATR function for your own needs. This function is available in the strategy_base.mqh file of the Strategies folder. Its original source code is presented below:
double getATR(string name){
   MqlRates rates[];
   ArraySetAsSeries(rates, true);
   double atr=0;
   double pre_atr=0;
   int count=0;

   // Get bar data for the last 7 days
   //(this is more than needed, because we will calculate ATR for 5 days)
   int copied=CopyRates(name, PERIOD_D1, 0, 7, rates);

   // Determine ATR for the last 7 days, excluding
   // too large and too small bars
   if(copied>=5){
      for(int j=1; j<copied; j++){
         pre_atr+=rates[j].high-rates[j].low;
      }
      pre_atr/=(copied-1);
   }

   // Determine ATR for the last 5 days or less, including
   // too large and too small bars
   // i.e. the bars having the size over 1.5 7-day ATR
   // and bars less than 0.3 of 7-day ATR
   // are discarded
   if(pre_atr>0){
      for(int j=1; j<copied; j++){
         if( rates[j].high-rates[j].low > pre_atr*1.5 ) continue;
         if( rates[j].high-rates[j].low < pre_atr*0.3 ) continue;

         if( ++count > 5 ){
            count=5;
            break;
         }

         atr+=rates[j].high-rates[j].low;
      }
      // if there are not enough medium bars
      // calculate a normal ATR 5
      if(count<2){
         count=0;
         for(int j=1; j<=5; j++){
            ++count;
            atr+=rates[j].high-rates[j].low;
         }
      }
      atr= NormalizeDouble(atr/count, _Digits);
   }

   return atr;
}
As for the Take Profit level, it can now be specified not only in points, but also as a multiple of Stop Loss (the Take type parameter in EA settings. For example, you can set Take Profit at a distance of three Stop Losses from the open price.
Comparative results of testing with different Stop Loss levels is provided below. Testing was performed without the use of a Moving Average, because this way we get more entry points and have more accurate results for comparative analysis.
Each table row consists of three lines:
- Stop Loss and Take Profit in points;
- Stop Loss as percentage of the price, Take Profit as SL multiplier;
- Stop Loss as percentage of ATR, Take Profit as SL multiplier.
| Symbol | Trades (year/total) | Profit factor | Max. drawdown | Profit Column | Annual % | Max. losses | SL | TP |
|---|---|---|---|---|---|---|---|---|
| TripAdvisor TripAdvisor, percent TripAdvisor, atr | 98 / 246 532 / 1 331 56 / 141 | 1.36 1.41 1.42 | 98 310 386 | 231 1 161 366 | 94 % 149 % 37 % | 6 11 8 | 155 1 96 | 195 1.7 2.7 |
| Sberbank Sberbank, percent Sberbank, atr | 150 / 225 178 / 267 196 / 295 | 1.34 1.63 1.78 | 45 223 67 | 86 713 257 | 127 % 213 % 255 % | 5 11 6 | 420 1.2 73 | 510 2.6 1.7 |
| Nintendo_US Nintendo_US, percent Nintendo_US, atr | 169 / 339 182 / 365 144 / 288 | 1.49 1.39 1.65 | 18 31 35 | 104 100 182 | 288 % 161 % 260 % | 6 5 9 | 55 1.2 82 | 80 1.4 4.1 |
| Tencent Tencent, percent Tencent, atr | 74 / 223 25 / 76 213 / 640 | 2.54 2.18 1.38 | 43 24 42 | 527 168 177 | 408 % 233 % 140 % | 5 4 6 | 450 3.6 76 | 1500 2 1.4 |
| Michael_Kors Michael_Kors, percent Michael_Kors, atr | 36 / 109 46 / 140 84 / 252 | 1.51 2.6 2.18 | 134 281 266 | 240 1 452 1 352 | 59 % 172 % 169 % | 5 7 7 | 190 3 77 | 330 2 2.3 |
| Starbucks Starbucks, percent Starbucks, atr | 15 / 231 26 / 388 56 / 816 | 1.69 1.26 1.2 | 38 743 426 | 251 531 740 | 45 % 4 % 11 % | 4 30 17 | 160 2.8 75 | 195 3.5 4.1 |
| Gazprom Gazprom, percent Gazprom, atr | 265 / 398 64 / 97 76 / 114 | 1.33 1.99 3.02 | 59 102 115 | 142 294 404 | 160 % 192 % 234 % | 6 11 9 | 150 1.6 69 | 180 2.8 3.7 |
| Petrobras Petrobras, percent Petrobras, atr | 23 / 337 25 / 375 55 / 803 | 1.61 1.45 1.92 | 86 391 650 | 623 456 3 743 | 49 % 8 % 39 % | 5 12 20 | 240 1.6 83 | 300 2.8 4 |
| Snap Snap, percent Snap, atr | 62 / 93 55 / 83 - | 1.97 2.85 - | 44 83 - | 227 411 - | 343 % 330 % - | 4 5 - | 75 4 - | 135 2.7 - |
| SQM SQM, percent SQM, atr | 64 / 162 58 / 145 170 / 426 | 1.81 1.79 1.32 | 55 128 249 | 288 337 314 | 209 % 105 % 50 % | 5 6 9 | 125 3.4 67 | 240 1.7 1.9 |
| ORCL.m ORCL.m, percent ORCL.m, atr | 44 / 246 16 / 88 215 / 1 186 | 1.07 1.64 1.24 | 275 65 261 | 46 146 351 | 3 % 40 % 24 % | 8 5 8 | 90 4 70 | 150 1.4 1.4 |
| INTC.m INTC.m, percent INTC.m, atr | 33 / 182 25 / 142 116 / 641 | 1.92 3.36 1.62 | 23 133 385 | 219 1 323 1 358 | 173 % 180 % 64 % | 4 6 14 | 130 2.4 56 | 180 3.2 4.1 |
| FOXA.m FOXA.m, percent FOXA.m, atr | 53 / 268 93 / 467 234 / 1 171 | 1.6 1.57 1.28 | 47 133 165 | 201 407 305 | 85 % 61 % 36 % | 5 7 8 | 90 2 71 | 120 1.4 1.4 |
| SBUX.m SBUX.m, percent SBUX.m, atr | 49 / 270 62 / 345 154 / 849 | 1.5 1.89 1.5 | 58 100 269 | 217 694 1 379 | 68 % 126 % 93 % | 5 7 15 | 130 1.8 57 | 160 1.7 3.2 |
| NKE.m NKE.m, percent NKE.m, atr | 35 / 197 20 / 112 407 / 2 240 | 2.26 2.18 1.17 | 140 41 174 | 947 257 384 | 122 % 113 % 40 % | 6 3 12 | 135 4 47 | 275 1.4 1.7 |
| HPE.m HPE.m, percent HPE.m, atr | 33 / 99 66 / 198 60 / 180 | 1.89 1.76 2.62 | 27 52 110 | 104 143 674 | 128 % 91 % 204 % | 4 5 14 | 55 2.8 76 | 70 1.4 3.8 |
| MSFT.m MSFT.m, percent MSFT.m, atr | 36 / 199 28 / 154 126 / 693 | 2.11 1.39 1.42 | 70 340 434 | 508 288 1 042 | 131 % 15 % 43 % | 7 6 16 | 150 3.2 69 | 275 1.4 2.9 |
| KO.m KO.m, percent KO.m, atr | 20 / 110 22 / 121 125 / 688 | 2.02 2.12 1.35 | 29 163 244 | 144 397 2 272 | 90 % 44 % 169 % | 4 6 14 | 100 2 64 | 160 2 2.9 |
| ATVI.m ATVI.m, percent ATVI.m, atr | 77 / 425 15 / 83 194 / 1 072 | 1.34 2.86 1.46 | 54 302 235 | 235 1 313 1 198 | 79 % 79 % 92 % | 5 6 9 | 135 4 60 | 140 3.2 2.3 |
| YM YM, percent YM, atr | 106 / 1 287 157 / 1 969 234 / 2 927 | 1.46 1.29 1.02 | 2 797 13 288 19 984 | 20 089 41 936 2 669 | 57 % 25 % 1 % | 8 27 17 | 155 0.6 51 | 210 2.9 1.7 |
| Brent Brent, percent Brent, atr | 146 / 733 114 / 574 81 / 407 | 1.5 1.21 1.34 | 8 721 13 883 9 368 | 31 144 12 988 16 587 | 71 % 18 % 35 % | 21 19 13 | 70 1.4 70 | 275 3.8 3.2 |
None of the Stop Loss calculation methods was the best for all tested symbols. In some cases, Stop Loss in points was better. With other symbols price or ATR percentage Stop Loss showed greater profit. However, there is one regularity. The maximum number of consecutive losing trades significantly increases almost with all deals, if we calculate SL as percentage of price or as percentage of ATR. The maximum drawdown increases accordingly.
In general, it is impossible to say for sure which of the Stop Loss and Take Profit calculation methods is better. But in my opinion, Stop Loss and Take Profit in points shows better results, since this way we have a smaller drawdown.
Testing the Trailing Stop
Many traders prefer to use a floating Trailing Stop, while they believe that it can protect profits and thus increase the Expert Advisor profitability. Let's check this option now.
The EA has two parameters:
- Use constant trailing after N profit points — this parameter sets the number if points which the price should move in the Take Profit direction, after which the Trailing Stop mechanism will be activated (this limitation protects a chain from being closed with a loss on further reversing steps, especially if lot increase is not used at every step);
- Constant trailing in points — number of points from the current price, by which position Stop Loss will be moved once the condition of Use constant trailing after N profit points is met.
The EA determines the need to trail Stop Loss at each bar beginning. I.e. the check is performed every 15 minutes, because we test the strategy on the M15 timeframe.
If trailing is needed, then in addition to moving Stop Loss, the EA cancels Take Profit. Now, Stop Loss remains the only method for closing the position. That is, in addition to the protection from possible price direction change, the Trailing Stop allows you to increase the profit amount by canceling Take Profit.
Below is a comparative table of the best results without Trailing Stop and with Trailing Stop.
| Symbol | Trades (year/total) | Profit factor | Max. drawdown | Profit | Annual % | Max. losses |
|---|---|---|---|---|---|---|
| TripAdvisor TripAdvisor, trailing | 100 / 250 99 / 248 | 1.5 1.53 | 98 100 | 315 321 | 128 % 128 % | 6 6 |
| Sberbank Sberbank, trailing | 157 / 236 158 / 238 | 1.37 1.55 | 45 44 | 98 148 | 145 % 224 % | 5 5 |
| Nintendo_US Nintendo_US, trailing | 171 / 342 173 / 347 | 1.38 1.2 | 18 37 | 90 51 | 250 % 68 % | 6 9 |
| Tencent Tencent, trailing | 78 / 234 69 / 209 | 1.9 2.3 | 150 82 | 415 438 | 92 % 178 % | 8 7 |
| Michael_Kors Michael_Kors, trailing | 38/ 114 48 / 145 | 1.46 1.46 | 134 116 | 247 169 | 61 % 48 % | 5 5 |
| Starbucks Starbucks, trailing | 16 / 234 15 / 227 | 1.66 1.6 | 38 51 | 247 234 | 44 % 31 % | 4 4 |
| Gazprom Gazprom, trailing | 288 / 433 295 / 443 | 1.34 1.4 | 59 39 | 155 162 | 175 % 276 % | 6 5 |
| Petrobras Petrobras, trailing | 24 / 349 23 / 344 | 1.4 1.52 | 126 102 | 547 541 | 29 % 36 % | 8 5 |
| SQM SQM, trailing | 64 / 164 69 / 174 | 1.82 1.8 | 55 83 | 298 400 | 216 % 192 % | 5 5 |
| ORCL.m ORCL.m, trailing | 44 / 246 46 / 254 | 1.07 1.46 | 275 225 | 46 294 | 3 % 23 % | 8 7 |
| INTC.m INTC.m, trailing | 31 / 172 31 / 174 | 1.77 1.7 | 52 52 | 216 218 | 75 % 75 % | 5 6 |
| FOXA.m FOXA.m, trailing | 52 / 260 68 / 342 | 0.91 1.38 | 413 62 | -57 126 | - 40 % | 8 5 |
| SBUX.m SBUX.m, trailing | 49 / 272 49 / 269 | 1.5 1.49 | 58 63 | 218 214 | 68 % 67 % | 5 5 |
| NKE.m NKE.m, trailing | 35 / 198 35 / 199 | 2.26 2.01 | 140 84 | 957 407 | 122 % 88 % | 6 5 |
| HPE.m HPE.m, trailing | 30 / 90 41 / 125 | 1.4 1.4 | 46 21 | 75 43 | 54 % 68 % | 5 3 |
| MSFT.m MSFT.m, trailing | 37 / 207 37 / 208 | 2.04 1.12 | 70 442 | 538 112 | 139 % 4 % | 7 8 |
| KO.m KO.m, trailing | 20 / 105 20 / 109 | 1.56 1.86 | 107 44 | 133 164 | 22 % 67 % | 5 5 |
| ATVI.m ATVI.m, trailing | 79 / 435 80 / 443 | 1.27 1.26 | 56 56 | 201 199 | 65 % 64 % | 5 5 |
| YM YM, trailing | 106 / 1 288 106 / 1 290 | 1.3 1.3 | 7 285 6 989 | 15 090 14 622 | 16 % 16 % | 8 8 |
| Brent Brent, trailing | 151 / 759 149 / 748 | 1.3 1.44 | 8 721 8 790 | 21 950 28 537 | 50 % 64 % | 21 21 |
As you can see from the table, the Trailing Stop function increased profits in some cases and decreased them in others. So Trailing Stop cannot be considered for sure as a positive feature in this strategy. Moreover, if you check symbols with a large historical data period (Starbucks, Petrobras, YM), Trailing Stop reduces their profitability. So, an improvement in results of symbols without a large history can be random.
However, Trailing Stop can really slightly reduce the chances of having the entire chain closed by Stop Loss. See FOXA.m symbol results. We had an entire chain closed by Stop Loss without trailing stop. The trailing function helped us eliminate it.
It is strange that FOXA.m results in current tests are much worse than those from the previous table. From the Strategy Tester report on this symbol (attached below) we can see that Stop Loss on the entire chain was registered long time ago. The strange fact is that in all previous numerous tests we did not have this Stop Loss.
Unfortunately, the Strategy Tester does not perform identical tests. It may use 0%, 2%, 8$ or any other share of real data for the same financial instrument. That is why testing results also change.
I do not know why this happens (if you know any trick to have the same results in each testing run, please share it in comments). At least this is another reason why you should not fully trust testing results obtained with historical data.
Signals based on the reversing technique
More than three months have passed since I launched a signal in the Forex market, which applies the reversing trading strategy. It is not a very large time period, but quite enough for drawing intermediate conclusions.
The most important result is that it is still in profit. It makes 8% per month on the average, i.e. about 100% per year.

We did not have losing months except for the first month. But the loss in the first month is quite understandable. First, the signal run only for a few days. Second, since we are using entries in one predetermined direction, it's natural that the first EA operation steps turned out to be unsuccessful.
As for negative sides, Gold managed to reach the 7th step in a chain. Remember, for 18-year testing Gold reached a maximum of 8th chain step. In my signal, it reached the seventh step for as little as three months. In that case I decided not to wait for Take Profit and closed the entire chain as soon as the profit exceeded losses of the entire chain. Some of the profit might be lost due to swaps, but they were fully covered by profits on other symbols.
As seen from the above image, the largest drawdown was obtained due to Stop Loss at the 6th and 7the step in Gold chains. Fortunately, profit on other symbols helped to reduce this drawdown.
As for other symbols, GBPUSD reached the 6th step. Other chains were closed by Take Profit at a maximum of 4th-5th chain step.
Only 5-10% of all entries were closed at the first step. This is an indication of our random entries =)
Continue to monitor the signal and evaluate the risks and profits of the strategy. I am not going to stop this signal.
Writing a manual trading algorithm using levels
Automated trading has many advantages, such as the strict following of the trading strategy and free time, which you have, while the robot is trading for you. However, a successful manual trading can show much higher profitability. In addition, there are other disadvantages:
- a huge loss if the entire chain closes by Stop Loss;
- large free margin requirement for the last steps in a chain, if you use lot doubling at each step (other lot calculation methods are not suitable for the used SL to TP ratio).
If in the first step the maintenance margin is equal to 1 dollar, in the seventh step it would be equal to 64 dollars. It means you need to have 64 free dollars in your account to support a position for only one symbol. The resulting profit is relatively small compared to the required deposit.
Manual trading allows you to reduce the maximum required margin by applying lot doubling not at each step, but after 1, 2 or even 3 steps. You choose when to enter a trade, as well as which Stop Loss to Take Profit ratio to use.
Also, the use of lot doubling after one, two or three steps allows to increase the maximum acceptable number of steps in a chain, and therefore to increase chances of closing with profit.
That is why, in this section I want to offer one of the possible manual trading algorithms using the reversing technique. I cannot say for sure that this is the best version. But in addition to reversing, the strategy involves diversification, which may also reduce overall risks to some extent.
Moreover, diversification allows for a flexible risk management. For example, if your account balance increases by the end of the day or week, you can close all open positions, including losing ones. In this case you do not need to wait for a reversing step at which the price would move in the favorable direction.
Manual trading tools. Specially for the manual trading purposes, I have created the RevertManualEA Expert Advisor for MetaTrader 5 and RevertmeManualEA4 for MetaTrader 4 (both of these EAs are available in the article attachments). These EAs manage trades which you open manually. The symbol of the trade is not important for the EA. It will manage all symbols no matter on which symbol chart the EA is running. So, you need to launch the EA only once, for example on your VPS. After that you will be able to perform trades from any computer using your MetaTrader 5 account.
For RevertManualEA to manage a position, you should do the following when performing a trade:
- Specify the same Magic number used by RevertManualEA (by default 777);
- In order comments, specify the step number (i.e. 1).
Unfortunately, comments or Magic number cannot be specified during manual trading from MetaTrader 5. Therefore, we need a special Expert Advisor for opening positions with appropriate parameters. Such as the Expert Advisor Creating orders with a fixed stop in dollars.
As for MetaTrader 4, it allows the setting of a comment, but does not support the specification of a Magic number. So we also need a separate EA for opening positions. Such as the Expert Advisor Creating orders with a fixed stop in dollars (MT4).
Trade entry algorithm. So, any trading activity will be profitable if Stop Loss triggers less frequently than Take Profit, while the amount lost at Stop Loss is less than the amount earned at Take Profit. The logic is very simple.
The reversing technique allows reducing the chances of hitting a Stop Loss level. And the more steps in a chain you perform, the less chances you have of losing money. However, this may also increase the amount of potential loss, in case the entire chain closes by Stop Loss.
That is why I suggest doubling the position size not at every step, but after two steps. This allows reducing potential loss in case the entire chain closes by Stop Loss, as well as reducing the margin requirement in the last chain steps.
In addition, in order to reduce the loss in case the entire chain closes by Stop Loss, we will use diversification and enter positions on 5 symbols at a time, instead of opening only one symbol deal.
Let us open positions in a total of $10 Stop Loss, i.e. the Stop Loss of each position will be equal to $2. In this case, depending on the Take Profit size and the doubling step, we may receive the following profit on each symbol:
Take Profit 3:1, lot doubling after 2 deals:
- Step 1: $6;
- Step 2: $4;
- Step 3: $2;
- Step 4: $6;
- Step 5: $2;
- Step 6: -$2;
- Step 7: $6;
- Step 8: $2;
- Stop Loss: -34 $.
Take Profit 4:1, lot doubling after 2 deals:
- Step 1: $8;
- Step 2: $6;
- Step 3: $4;
- Step 4: $10;
- Step 5: $6;
- Step 6: $2;
- Step 7: $14;
- Step 8: $6;
- Stop Loss on the entire chain: -34 $.
Take Profit 4:1, lot doubling after 3 deals:
- Step 1: $8;
- Step 2: $6;
- Step 3: $4;
- Step 4: $2;
- Step 5: $8;
- Step 6: $4;
- Step 7: $0;
- Step 8: -$4;
- Stop Loss on the entire chain: -$24.
In the above variants, losses in case of a Stop Loss on the entire chain are much higher than each position profit. Therefore, you should have a significantly greater number of profitable deals than whole losing chains. From my own experience, I may assume that this can only be achieved through the use of large Stop Loss values. Even if you believe your deal opening levels to be very reliable, situations when the price starts moving up and down, hitting your Stop Loss levels, may often happen during short-term trading.
Therefore, you may use the following set of parameters during short-term trading:
Take Profit 5:1, lot doubling after 3 deals, only 3 deals in a chain:
- Step 1: 10 $;
- Step 2: 8 $;
- Step 3: 6 $;
- Stop Loss on the entire chain: -$6.
In this case we only use three reversing steps. In the first step we may earn profit if we the price moves in the expected direction. In the first step, we may get profit if our assumption related to a roll back from a level was wrong, and the level was broken. In the third step, we may earn profit if this was a false breakout. After that we fully exit the position, expecting that the level is lost and further chain steps would not help us.
You may also use the Take Profit level of 5:1, doubling after 2 deals and a very large number of steps in a chain. Such as, for example, 20-30. The more steps you allow, the less is the possibility of closing the whole chain by Stop Loss. The main thing is to calculate the required deposit to make sure it can withstand the drawdown throughout the chain steps. Also, your entire deposit should not be lost in case of the whole chain loss. Even after such a situation, you need to have funds to trade further.
Position exit. Positions are managed and closed by RevertManualEA (or RevertmeManualEA4). In addition, you can always close a separate position or all open positions.
Closing all positions is simple. For example, if the summary result of all open positions is positive and you do not want to wait each of them to be closed by a Take Profit. Open the symbol chart on which the EA is running. The Close all button is available on the chart. A click on this button will close all positions having the same Magic number, which is specified in the EA settings. In addition to closing all positions, this will delete all orders for further chain steps.
Manual trading example. The below video demonstrates manual trading using two Expert Advisors: RevertManualEA and Creating orders with a fixed stop in dollars.
The profitability of this system during manual trading depends greatly on the accuracy of your entry points.
Conclusions
As a conclusion, I would like to state once again that the reversing trading strategy can really be used for trading.
It will not bring you huge profits. The expected maximum when used with an acceptable risk is about 100% per year.
The system will not save you from losses. The whole chain can at any time be closed by Stop Loss and you will lose all profit received in the last N years.
But the system can work. To make it work, you need to follow two main rules:
- Do not use tight Stop Loss, better use Stop Losses values at the medium-term trading levels;
- Use Take Profit larger than Stop Loss.
Both during automated trading testing and in manual trading, tight Stop Loss levels do not allow profiting, if the number of trades within a chain is less than 10-15. Ranging movements often happen in the market, during which the entire chain gets closed by Stop Loss. In this case, you lose all the profit you received earlier. Therefore, it is very problematic or even impossible to perform automatic intraday trading using the reversing technique.
There is another problem with tight Stop Loss. Spread widening can kill your entire trading chain. Here is a real trading example:
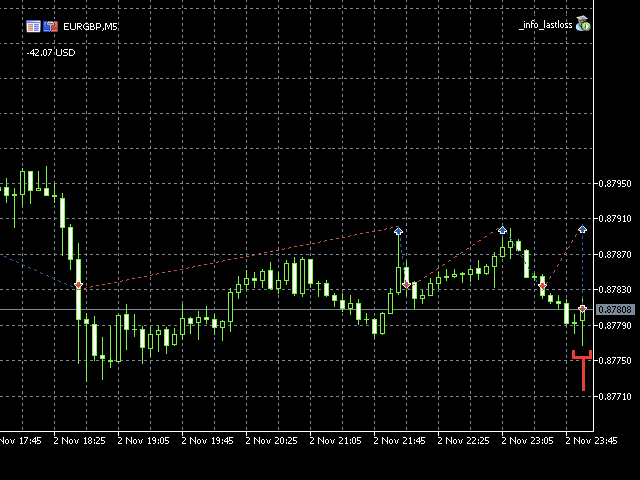
Look at the last step in the chain. The broker's spread by that instrument suddenly widened greatly and closed the previous step by stop loss, although the price was moving to the Take Profit direction. After that a limit order triggered and was immediately closed by Stop Loss, because the Stop Loss size was less than the spread value. No Expert Advisor would be able to create the next Limit order in such conditions. However, if another limit order were opened, it could also be closed with the same Stop Loss. The above example is a good evidence of that the use of tight stop levels with brokers offering floating spread may lead to complete deposit loss.
Attachments
The following zip archives are attached below:
- RevertEA.zip. A zip archive with an Expert Advisor for MetaTrader 5
- RevertManualEA.zip. A zip archive with an Expert Advisor for MetaTrader 5
- RevertmeManualEA4.zip. A zip archive with an Expert Advisor for MetaTrader 4
- SETfiles.zip. A zip archive with SET files with optimal settings for various symbols and different brokers
- TESTfiles_ma.zip. A zip archive with the testing reports for a trading strategy using the Moving Average
- TESTfiles_ma_norevert.zip. A zip archive with the testing reports for a trading strategy using the Moving Average, without the reversing technique
- TESTfiles_plain.zip. A zip archive with the testing reports for a reversing trading strategy without a Moving Average
Testing report archives contain reports only related to symbols considered in this article. This is because an archive for all symbols considered within this series of articles is too large and cannot be attached to the article.
The following suffixes can be used in SET files and report name:
- no suffix — a trading system based on the reversing technique without the use of a Moving Average, with Stop Loss and Take Profit specified in points;
- _ma — a trading system based on the reversing technique and a Moving Average;
- _norevert — a trading system based on the Moving Average, without the reversing technique;
- _inf — a trading system without the Moving Average, using the reversing technique and Trailing Stop
- _percent — a trading system based on the reversing technique, without a Moving Average, with Stop Loss specified as a percentage of the price
- _atr — a trading system based on the reversing technique, without a Moving Average, with Stop Loss specified as a percentage of ATR.
Translated from Russian by MetaQuotes Ltd.
Original article: https://www.mql5.com/ru/articles/5268
 DIY multi-threaded asynchronous MQL5 WebRequest
 Reversing: Reducing maximum drawdown and testing other markets
 Using OpenCL to test candlestick patterns
- Free trading apps
- Over 8,000 signals for copying
- Economic news for exploring financial markets
You agree to website policy and terms of use