
Developing a cross-platform grider EA (part II): Range-based grid in trend direction
Introduction
In the previous article, I developed a simple grider EA working both in MetaTrader 4 and MetaTrader 5. Its main feature is that after placing a grid, it adds no new orders to it till the current grid is closed with a profit or a maximum overall loss.
According to the tests, our grider showed profit since 2018. Unfortunately, this is not true for the period of 2014-2018 marked by consistent loss of
the deposit. Therefore, using it on a real account is too dangerous. In this article, we will develop a grider EA based on a new trading idea.
Trading system
The main idea of the EA from the first part of the article is based on the assumption that the price most often moves in a certain direction. This means that if we open several orders in the wrong direction, new orders opened in the right direction are able to compensate losses. Thus, sooner or later, we are able to reach the necessary profit for all open orders. When implementing this idea, we set a grid of N Long orders above the current price and the grid with the same amount of Sell orders below the current price.
However, further testing showed that the price often touches an order above then moves down touching an order below only to go up again. Thus, it gradually activates all or almost all Long and Short orders reducing all potential profit down to zero. Apparently, such a trading system is far from perfect.
However, if this price behavior is so frequent and the Forex price often moves within a range, then why don't we use that to our benefit? We will still set the grid to Long above the current price and the grid to Short below it. But we will make two important changes.
First, we will set a take profit to each position rather than the entire position chain. Settings for configuring a stop loss for each separate
order are to be implemented as well. However, the tests show that applying a stop loss do not bring profit. Therefore, we are not going to use
it.
Second, we will constantly add new limit orders to the grid if the current price is different from the previous one. Limit orders the price moved too far away from are removed. So, if the price moves one grid step up, we add a new Long limit order to the end of the current grid above the price, a Short limit order is added below the current price to be the first one, while the last Short limit order below the current price is removed. Thus, our grid follows the asset price.
During a trend, we will receive take profits by orders during the trend movement. In case of a correction, we receive take profits towards the
direction. Thus, if on a large timeframe, the price moves in a range changing direction, we will collect profit regardless of the price
direction.
Now let's check the actual results.
Developing the basic EA version
Unlike the first article, here we will not analyze the EA's source code. Both the source code and the compiled EA for MetaTrader 4 and MetaTrader 5
are attached to the article for you to have a look. In this article, we will build the algorithm and conduct the tests.
Distance between the grid orders.
We will start with the distance between limit orders in the grid. All limit orders should be set on a similar distance from each other. This is not an issue if we set the entire grid at once without editing it when the price changes. However, our grid is "floating". Before setting a new limit order we need to somehow define if a limit order is present at this grid step.
We cannot simply check if the limit order is present at the same price. The order's price may be a few points higher or lower. If we do not consider this, our EA may set hundreds of limit orders at relatively similar prices ruining our trading.
To avoid this issue, we will not set the distance between limit orders in points. Instead, we will use the price decade to set the distance between the grid steps. This is to be done by the Decade for limit orders EA parameter.
If its value is positive, it specifies the decimal place the grid orders are to be set in. For example, the value of 2 means that the grid is set at
each 1/100 of the price step. For example, if the current price is 1.1234, the Long grid is set at 1.13, 1.14, 1.15, …, while the Short one is set
at 1.11, 1.10, 1.09, …. In other words, the distance between grid orders will be 100 points on 4- and 5-digit symbols (most Forex symbols).
At the same price of the decade 3, the grid will be located at the third decimal place:
- for Long: 1.124, 1.125, 1.126, 1.127, …;
- for Short: 1.122, 1.121, 1.12, 1.119, ….
Thus, we have the distance between orders of 10 points. If the parameter value is 0, the grid has the step of 1 (for example, at 111, 112, 113, 114).
Negative values are also supported by this parameter. They shift the decade to the left from the decimal point. For example, -1 means the grid is set with the step of 10, while -2 means the step of 100.
This grid placement method simplifies the check for a limit order presence in a necessary grid step but also allows considering levels formed by round prices in trading. In fact, we set limit order in round prices.
There is yet another parameter affecting the grid step — "Shift in points". It allows shifting the grid step from the
round price to the specified number of points. For example, in case of the decade 2 and shift 1, the grid is placed not at 1.12, 1.13, 1.14 but at
1.121, 1.131, 1.141 if these are Long orders above the current price and at 1.119, 1.129, 1.139 if these are Short orders below the current
price. This allows us to cover using round prices even more, hoping that, in an unfavorable scenario, the price does not touch a limit order
before moving in the opposite direction.
As for the "Shift in points" parameter, the test shows that it does not always leads to a positive result.
Main EA parameters.
Apart from the parameters considered above, the EA has multiple other parameters:
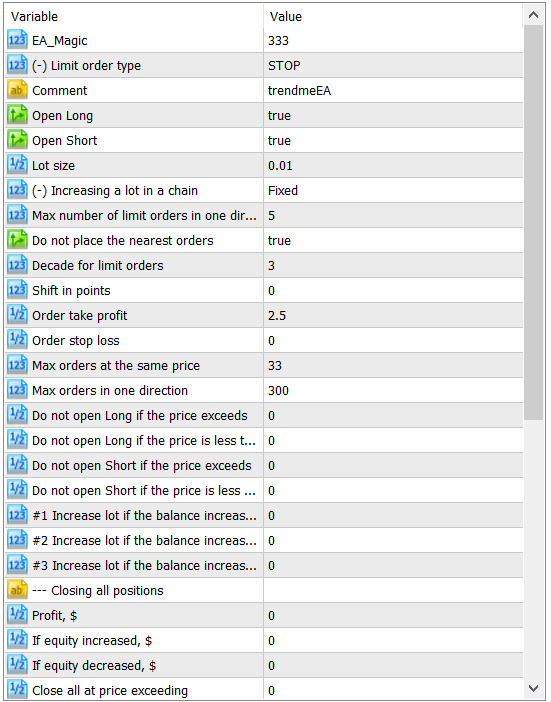
The most important ones among them are as follows:
- "Lot size". The lot size defines the lot volume used when setting each limit order.
- Max number of limit orders in one direction" parameter. This parameter defines the number of limit orders in the grid
from one side of the price. In other words, the grid always consists of a doubled value of this parameter. As soon as the price moves in one
of the grid directions turning limit orders into open positions, the EA opens new limit orders (closing the ones located too far from the
price), so that their total number from each side of the price corresponds to the parameter. To be more precise, new limit orders are set
when a new bar appears on the timeframe the EA is launched at.
- "Order take profit". The parameter defines a take profit for each separate limit order and is specified in EA grid steps. For example, the value of 2 indicates that the position is closed when the price moves two next grid limit orders in its direction. If Decade for limit orders is 3, the actual take profit is set at 0.002 of the current price (20 points of profit).
- "Order stop loss". The parameter defines a stop loss for each limit order in EA grid steps. According to the tests, placing any stop losses in this type of grider EA is inefficient, therefore we will not use them.
A take profit for separate orders should be mentioned separately. An optimal value for this parameter mainly depends on the symbol price movement. Most often, however, it is located within the range of 1-5. Both the values closer to 1 and the ones closer to 5 have their benefits.
The lower the value, the lesser the position profit and the faster it is closed. This provides two benefits:
- even in a small range, positions are opened and closed with profit at each price movement in one of the directions;
- since the take profit is small, the price during corrections leaves less orders in the direction opposite to the current one, thus the
load to the deposit is reduced.
A large take profit is also beneficial:
- during large trend movements, the overall profit is greater if large take profits are used.
Thus, in case of small take profits, the deposit drawdown (and a potential profit) is lower.
Closing all positions. Apart from the take profit for separate grid orders, you can use a number of other parameters to close all open positions in case of certain events. All these parameters are gathered in a separate "Closing all positions" group:
- "Profit, $". Close all open positions if the overall profit reaches a specified sum in $.
- "If equity increased, $". Close all open positions if equity is currently larger (by a specified value in $) than it was when
opening an initial grid. If closing all positions is used, this option is more preferable.
- "Close all at price exceeding". This is a protective parameter allowing the closure of all open positions if the price
exits the traded range upwards. It is a price, above which all open positions are to be closed.
- "Close all at price less than". This is a protective parameter allowing the closure of all open positions if the price
exits the traded range downwards.
Initially, closing all positions when exiting the range may seem quite appealing. However, in practice, it usually destroys the entire profit obtained before. As we will see below, deciding what to do after the price exits its range and a strong trend appears is a keystone of this trading strategy.
Other parameters. We have analyzed only a small portion of the parameters present in the EA. We will have a look at some other
parameters below. However, there are some parameters we are not going to apply. Their names are marked with
(-). Each of them implements a certain idea but their application yields no positive results. Despite they are useless for us, we will
have a look at them anyway. You may use them in your strategies or find some ways to improve them.
Testing tools
Before we start the test, let's have another look at the idea the EA is based on and how it is implemented.
It is quite difficult to forecast the price movement of most assets with a relative certainty. The price may initially rise forming a new high and then go down by forming a new low. Then the movement changes again, and the price goes up closing a bit lower than the previous high or forming a new one. Long-time unidirectional price movements are usually accompanied by corrections. This is exactly what we need since we are going to get profit regardless of the price direction.
To do this, we will set limit orders above and below the current price. Orders are to be located at a similar distance from each other. Above the price, we will set Long orders assuming that if the price currently goes up, it will do that later as well. Short orders are to be located below the price.
The number of orders in the grid is set using the "Max number of limit orders in one direction" parameter. This
value is not so important here. When a new bar appears on a timeframe the EA is launched at, we are going to add new orders to the grid if the price
touches any of the current orders turning it into an open position.
Thus, the "Max number of limit orders in one direction" parameter may be relevant only during the very fast and strong price movements when the price pierces all grid orders within a single timeframe bar moving in the same direction afterwards.
Timeframe. The tests showed that the EA yields better results on M5. Therefore, this is where we are going to conduct all the tests.
Choosing the market. The very idea the EA is based on makes it clear that range markets (including Forex) are the best ones for it. Besides, it would be good if a range can be seen on the W1 or MN timeframe the price is located at.
For example, let's have a look at AUDCAD:
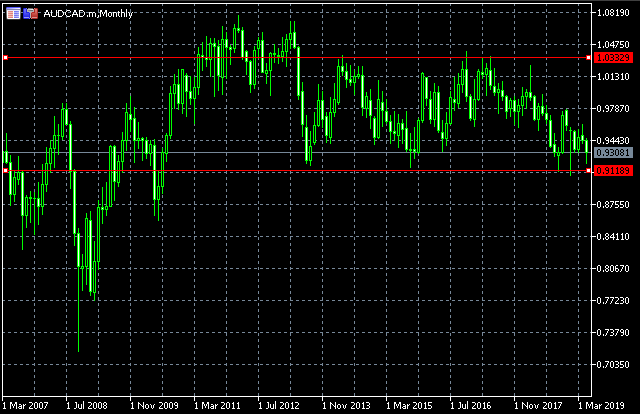
It is in a range for the last 5-10 years. In theory, the trading strategy we have selected should be perfect for AUDCAD and similar symbols.
Let's check that.
We will test the EA on the following symbols: EURUSD, AUDUSD and AUDCAD. For all symbols, we will test the grid step of 10 points (decade 3). We may trade using the greater step of 100 points (decade 2), but this would be a long-term trading with a small number of deals per year.
Test period.
In this article, we are not interested in periods less than 1 year. For test purposes, we will look to the period of 4 years (2015-2019) and
search for most profitable settings exactly for this period. The EA does not pass the test on periods exceeding 10 years or passes them with
small profits on low take profit levels. So, this is not a "set-and-forget-for-ten-years" EA.
Testing EURUSD with the step of 10 points (decade 3)
First of all, let's test the basic idea of the trading strategy. All parameters are set by default, including the ones we have already analyzed:
- no stop loss;
- no closing all positions by a condition.
Optimization is performed by a take profit for a separate orders as well as by the "Shift in points" parameter. Optimization method — 1 minute OHLC. After that, the final result is tested using the "Every tick" method. Reports on all tests are attached to the article.
According to the test, the best results were obtained at the take profit of 2 and the shift of 1 point:
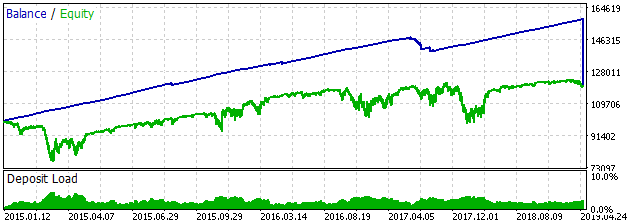
The most important test results:
| Symbol |
Max drawdown |
Profit |
Recovery factor |
Profit factor | Trades |
|---|---|---|---|---|---|
| EURUSD |
23 522 |
20 641 |
0.88 |
1.39 |
40 536 |
Although we ended up with profit, the results are not satisfactory. This is clearly shown by the recovery factor equal to 0.88.
In fact, the recovery factor displays the ratio of a profit to a maximum drawdown (a profit is divided to a maximum drawdown). If its value is less than 1, our profit is lower than the EA's drawdown.
I believe, most of us would be satisfied by a profit of at least 100% of the deposit per year. Since we perform the test on the period of 4 years,
we would be satisfied by the recovery factor exceeding 4. Let's try to improve our trading system.
Do not place the nearest orders.
As mentioned above, the EA applies a floating grid following the price movement. If the price moves upwards, the EA sets an additional limit order for the current price.
But what if the nearest orders are often touched during corrections and are not closed by the take profit? Let's disable placing additional orders too close to the price. This can be achieved through the " Do not place the nearest orders" boolean parameter. Let's see what happens after its activation:
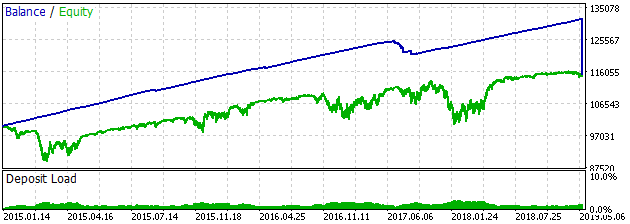
The differences are not so evident. Perhaps, we will see them in the test results:
| Symbol |
Max drawdown |
Profit |
Recovery factor |
Profit factor | Trades |
|---|---|---|---|---|---|
| EURUSD |
12 987 |
15 302 |
1.18 |
1.64 |
21 350 |
We have decreased the number of trades almost 2 times. If you want to profit from broker's bonuses, this is not good news. The profit level has also decreased. However, the maximum drawdown has decreased almost 2 times and the recovery factor has exceeded 1.
The parameter acts the same way on other tools in case of decade 3 (the distance between the grid orders is 10 points). It allows reducing the
number of trades since small price movement corrections do not reach the grid. If the price is currently in a trend, the scenario is
promising. But if we are in a range (and the price would have returned to the previously opened order anyway), using this parameter reduces
potential profit.
Entry in the bar direction.
Let's continue improving our EA. Almost all trading gurus recommend trading in a local trend direction only. How to define such a trend? All is simple. If the price moved upwards on a previous bar, trade Long only and vice versa.
As a rule, it is recommended to analyze a local trend on daily charts. In other words, if the price moved up yesterday, trade Long. If it moved down, trade Short. Let's follow this recommendation. Apart from D1, we will test other timeframes as well.
To configure trading in bar movement direction, we will use the EA parameters from the "In bar direction" group:
- "Use entry by bar only". Set true to enable the feature.
- "Bar accounting type". I tried to avoid entering against the bar or enter with the minimum take profit. The option with the minimum take profit was always worse, therefore the default parameter value is " Do not enter" and I recommend leaving it intact.
- "Bar index". In some trading systems, it is recommended to define a local trend using both yesterday's and today's bars. In other words, if the price moved up yesterday and today's bar is bullish as well, enter Long only. Let's check this option as well. The parameter has the following values: bar 1 (check only the previous bar), bar 0 (check only the current bar), bars 0 and 1 (both previous and current bars should move in the same direction). The tests showed that the bar 1 option always yields better results. So, I recommend leaving this parameter intact.
- "Timeframe". Select a timeframe whose bars are to be checked.
After testing entering by bar on various timeframes, it turned out that MN timeframe works best for EURUSD:
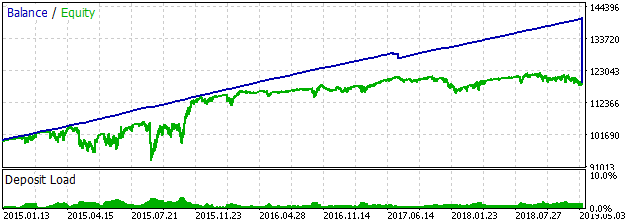
Test results shown as a table:
| Symbol |
Max drawdown |
Profit |
Recovery factor |
Profit factor | Trades |
|---|---|---|---|---|---|
| EURUSD |
13 044 |
19 227 |
1.48 |
1.8 |
23 445 |
Entering by bar improves results on all symbols. However, entering by bar on MN is most probably an exception since D1 works perfectly in most cases. Since we set a grid only in one direction at a given moment, there is no point in using the "Do not place the nearest orders" parameter.
Trading in a range. As specified in the article subject, the EA is designed for trading in a range. Therefore, if the price is located in a range on W1 or MN chart, its trading results should be better. Let's check that by setting a trading range. We will need the "Do not open Long if the price is less than", "Do not open Long if the price exceeds", "Do not open Short if the price is less than" and "Do not open Short if the price exceeds" parameters for that.
Roughly set the "Do not open Long if the price exceeds" and "Do not open Short if the price exceeds" parameters to 1.17849. Set the remaining two parameters to 1.09314:
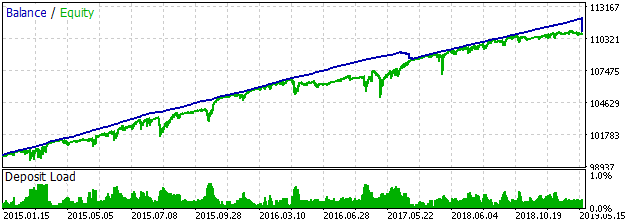
The results have definitely improved:
| Symbol |
Max drawdown |
Profit |
Recovery factor |
Profit factor | Trades |
|---|---|---|---|---|---|
| EURUSD |
2 412 |
10 964 |
4.55 |
6.16 |
6 974 |
Close all positions when increasing equity.
At the beginning of the article, we described the "Closing all positions" parameter group. It includes the "When equity increased, $" parameter. The logic tells us that the parameter should improve our results since it allows closing all loss-making positions opened at the moment and starting trading anew. To do this, simply wait till the price enters the range and the equity of our account is increased by the specified value. According to trading gurus, the price moves within a range 70% of its entire time.
In reality, using this parameter does not always improve the results. This happens probably because we close loss-making deals that could potentially turn into profitable ones during the price reversal.
However, in our case, the "When equity increased, $" parameter actually improves the results. The value of $2 000 turned out to be the best:
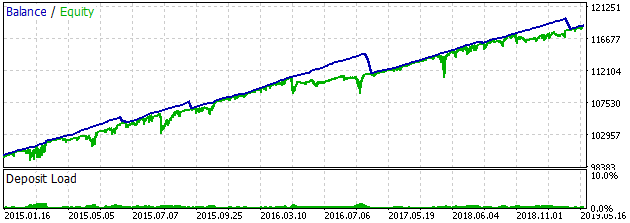
| Symbol |
Max drawdown |
Profit |
Recovery factor |
Profit factor | Trades |
|---|---|---|---|---|---|
| EURUSD |
3 200 |
18 532 |
5.79 |
3.8 |
6 954 |
This is the last test at EURUSD, so let's draw some conclusions. We managed to gain the profitability of almost 150% a year while using a fixed lot. In other words, if we increase the lot when increasing the account balance, we are able to make much more profit.
However, the results are not impressive. We have received 150% a year while the drawdown is almost 100%. Most investors require the drawdown to not
exceed 20% of the deposit. I think, this is a rather strange requirement as 80% of the balance stands idle in that case. You can as well deposit
them in a bank leaving the remaining 20% for trading. However, such a requirement exists, which means we need to decrease our trading volumes
5 times to remain within the drawdown of 20%. Thus, the expected profit is 30% a year, not 150%. The results are far from perfect.
Let's test other symbols.
Test results. As already mentioned, all reports of each intermediate test are attached to the article together with SET files of
the final test both at EURUSD and other described symbols.
Testing AUDUSD with the step of 10 points (decade 3)
Let's start testing AUDUSD with the basic settings as well:
- no stop loss;
- no closing all positions by a condition.
Optimization was performed by a take profit and the "Shift in points" parameter. The best results were obtained at the take profit of 3 and the shift of 0:
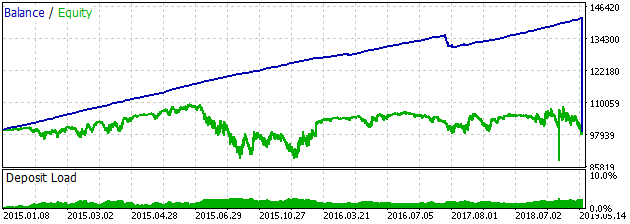
| Symbol |
Max drawdown |
Profit |
Recovery factor |
Profit factor | Trades |
|---|---|---|---|---|---|
| AUDUSD |
21 468 |
-546 |
-0.03 |
0.99 |
18 104 |
Do not place the nearest orders. We were not able to obtain profit even with the best basic parameters. But let's try enabling the "Do not place the nearest orders" parameter:
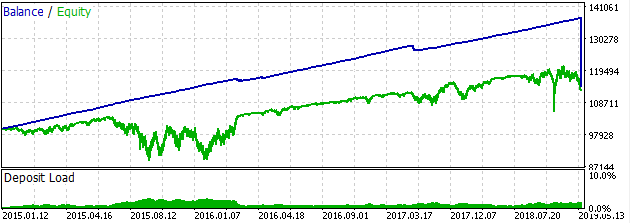
| Symbol |
Max drawdown |
Profit |
Recovery factor |
Profit factor | Trades |
|---|---|---|---|---|---|
| AUDUSD |
14 701 |
14 415 |
0.98 |
1.54 |
15 049 |
Entry in the bar direction.
This looks a bit better. Let's test the entry by the previous bar on various timeframes:
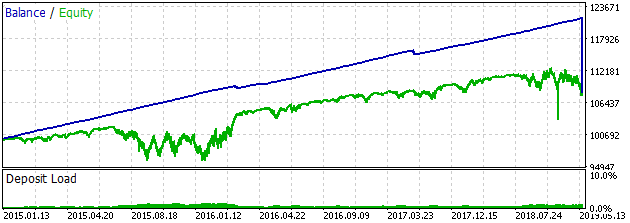
| Symbol |
Max drawdown |
Profit |
Recovery factor |
Profit factor | Trades |
|---|---|---|---|---|---|
| AUDUSD |
9 186 |
8 364 |
0.91 |
1.56 |
8 573 |
Trading in a range.
D1 turned out to be the best, although its result worsened a bit as well. Anyway, let's use it and test working in a range. Let's roughly set the range borders to 0.79728 above the current price and 0.70417 below it:
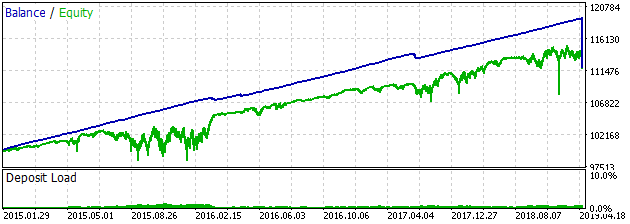
| Symbol |
Max drawdown |
Profit |
Recovery factor |
Profit factor | Trades |
|---|---|---|---|---|---|
| AUDUSD |
6 769 | 11 937 |
1.76 |
2.35 |
7 591 |
Close all positions when increasing equity.
As expected, the results improved. The recovery factor almost doubled. Finally, let's test closing all positions with an increased equity:
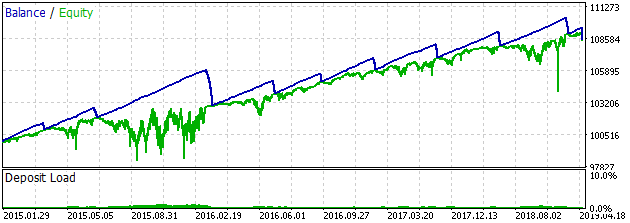
| Symbol |
Max drawdown |
Profit |
Recovery factor |
Profit factor | Trades |
|---|---|---|---|---|---|
| AUDUSD |
4 270 |
8 552 |
2 |
1.74 |
7 593 |
If we close positions when increasing equity by 1 000, it is possible to increase the recovery factor up to 2. This is a small profit for the final result. Perhaps, AUDCAD will fare better...
Testing AUDCAD with the step of 10 points (decade 3)
At the beginning of the article, we mentioned the AUDCAD chart to illustrate the price movement that fits the EA. Its MN timeframe clearly shows the range where the price is moving. Now it is time to check how profitable trading this symbol will be.
The basic test showed the best results at the tike profit 4 and the shift of 0:
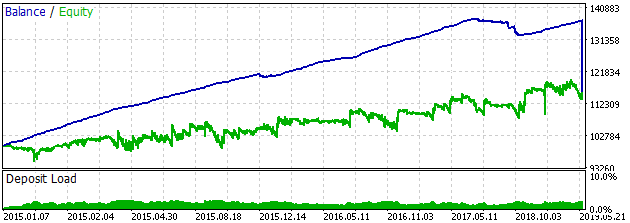
| Symbol |
Max drawdown |
Profit |
Recovery factor |
Profit factor | Trades |
|---|---|---|---|---|---|
| AUDCAD |
8 216 |
16 149 |
1.97 |
1.53 |
17 852 |
Max orders at the same price.
Using the basic settings, we reached the recovery factor of about 2, i.e. the same result as when using the final settings at AUDUSD.
This result can be improved further if we change the "Max orders at the same price" parameter we have not described in the article yet. Its default value is 33. This means the EA is allowed to open up to 33 positions at the same price in a single direction. In reality, this means unlimited number of positions at a single price since we never opened more than 10 positions at a single price during the tests.
How are positions opened at a single price? All is simple. Suppose that the price moves up and touches the nearest order. After that, the price rolls back so that the EA sets a new limit order above at the same price. After that, the price tests the level again touching a placed order, and so forth.
We have not considered the "Max orders at a single price" parameter previously since opening unlimited number of positions at the same price allowed increasing the EA profitability. But the case is different with AUDCAD. Perhaps, this has to do with the symbol price movement, but if we disable placing limit orders on prices that were already used to open positions, the result will be better. Thus, set the "Max order at a single price" to 1:
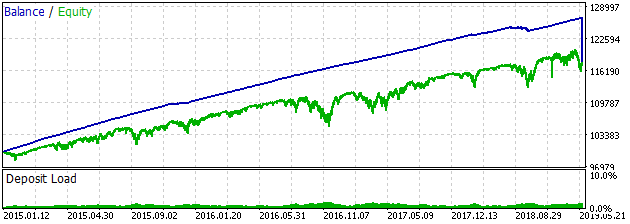
| Symbol |
Max drawdown |
Profit |
Recovery factor |
Profit factor | Trades |
|---|---|---|---|---|---|
| AUDCAD |
5 896 |
18 087 |
3.07 |
2.63 | 10 821 |
Do not place the nearest orders.
We managed to increase the recovery factor more than 1.5 times. Now let's get back to the beaten track and test enabling the "Do not place the nearest orders" parameter:
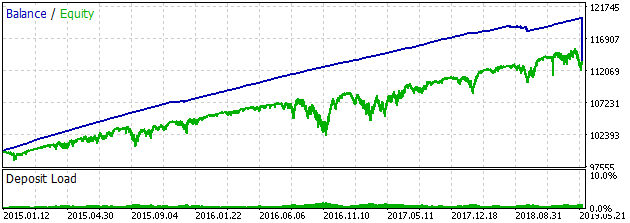
| Symbol |
Max drawdown |
Profit |
Recovery factor |
Profit factor | Trades |
|---|---|---|---|---|---|
| AUDCAD |
5 656 |
13 692 |
2.42 |
2.61 |
8 306 |
We have to admit that the results have become worse a bit. However, let's try to resume the test considering this parameter.
Entry in the bar direction.
Testing entries in the direction of the previous bar movement proved D1 to be the best timeframe for that:
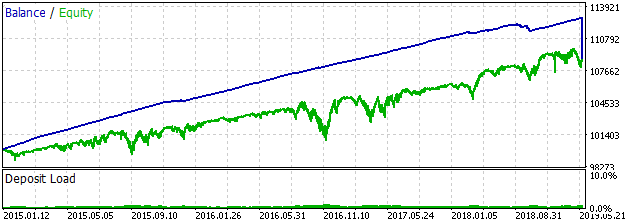
| Symbol |
Max drawdown |
Profit |
Recovery factor |
Profit factor | Trades |
|---|---|---|---|---|---|
| AUDCAD |
3 857 |
8 848 |
2.29 |
2.58 |
5 487 |
However, it did not help to improve the results. In fact, they became worse.
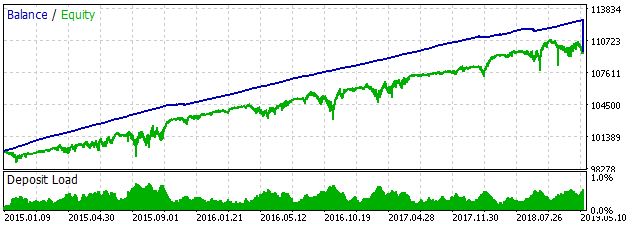
Trading in a range.
Let's continue the test by setting the range the EA is to work within. The upper border price is 1.02603, while the lower one is 0.93186.
| Symbol |
Max drawdown |
Profit |
Recovery factor |
Profit factor | Trades |
|---|---|---|---|---|---|
| AUDCAD |
2 684 |
9 692 |
3.61 |
3.33 |
5 224 |
The range has not let us down again and slightly improved the results.
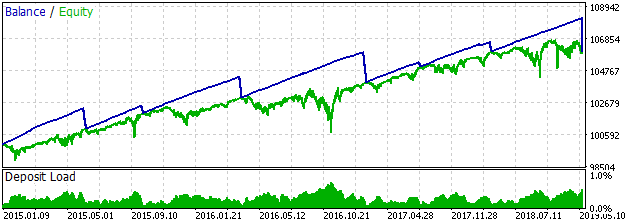
Close all positions when increasing equity.
The last optimization option from the standard set:
| Symbol |
Max drawdown |
Profit |
Recovery factor |
Profit factor | Trades |
|---|---|---|---|---|---|
| AUDCAD |
2 818 |
6 022 |
2.14 |
1.74 |
5 479 |
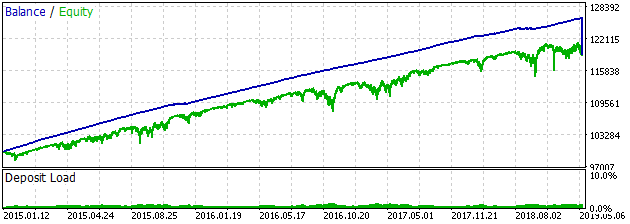
Alternative test. Let's discard the parameters that worsened the recovery factor and conduct a test without them. This means we should disable "Do not place the nearest orders" and entering in the bar movement direction. Also, we will not close all positions when increasing equity:
| Symbol |
Max
drawdown
|
Profit |
Recovery
factor
|
Profit factor | Trades |
|---|---|---|---|---|---|
| AUDCAD |
5 124 |
19 121 |
3.73 |
3.17 |
10 301 |
The result has improved but only a bit. We have about 100% profit a year.
What to do if the price leaves the range
After all the tests, we reached some result. They can hardly be called promising, but this is still a profit. Nevertheless, it is too deceitful.
The EAs' profitability was achieved by limiting their trading range. Such range is taken from history, and we cannot be sure the price will remain there. We may be lucky a few times and see how the price rolls back from the range border. But eventually our luck will come to an end. So what will we do?
One possible option is closing all positions. This sounds like a good option. But in reality, this means losing the most or entire profit. To add insult to injury, the price will most certainly reverse the next day.
According to the tests, the best option is to wait till the price returns to the range. Alternatively, you can wait till the price finds a new range and trade on it before the price returns to the previous one.
This may take years. However, the price will get back sooner or later.
If you do not want to wait for five or more years, then the only option is to trade manually and try to get advantage over the market using cards
you have on your hands.
Other EA parameters
Till now, we only discussed the EA parameters that are capable of improving its profitability. Each of the parameters represents a certain idea. There were plenty of ideas tested during the EA development. Unfortunately, most of them only further deteriorated the EA results. Therefore, the appropriate code was removed or the parameters implementing an idea were marked with "-" at the beginning of their names.
We will have a look at these parameters here but, according to the tests, changing their values will bring nothing good.
Limit order type. By default, the EA sets Long orders above the current price and Short orders below the current price. These orders are called Buy Stop and Sell Stop. The default value of the parameter is STOP.
If set to LIMIT, the EA will use Buy Limit and Sell Limit orders. In other words, its behavior will change drastically: it will set Sell orders above the price and Buy orders below it, thus trading against a trend. This may also bring some profit, but it will be far lower relative to the drawdown.
Increasing a lot in a chain. By default, all orders in the grid have a similar volume. However, this parameter makes it
possible for a volume of each new order in the grid to exceed the previous one. Such an increase may happen in both arithmetic and geometric
progression.
The tests show that it may increase an obtained profit but only due to increasing a maximum drawdown. Thus, the recovery factor will always be lower than when using a fixed lot.
Use trailing stop. The entire group of parameters allows enabling a trailing stop for each separate order. Unfortunately, this is not a good idea according to the tests.
Conclusion
In this article, we examined yet another possible grid. It is better than the one we analyzed in the previous article. But we still obtained a very risky trading strategy which may sooner or later destroy a deposit.
Does this mean that a grid cannot be used to develop a relatively good low-risk EA? I would not jump to such a conclusion just yet, since we have yet another way to arrange a grider EA.
We will discuss it in the next article. As usual, we will focus our attention on a cross-platform EA. It is capable of showing the following
results from 2010 to 2019 on a fixed lot:
| Symbol |
Max drawdown |
Profit |
Recovery factor |
Trades |
|---|---|---|---|---|
| USDCAD |
953 |
7 328 |
7.69 |
3 388 |
| NZDUSD | 1 404 |
11 288 |
8.04 | 2 795 |
| SBUX (2013-2019) |
140 | 1 890 |
13.5 | 442 |
Translated from Russian by MetaQuotes Ltd.
Original article: https://www.mql5.com/ru/articles/6954
Warning: All rights to these materials are reserved by MetaQuotes Ltd. Copying or reprinting of these materials in whole or in part is prohibited.
This article was written by a user of the site and reflects their personal views. MetaQuotes Ltd is not responsible for the accuracy of the information presented, nor for any consequences resulting from the use of the solutions, strategies or recommendations described.
 Developing a cross-platform Expert Advisor to set StopLoss and TakeProfit based on risk settings
 Grokking market "memory" through differentiation and entropy analysis
- Free trading apps
- Over 8,000 signals for copying
- Economic news for exploring financial markets
You agree to website policy and terms of use
I don't get it. Am I the only one who can't find a way to change a step??? What's it called? (the step size of each next trade)
Excuse me, have you found a way to change the pitch of orders?