
Reversal patterns: Testing the Head and Shoulders pattern
Contents
- Introduction
- 1. Theoretical aspects of the pattern formation
- 2. Pattern trading strategy
- 3. Creating an Expert Advisor for strategy testing
- 4. Combining two patterns into a single EA
- 5. Testing the trading system
- 6. Arranging trading signals on loss-making symbols
- Conclusion
Introduction
In the article "Reversal patterns: Testing the Double top/bottom pattern", we reviewed and tested the trading strategy based on the Double top pattern. This article continues the topic by considering another reversal pattern of the graphical analysis called Head and Shoulders.
1. Theoretical aspects of the pattern formation
Head and Shoulders and Inverted Head and Shoulders patterns are among the most well-known and widely used graphical patterns. The name of the pattern clearly describes its graphical structure. The Head and Shoulders pattern is formed at the end of the bullish trend and provides sell signals. The pattern itself consists of three consecutive price chart tops. The middle top rises above the two adjacent ones, like a head above the shoulders. The middle top is called the Head, while the adjacent ones are called the Shoulders. The line connecting the bottoms between the pattern tops is called the neckline. The signals of the pattern having its neckline inclined to the left are considered to be stronger. The Inverted Head and Shoulders pattern is a mirrored version of Head and Shoulders indicating a bullish movement.
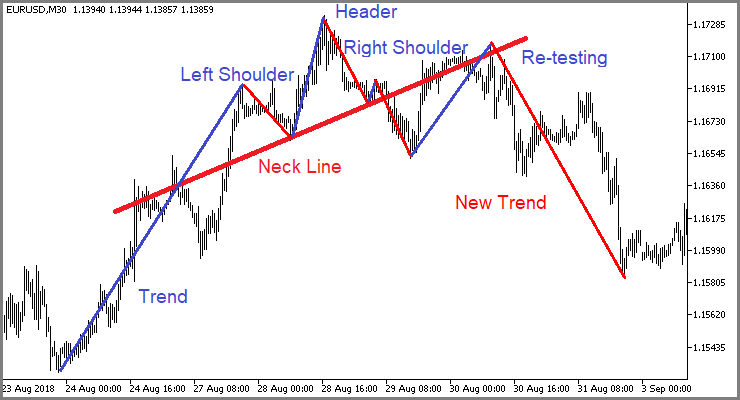
Most often, the pattern is formed in case of a false breakthrough of the price support/resistance level. Trend-following traders perceive a small correction (left shoulder top) as a good opportunity to increase their position. As a result, the price returns to the current trend and breaks the left shoulder level. After breaking through the current support/resistance level, the weakened trend is stopped by counter-trend traders increasing their positions, which leads to a new correction. A trend reversal is formed and the price falls below the level again (the head is formed). Another attempt to resume the trend demonstrates its weakness, a small movement is formed (the right shoulder). At this point, market participants notice a trend reversal. Trend-following traders exit the market en masse, while counter-trend ones increase their positions. This leads to a powerful movement and the formation of a new trend.
2. Pattern trading strategy
As with the Double top/bottom pattern, there are various strategies for trading Head and Shoulders. In many ways, they resemble trading strategies for the previous pattern.
2.1. Case 1
The first strategy is based on breaking through the neckline. In this case, the order is opened after the line is broken through with the Close price of the analyzed timeframe. In this case, a stop loss is set at the pattern head extremum level or with a small indent. The symbol spread should be considered.
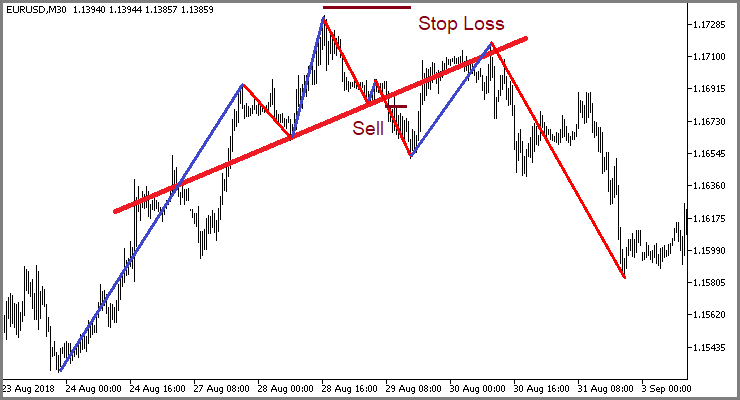
The drawback of this approach is the fact that a bar may close far from the neckline in case of a sharp price movement. This may cause profit losses and increase the risk of loss-making trades based on a specific pattern.
The variation of this case is performing a deal after the price overcomes a certain fixed distance from the neckline towards an emerging trend.
2.2. Case 2
The second pattern option — opening a position when the price rolls back to the neckline after breaking it through. In this case, a stop loss for the last extremum is set making it shorter and allowing a trader to open a trade of the greater volume at the same risk. This increases the potential profit/loss ratio.
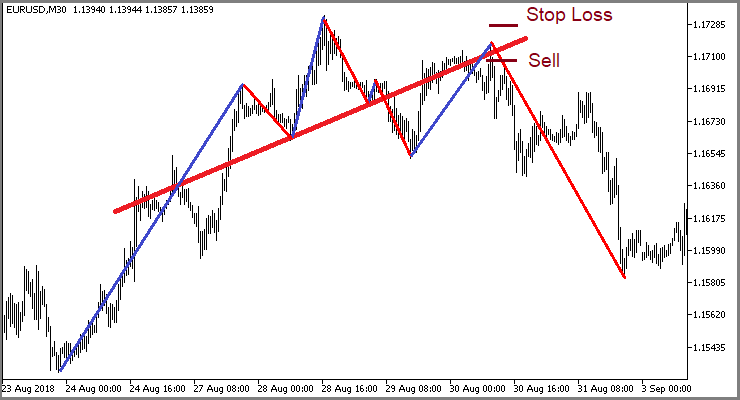
As with Double top/bottom, the price does not always return to the neckline after breaking it. As a result, a considerable number of patterns is skipped. Thus, in this case, we skip some patterns and are out of the market for the most time.
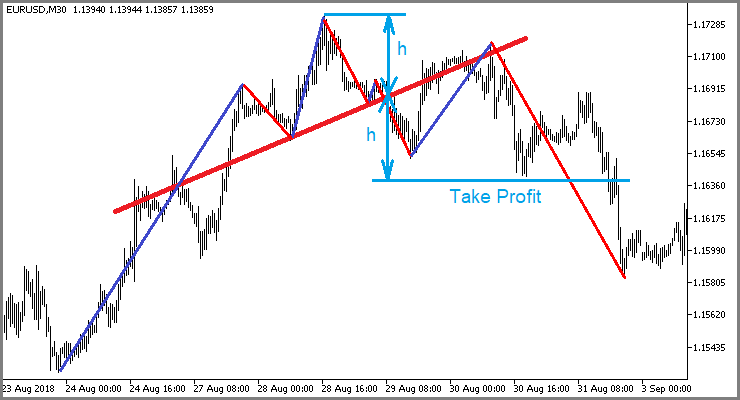
When using both cases, the minimum recommended take profit is at the neckline distance equal to the price movement from the head to the neckline.
3. Creating an Expert Advisor for strategy testing
You may have already noticed the similarity of the approaches to trading the Double top/bottom and Head and Shoulders patterns. We will use the algorithm from the previous article to develop a new EA.
We have already carried out most of the preparatory work in the article [1]. Let's create the CHS_Pattern class to search for patterns. It should be derived from the CPattern class so that we are able to apply the progress from the previous article. Thus, we will have access to all methods of the parent class. Here we will add only missing elements and rewrite the class initialization, pattern search and entry point methods.
class CHS_Pattern : public CPattern
  {
protected:
   s_Extremum     s_HeadExtremum;         //Head extremum point
   s_Extremum     s_StartRShoulder;       //Right shoulder start point

public:
                     CHS_Pattern();
                    ~CHS_Pattern();
//--- Initialize the class
   virtual bool      Create(CTrends *trends, double min_correction, double max_correction);
//--- Pattern and entry point search methods
   virtual bool      Search(datetime start_time);
   virtual bool      CheckSignal(int &signal, double &sl, double &tp1, double &tp2);
//---
   s_Extremum        HeadExtremum(void)      const {  return s_HeadExtremum;     }
   s_Extremum        StartRShoulder(void)    const {  return s_StartRShoulder;   }
  };
In the class initialization method, initialize the parent class first and prepare added structures.
bool CHS_Pattern::Create(CTrends *trends,double min_correction,double max_correction)
  {
   if(!CPattern::Create(trends,min_correction,max_correction))
      return false;
//---
   s_HeadExtremum.Clear();
   s_StartRShoulder.Clear();
//---
   return true;
  }
In the pattern search method, check a sufficient number of extremums to determine the pattern.
bool CHS_Pattern::Search(datetime start_time)
  {
   if(CheckPointer(C_Trends)==POINTER_INVALID || C_Trends.Total()<6)
      return false;
Then define the extremum index corresponding to the specified date the search for the patterns is to start from. If not a single extremum is formed after the specified date, exit the method with the false result.
   int start=C_Trends.ExtremumByTime(start_time);
   if(start<0)
      return false;
Next, download data on the last six extremums and check price movements for compliance with the necessary pattern. If the pattern is found, exit the method with the true result. If the pattern is not found, shift by one pattern towards the current moment and repeat the loop. If the pattern is not found after iterating over all extremums, exit the method with the false result.
   b_found=false;
   for(int i=start;i>=0;i--)
     {
      if((i+5)>=C_Trends.Total())
         continue;
      if(!C_Trends.Extremum(s_StartTrend,i+5) || !C_Trends.Extremum(s_StartCorrection,i+4) ||
         !C_Trends.Extremum(s_EndCorrection,i+3)|| !C_Trends.Extremum(s_HeadExtremum,i+2) ||
         !C_Trends.Extremum(s_StartRShoulder,i+1) || !C_Trends.Extremum(s_EndTrend,i))
         continue;
//---
      double trend=MathAbs(s_StartCorrection.Price-s_StartTrend.Price);
      double correction=MathAbs(s_StartCorrection.Price-s_EndCorrection.Price);
      double header=MathAbs(s_HeadExtremum.Price-s_EndCorrection.Price);
      double revers=MathAbs(s_HeadExtremum.Price-s_StartRShoulder.Price);
      double r_shoulder=MathAbs(s_EndTrend.Price-s_StartRShoulder.Price);
      if((correction/trend)<d_MinCorrection || header>(trend-correction)   ||
         (1-fmin(header,revers)/fmax(header,revers))>=d_MaxCorrection      ||
         (1-r_shoulder/revers)<d_MinCorrection || (1-correction/header)<d_MinCorrection)
         continue;
      b_found= true;
//---
      break;
     }
//---
   return b_found;
  }
On the next stage, re-write the entry points search method. At the start of the method, check if the pattern has previously been found in the analyzed class instance. If the pattern is not found, exit the method with the false result.
bool CHS_Pattern::CheckSignal(int &signal, double &sl, double &tp1, double &tp2)
  {
   if(!b_found)
      return false;
Then, check how many bars were formed after the pattern appeared. If the pattern has just formed, exit the method with the false result.
   string symbol=C_Trends.Symbol();
   if(symbol=="Not Initilized")
      return false;
   datetime start_time=s_EndTrend.TimeStartBar+PeriodSeconds(C_Trends.Timeframe());
   int shift=iBarShift(symbol,e_ConfirmationTF,start_time);
   if(shift<0)
      return false;
After that, download the necessary quote history and prepare auxiliary variables.
   MqlRates rates[];
   int total=CopyRates(symbol,e_ConfirmationTF,0,shift+1,rates);
   if(total<=0)
      return false;
//---
   signal=0;
   sl=tp1=tp2=-1;
   bool up_trend=C_Trends.IsHigh(s_EndTrend);
   int shift1=iBarShift(symbol,e_ConfirmationTF,s_EndCorrection.TimeStartBar,true);
   int shift2=iBarShift(symbol,e_ConfirmationTF,s_StartRShoulder.TimeStartBar,true);
   if(shift1<=0 || shift2<=0)
      return false;
   double koef=(s_StartRShoulder.Price-s_EndCorrection.Price)/(shift1-shift2);
   bool break_neck=false;
Further in the loop, look for the neckline breakthrough with the subsequent price adjustment. Define potential take profit levels during the neckline breakthrough. When searching for the price roll-back to the neckline, check whether the price reached a potential take profit level. If the price reaches the potential take profit before rolling back to the neckline, the pattern is considered invalid, and we exit the method with the false result. When the entry point is detected, define a stop loss level and exit the method with the true result. Note that the entry point is considered valid if it was formed not earlier than the last two bars of the analyzed timeframe. Otherwise, exit the method with the false result.
   for(int i=0;i<total;i++)
     {
      if(up_trend)
        {
         if((tp1>0 && rates[i].low<=tp1) || rates[i].high>s_HeadExtremum.Price)
            return false;
         double neck=koef*(shift2-shift-i)+s_StartRShoulder.Price;
         if(!break_neck)
           {
            if(rates[i].close>neck)
               continue;
            break_neck=true;
            tp1=neck-(s_HeadExtremum.Price-neck)*0.9;
            tp2=neck-(neck-s_StartTrend.Price)*0.9;
            tp1=fmax(tp1,tp2);
            continue;
           }
         if(rates[i].high>neck)
           {
            if(sl==-1)
               sl=rates[i].high;
            else
               sl=fmax(sl,rates[i].high);
           }
         if(rates[i].close>neck || sl==-1)
            continue;
         if((total-i)>2)
            return false;
//---
         signal=-1;
         break;
        }
      else
        {
         if((tp1>0 && rates[i].high>=tp1) || rates[i].low<s_HeadExtremum.Price)
            return false;
         double neck=koef*(shift2-shift-i)+s_StartRShoulder.Price;
         if(!break_neck)
           {
            if(rates[i].close<neck)
               continue;
            break_neck=true;
            tp1=neck+(neck-s_HeadExtremum.Price)*0.9;
            tp2=neck+(s_StartTrend.Price-neck)*0.9;
            tp1=fmin(tp1,tp2);
            continue;
           }
         if(rates[i].low<neck)
           {
            if(sl==-1)
               sl=rates[i].low;
            else
               sl=fmin(sl,rates[i].low);
           }
         if(rates[i].close<neck || sl==-1)
            continue;
         if((total-i)>2)
            return false;
//---
         signal=1;
         break;
        }
     }
//---
   return true;
  }
The full code of all methods and functions is provided in the attachment.
The EA code for testing the strategy is taken from the article [1] almost unchanged. The only changes concerned replacing the class for working with the pattern. The full EA code can be found in the attachment.
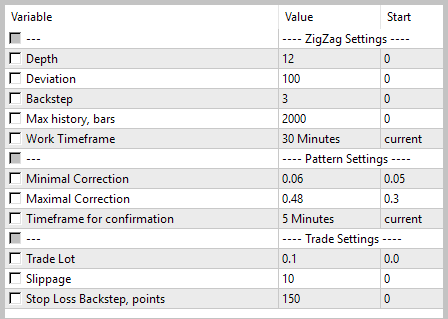
The EA was tested on the period of 10 months of 2018. The test parameters are provided on the screenshots below.

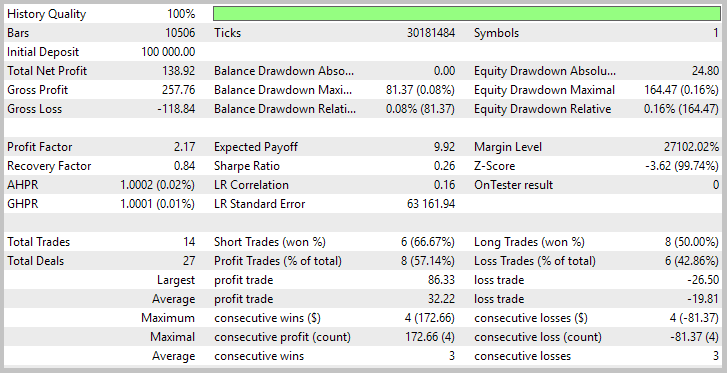
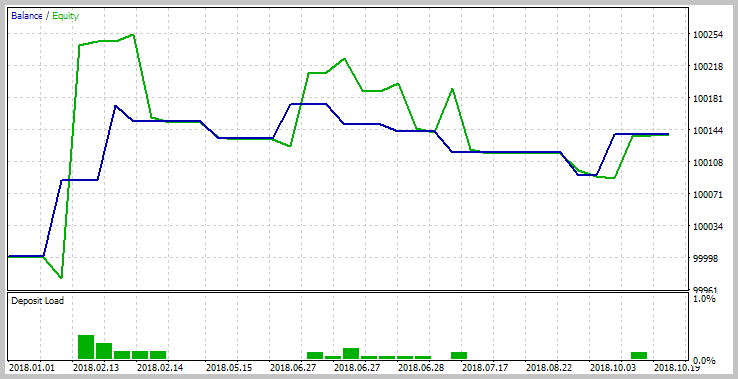
The tests demonstrated the EA's ability to generate profit on the analyzed time interval. More than 57% of trades were closed with profit with the profit factor of 2.17. However, the amount of trades is uninspiring – only 14 trades within 10 months.
4. Combining two patterns into a single EA
As a result of the work carried out in the two articles, we received two profitable EAs working on reversal graphical patterns. It is quite natural that, in order to increase the overall efficiency of trading, it would be reasonable to combine both strategies into one trading program. As I have already mentioned, the new pattern searching class we have developed is derived from the previous one. This greatly simplifies our work on combining strategies into a single EA.
First, let's identify the classes. The base CObject class contains the Type virtual method. Let's add it to the description of our classes. In the CPattern class, this method will return the value of 101, while in the CHS_Pattern class, it returns 102. At the moment, we use only two patterns, so we can restrict ourselves to numerical constants. When increasing the number of patterns, I would recommend using enumerations to improve the code readability.
After that, supplement the class comparing method by the block for comparing the class types. As a result, the method code looks as follows.
int CPattern::Compare(const CPattern *node,const int mode=0) const
  {
   if(Type()>node.Type())
      return -1;
   else
      if(Type()<node.Type())
         return 1;
//---
   if(s_StartTrend.TimeStartBar>node.StartTrend().TimeStartBar)
      return -1;
   else
      if(s_StartTrend.TimeStartBar<node.StartTrend().TimeStartBar)
         return 1;
//---
   if(s_StartCorrection.TimeStartBar>node.StartCorrection().TimeStartBar)
      return -1;
   else
      if(s_StartCorrection.TimeStartBar<node.StartCorrection().TimeStartBar)
         return 1;
//---
   if(s_EndCorrection.TimeStartBar>node.EndCorrection().TimeStartBar)
      return -1;
   else
      if(s_EndCorrection.TimeStartBar<node.EndCorrection().TimeStartBar)
         return 1;
//---
   return 0;
  }
This completes the class code change. Now, let's finalize the EA code. Here we will have some additions as well. First, let's develop the function that creates a new instance of the appropriate class depending on an obtained parameter. The code of the function is quite simple and consists only in using the switch calling a required class creation method.
CPattern *NewClass(int type)
  {
   switch(type)
     {
      case 0:
        return new CPattern();
        break;
      case 1:
        return new CHS_Pattern();
        break;
     }
//---
   return NULL;
  }
The following changes will be made to the OnTick function. They have to do only with the new patterns searching block. The block searching for market entry points in the already found patterns requires no changes due to class inheritance.
Here we arrange the loop to consistently search for the patterns of one type and then of another on history. To do this, enable calling the function that has just been added in the new class instance creation points. The loop's current pass index is sent to it in the parameters. The EA operation algorithm remains unchanged.
void OnTick()
  {
//---
.........................
.........................
.........................
//---
   for(int pat=0;pat<2;pat++)
     {
      Pattern=NewClass(pat);
      if(CheckPointer(Pattern)==POINTER_INVALID)
         return;
      if(!Pattern.Create(ar_Objects.At(1),d_MinCorrection,d_MaxCorrection))
        {
         delete Pattern;
         continue;
        }
//---
      datetime ss=start_search;
      while(!IsStopped() && Pattern.Search(ss))
        {
         ss=fmax(ss,Pattern.EndTrendTime()+PeriodSeconds(e_TimeFrame));
         bool found=false;
         for(int i=2;i<ar_Objects.Total();i++)
           {
            CPattern *temp=ar_Objects.At(i);
            if(Pattern.Compare(temp,0)==0)
              {
               found=true;
               break;
              }
           }
         if(found)
            continue;
         if(!CheckPattern(Pattern))
            continue;
         if(!ar_Objects.Add(Pattern))
            continue;
         Pattern=NewClass(pat);
         if(CheckPointer(Pattern)==POINTER_INVALID)
            break;
         if(!Pattern.Create(ar_Objects.At(1),d_MinCorrection,d_MaxCorrection))
           {
            delete Pattern;
            break;
           }
        }
      if(CheckPointer(Pattern)!=POINTER_INVALID)
         delete Pattern;
     }
//---
   return;
  }
This completes the EA code changes. Find the full EA code in the attached TwoPatterns.mq5 file.
After making the necessary changes, we will conduct the test with the same parameters.

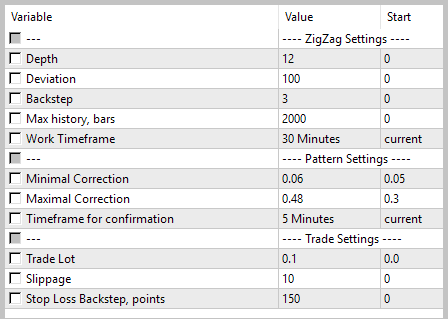
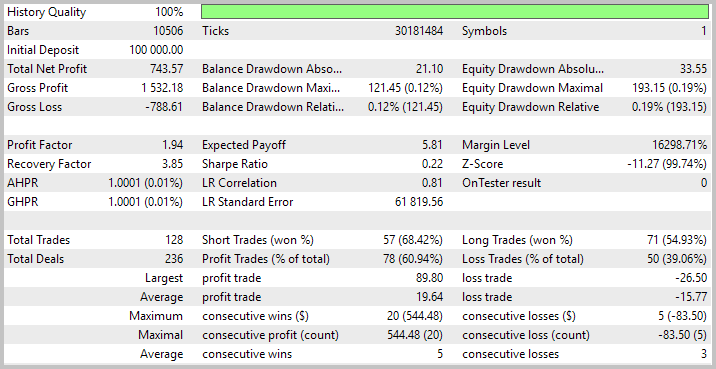
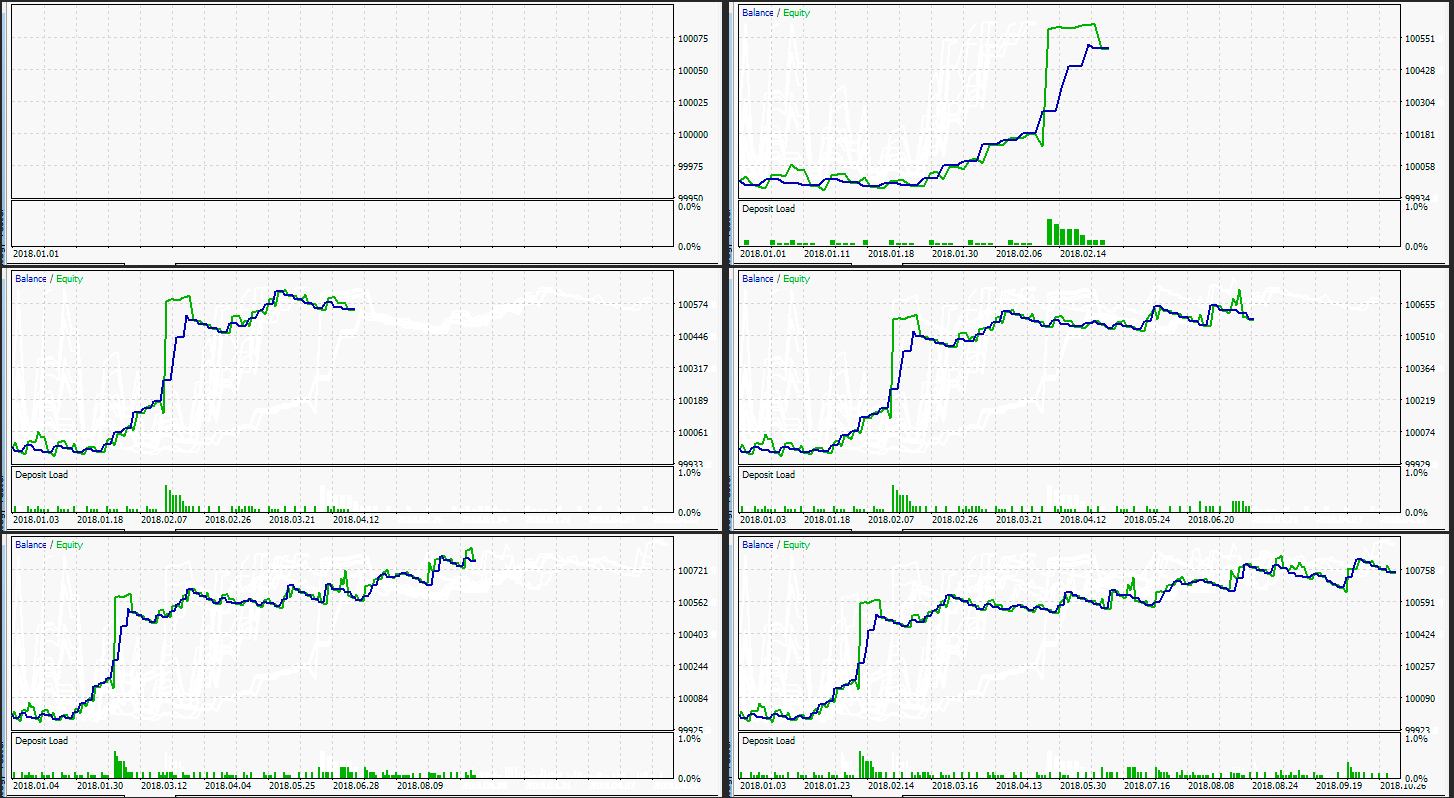
The test results show how the strategies complement each other. The EA performed 128 trades (60% of which were profitable) within the test period. As a result, the EA profit factor comprised 1.94, while the recovery factor was 3.85. The full test results are displayed on the screenshots below.
5. Testing the trading system
In order to test the operation stability of the trading system, we have tested it on 6 major symbols without changing the test parameters.
| Symbol | Profit | Profit factor |
|---|---|---|
| EURUSD | 743.57 | 1.94 |
| EURJPY | 125.13 | 1.47 |
| GBPJPY |
33.93 | 1.04 |
| EURGBP | -191.7 |
0.82 |
| GBPUSD | -371.05 | 0.60 |
| USDJPY |
-657.38 | 0.31 |
As seen from the table results above, the EA was profitable on the half of the tested symbols, while others showed losses. This fact confirms once again that the price chart of each symbol requires an individual approach, and before using the EA, it is necessary to optimize it for specific conditions. For example, optimizing the Stop Loss Backstep allowed to increase profit on four and decrease losses on two symbols. This increased the overall profitability of the symbol basket. The results are displayed in the table below.
| Symbol | Profit | Profit factor | Stop Loss Backstep |
|---|---|---|---|
| EURUSD | 1020.28 | 1.78 | 350 |
| EURJPY | 532.54 | 1.52 | 400 |
| GBPJPY | 208.69 | 1.17 | 300 |
| EURGBP | 91.45 | 1.05 | 450 |
| GBPUSD | -315.87 | 0.55 | 100 |
| USDJPY | -453.08 | 0.33 | 100 |
6. Arranging trading signals on loss-making symbols
According to the EA test results in the previous section, there are two symbols showing negative results. These are GBPUSD and USDJPY. That may indicate the insufficient strength of the considered patterns for the trend reversal on these symbols. Steady movement towards reducing the balance leads to the idea of deals being reversed during an incoming signal.
So what are the target levels for a reverse deal and where should we set a stop loss? To answer these questions, let's see what we have got as a result of the previous test. The test demonstrated that open deals were mostly closed by stop loss. The price reached the first take profit much rarely. Therefore, by reversing a deal, we can swap the stop loss and the take profit 1.
A detailed study of the loss-making deal charts showed that channels are often formed within the price range of false signals, while in the standard graphical analysis, the channels are trend continuation patterns. Therefore, we can expect a price movement comparable with the previous one. While referring to the code of the CheckSignal method (the pattern search class), we can easily see that the scale of the previous movement is fixed by the take profit 2. All we need is to set the take profit 2 at the same distance from the current price but in another direction.
This allows us to reverse deals by changing only the EA code, rather than changing the code of the pattern search classes.
To implement such a functionality, add the ReverseTrade parameter to the EA to serve as the reverse trading function on/off flag.
input bool ReverseTrade = true; //Reverse Deals
However, a single parameter cannot change the deal opening logic. Let's make changes to the CheckPattern function. Add the temp variable to the local variables declaration block. The variable is to be used as a temporary storage when exchanging the stop loss and the take profit 1 prices.
bool CheckPattern(CPattern *pattern)
  {
   int signal=0;
   double sl=-1, tp1=-1, tp2=-1;
   if(!pattern.CheckSignal(signal,sl,tp1,tp2))
      return false;
//---
   double price=0;
   double to_close=100;
   double temp=0;
//---
Next, add ReverseTrade flag status check to the switch body. If the flag is set to false, use the old logic. When using a reverse trading, change the stop loss and the take profit 1 values. Next, re-calculate take profit values in symbol points and pass obtained values to the CLimitTakeProfit class. After successful passing of all iterations, open a deal opposite to the received signal.
//---
   switch(signal)
     {
      case 1:
        CLimitTakeProfit::Clear();
        if(!ReverseTrade)
          {
           price=SymbolInfoDouble(_Symbol,SYMBOL_ASK);
           if((tp1-price)>SymbolInfoInteger(_Symbol,SYMBOL_TRADE_STOPS_LEVEL)*_Point)
              if(CLimitTakeProfit::AddTakeProfit((uint)((tp1-price)/_Point),(fabs(tp1-tp2)>=_Point ? 50 : 100)))
                 to_close-=(fabs(tp1-tp2)>=_Point ? 50 : 100);
           if(to_close>0 && (tp2-price)>SymbolInfoInteger(_Symbol,SYMBOL_TRADE_STOPS_LEVEL)*_Point)
              if(!CLimitTakeProfit::AddTakeProfit((uint)((tp2-price)/_Point),to_close))
                 return false;
           if(Trade.Buy(d_Lot,_Symbol,price,sl-i_SL*_Point,0,NULL))
              return false;
          }
        else
          {
           price=SymbolInfoDouble(_Symbol,SYMBOL_BID);
           temp=tp1;
           tp1=sl-i_SL*_Point;
           sl=temp;
           tp1=(price-tp1)/_Point;
           tp2=(tp2-price)/_Point;
           if(tp1>SymbolInfoInteger(_Symbol,SYMBOL_TRADE_STOPS_LEVEL))
              if(CLimitTakeProfit::AddTakeProfit((uint)(tp1),((tp2-tp1)>=1? 50 : 100)))
                 to_close-=((tp2-tp1)>=1 ? 50 : 100);
           if(to_close>0 && tp2>SymbolInfoInteger(_Symbol,SYMBOL_TRADE_STOPS_LEVEL))
              if(!CLimitTakeProfit::AddTakeProfit((uint)(tp2),to_close))
                 return false;
           if(Trade.Sell(d_Lot,_Symbol,price,sl,0,NULL))
              return false;
          }
        break;
      case -1:
        CLimitTakeProfit::Clear();
        if(!ReverseTrade)
          {
           price=SymbolInfoDouble(_Symbol,SYMBOL_BID);
           if((price-tp1)>SymbolInfoInteger(_Symbol,SYMBOL_TRADE_STOPS_LEVEL)*_Point)
              if(CLimitTakeProfit::AddTakeProfit((uint)((price-tp1)/_Point),(fabs(tp1-tp2)>=_Point ? 50 : 100)))
                 to_close-=(fabs(tp1-tp2)>=_Point ? 50 : 100);
           if(to_close>0 && (price-tp2)>SymbolInfoInteger(_Symbol,SYMBOL_TRADE_STOPS_LEVEL)*_Point)
              if(!CLimitTakeProfit::AddTakeProfit((uint)((price-tp2)/_Point),to_close))
                 return false;
           if(Trade.Sell(d_Lot,_Symbol,price,sl+i_SL*_Point,0,NULL))
              return false;
          }
        else
          {
           price=SymbolInfoDouble(_Symbol,SYMBOL_ASK);
           temp=tp1;
           tp1=sl+i_SL*_Point;
           sl=temp;
           tp1=(tp1-price)/_Point;
           tp2=(price-tp2)/_Point;
           if(tp1>SymbolInfoInteger(_Symbol,SYMBOL_TRADE_STOPS_LEVEL))
              if(CLimitTakeProfit::AddTakeProfit((uint)(tp1),((tp2-tp1)>=1 ? 50 : 100)))
                 to_close-=((tp2-tp1)>=1 ? 50 : 100);
           if(to_close>0 && tp2>SymbolInfoInteger(_Symbol,SYMBOL_TRADE_STOPS_LEVEL))
              if(!CLimitTakeProfit::AddTakeProfit((uint)(tp2),to_close))
                 return false;
           if(Trade.Buy(d_Lot,_Symbol,price,sl,0,NULL))
              return false;
          }
        break;
     }
//---
   return true;
  }
This completes the EA code improvement. The complete code of all classes and the function is provided in the attachment.
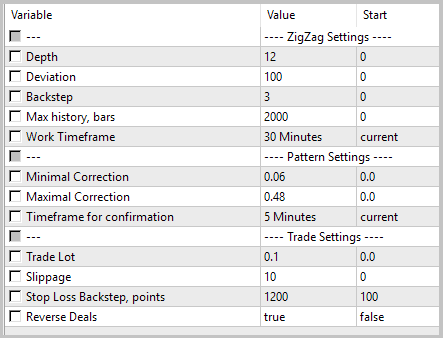
Let's test the reverse trading function. The first test is to be conducted on GBPUSD using the same time interval and timeframe. The EA parameters are provided on the screenshots below.

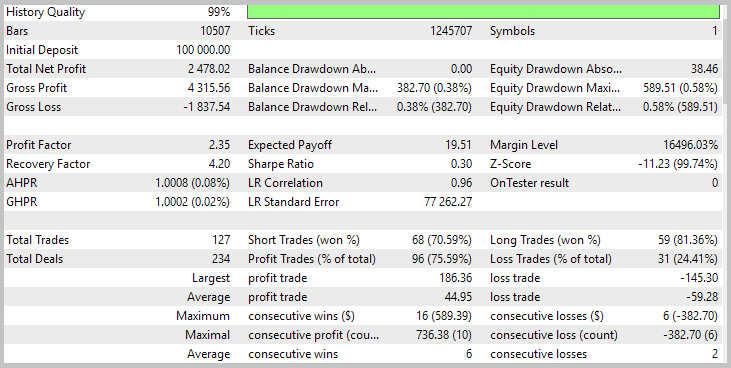
Test results showed the efficiency of the solution. On the tested time interval, the EA (with the reverse trading function enabled) showed profit. Out of 127 performed deals, 95 (75.59%) were closed with a profit. The profit factor comprised 2.35. The full test results are displayed on the screenshots below.
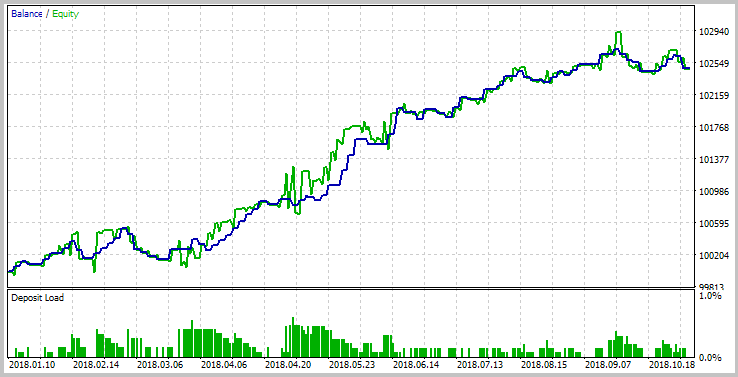
To fix the obtained result, perform a similar test on USDJPY. The test parameters are provided on the screenshots.

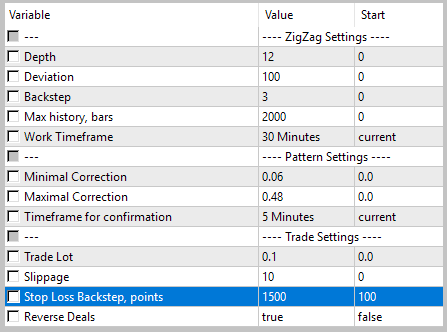
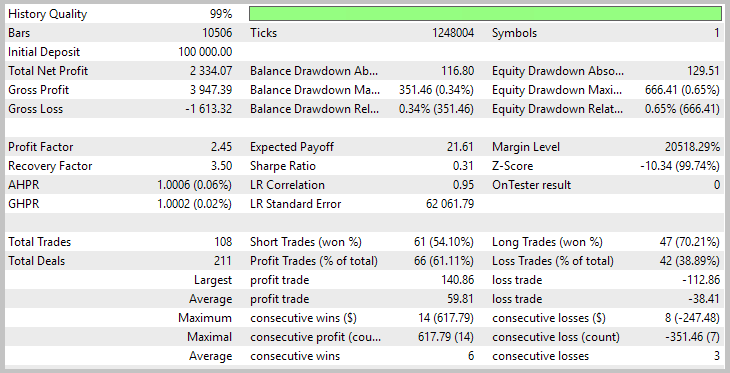
The second test of the reverse function also proved successful. Out of 108 deals, 66 (61.11%) were closed with profit, and the profit factor was 2.45. The full test results are displayed on the screenshots.
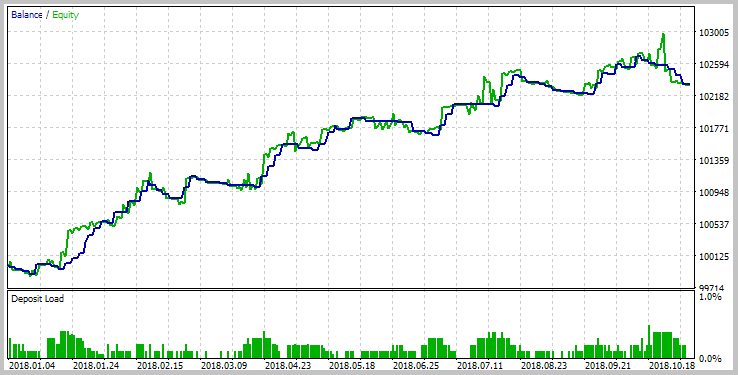
The test has shown that loss-making strategies may be turned into profitable ones thanks to position reversal. However, keep in mind that a strategy profitable on one symbol may not always be profitable on another pair.
Conclusion
The article has demonstrated the viability of strategies based on the use of standard graphical patterns. We have managed to develop the EA generating profit on various symbols over a long time period. However, when using trading strategies, we should always consider the specifics of each symbol, since a strategy may be profitable in some conditions and loss-making in other conditions. Reversing deals may sometimes improve the situation, although trading conditions should be considered.
Naturally, these are only the first steps in building a profitable trading system. The EA may be optimized based on other parameters. Besides, its functionality may be supplemented (moving a stop loss to a "breakeven", trailing stop, etc.). Of course, I would not recommend using the EA on symbols known to be loss-making.
I hope, my experience will help you develop your own trading strategy.
The EA provided in the article serves only as a demonstration of the strategy. It should be refined to be used on real markets.
References
- Reversal patterns: Testing the Double top/bottom pattern
- Using limit orders instead of Take Profit without changing the EA's original code
Programs used in the article
| # | Name | Type | Description |
|---|---|---|---|
| 1 | ZigZag.mqh | Class library | Zig Zag indicator class |
| 2 | Trends.mqh | Class library | Trend search class |
| 3 | Pattern.mqh | Class library | Class for working with Double top/bottom patterns |
| 4 | HS_Pattern | Class library | Class for working with Head and Shoulders patterns |
| 5 | LimitTakeProfit.mqh | Class library | Class for replacing order take profit with limit orders |
| 6 | Header.mqh | Library | EA headers file |
| 7 | Head-Shoulders.mq5 | Expert Advisor | EA based on Head and Shoulders strategy |
| 8 | TwoPatterns.mq5 | Expert Advisor | EA combining both patterns |
Translated from Russian by MetaQuotes Ltd.
Original article: https://www.mql5.com/ru/articles/5358
Warning: All rights to these materials are reserved by MetaQuotes Ltd. Copying or reprinting of these materials in whole or in part is prohibited.
This article was written by a user of the site and reflects their personal views. MetaQuotes Ltd is not responsible for the accuracy of the information presented, nor for any consequences resulting from the use of the solutions, strategies or recommendations described.
 Reversing: Reducing maximum drawdown and testing other markets
 Reversal patterns: Testing the Double top/bottom pattern
 Reversing: Formalizing the entry point and developing a manual trading algorithm
 Gap - a profitable strategy or 50/50?
- Free trading apps
- Over 8,000 signals for copying
- Economic news for exploring financial markets
You agree to website policy and terms of use
This is the new results for GPUUSD/M30 the same conditions with article , only the date is up to now. it is not good....
thank you Dmitriy! you are a genius and doing so much for the community!
Thanks.
Dmitriy,
this seems to have a very promising results,
any way to maybe expand on this with your RL librarys and method?
thanks
like any other EA and robots...
don't waste your money.
Forum on trading, automated trading systems and testing trading strategies
Discussion of article "Reversal patterns: Testing the Head and Shoulders pattern"
Amirmohammad Zafarani, 2020.11.01 19:51
This is the new results for GPUUSD/M30 the same conditions with article , only the date is up to now. it is not good....