
Arbitraje triangular con predicciones
Introducción
Este artículo trata sobre la estrategia de arbitraje triangular. Tiene un ejemplo de dos arbitrajes triangulares que se basan en modelos de aprendizaje profundo. Estos modelos y el EA utilizado están disponibles en los anexos del artículo. El arbitraje triangular aprovecha las discrepancias en los tipos de cambio para generar ganancias libres de riesgo.
¿Qué es el arbitraje triangular?
El arbitraje es algo muy curioso, está prohibido en las casas de apuestas deportivas. Imagina que tienes unas probabilidades de ganar de 1,25 para que el Real Madrid gane la Champions 2024, y el Borussia Dortmund tiene unas probabilidades de 3,60, eso significa que el Madrid tiene 100/1,25 = 80 % de probabilidades de ganar y el Borussia 27,7 % de ganar. Si sumas esos dos, tienes 107,7%, eso es porque las casas de apuestas quieren ganar dinero y ese 100% superior es su comisión. Pero, imagina que encuentras la casa de apuestas número 2 y te ofrece unas probabilidades de que el Borussia gane del 19%, unas probabilidades de 5,26. Luego podrías apostar en la casa de apuestas número 1 al Real Madrid y en la casa de apuestas número 2 al Borussia, y si apuestas la cantidad adecuada a cada equipo, ganarás dinero en el partido, porque ambos suman menos del 100%. Esta es una forma sencilla de explicar por qué está prohibido apostar en deportes y qué es el arbitraje.
Imagina que eres una persona "legal" y no quieres que te cierren tu cuenta deportiva haciendo arbitraje, sabes que incluso si apuestas por el Madrid, podrías hacer arbitraje "legal" si esperas al minuto 70' del partido si empata o esperas a que marque el Real Madrid para tener esas cuotas para el Borussia y tener un triunfo-ganador... esto parece un poco arriesgado, pero aquí es donde podemos sacar partido del Deep Learning, sabemos que el Real Madrid va a marcar, así que vas a tener esas cuotas con un 98% de probabilidades (esto lo sabemos con la cointegración entre las predicciones y los valores reales). Esto es lo nuevo en Deep Learning y Arbitrage.
Entonces, ahora que sabemos qué es el arbitraje y cómo ganamos más con la ayuda del Deep Learning, ¿qué es el arbitraje triangular? Bueno, es lo mismo que el arbitraje, pero utilizando tres pares. ¿Por qué? Porque se usa en Forex y criptomonedas que usan esta fórmula para un símbolo A/B, y si tienes que resolver esto necesitas tres ecuaciones (A/B) * (B/C) * (C/A), entonces cuando esto es >1 multiplicas de la manera correcta, y cuando es <1 de la manera izquierda.
¿Por qué se puede o no se puede realizar arbitraje triangular con todas las cuentas?
Si tiene una cuenta con spread cero, el arbitraje triangular se realizaría en un segundo o menos. Si tienes spread, es imposible vencer el spread en tiempos como estos. Pero, como dije antes, no os preocupéis, este EA es realmente rentable en ambos sentidos. Mi cuenta no tiene spread cero, por lo que este artículo tendrá un ejemplo con spreads.
¿Qué necesitamos para este EA?
Este EA utiliza predicciones realizadas en Python en modelos ONNX para usarlos en EA MT5. Es por eso que repasaré todo el proceso para asegurarme de que todos puedan usar este EA. Si sabes cómo hacer un modelo ONNX, puedes pasar al EA.
Tendrás que instalar por primera vez:
- Python 3.10
Puedes encontrarlo en la Tienda de Microsoft, simplemente haz clic en instalar.

- Visual Studio Code
Puedes encontrarlo en la Tienda de Microsoft, simplemente haz clic en instalar y hará todo por ti.

Después de esto, necesitas instalarVisual Studio 2019 o C++ desde aquí (se solicitará que se instale con una biblioteca de Python):
https://learn.microsoft.com/en-US/cpp/windows/latest-supported-vc-redist?view=msvc-170#visual-studio-2015-2017-2019-and-2022 Una vez hecho esto, hay que agregar la carpeta de scripts de Python a las variables de ruta. También debes agregar ".py" a PATHEXT.
Una vez hecho todo esto, ya podemos instalar las librerías, así.
Abra VSC -> Terminal -> Nuevo terminal.
Es posible que VSC le solicite que instale extensiones de Python (simplemente haga clic en Aceptar). Y simplemente copia y pega esto (y presiona Enter):
pip install MetaTrader5==5.0.4200
pip install pandas==2.2.1
pip install scipy==1.12.0
pip install statsmodels==0.14.1
pip install numpy==1.26.4
pip install tensorflow==2.15.0
pip install tf2onnx==1.16.1
pip install scikit-learn==1.4.1.post1
pip install keras==2.15.0
pip install matplotlib==3.8.3
No debería haber ningún error, si no, puedes preguntar aquí.
Una vez que todas las partes necesarias estén instaladas y no tengan errores, podemos proceder al modelo de prueba .py. Copiaré y pegaré este ejemplo:
# python libraries
import MetaTrader5 as mt5
import tensorflow as tf
import numpy as np
import pandas as pd
import tf2onnx
from datetime import timedelta, datetime
# input parameters

symbol1 = "EURGBP"
symbol2 = "GBPUSD"
symbol3 = "EURUSD"
sample_size1 = 200000
optional = "_M1_test"
timeframe = mt5.TIMEFRAME_M1

#end_date = datetime.now()
end_date = datetime(2024, 3, 4, 0)

inp_history_size = 120

sample_size = sample_size1
symbol = symbol1
optional = optional
inp_model_name = str(symbol)+"_"+str(optional)+".onnx"

if not mt5.initialize():
    print("initialize() failed, error code =",mt5.last_error())
    quit()

# we will save generated onnx-file near our script to use as resource
from sys import argv
data_path=argv[0]
last_index=data_path.rfind("\\")+1
data_path=data_path[0:last_index]
print("data path to save onnx model",data_path)

# and save to MQL5\Files folder to use as file
terminal_info=mt5.terminal_info()
file_path=terminal_info.data_path+"\\MQL5\\Files\\"
print("file path to save onnx model",file_path)

# set start and end dates for history data

#end_date = datetime.now()
#end_date = datetime(2024, 5, 1, 0)
start_date = end_date - timedelta(days=inp_history_size*20)

# print start and end dates
print("data start date =",start_date)
print("data end date =",end_date)

# get rates
eurusd_rates = mt5.copy_rates_from(symbol, timeframe , end_date, sample_size )

# create dataframe
df=pd.DataFrame()
df = pd.DataFrame(eurusd_rates)
print(df)
# Extraer los precios de cierre directamente
datas = df['close'].values

"""# Calcular la inversa de cada valor
inverted_data = 1 / datas

# Convertir los datos invertidos a un array de numpy si es necesario
data = inverted_data.values"""

data = datas.reshape(-1,1)
# Imprimir los resultados
"""data = datas"""
# scale data
from sklearn.preprocessing import MinMaxScaler
scaler=MinMaxScaler(feature_range=(0,1))
scaled_data = scaler.fit_transform(data)

# training size is 80% of the data
training_size = int(len(scaled_data)*0.80)
print("Training_size:",training_size)
train_data_initial = scaled_data[0:training_size,:]
test_data_initial = scaled_data[training_size:,:1]

# split a univariate sequence into samples
def split_sequence(sequence, n_steps):
    X, y = list(), list()
    for i in range(len(sequence)):
       # find the end of this pattern
       end_ix = i + n_steps
       # check if we are beyond the sequence
       if end_ix > len(sequence)-1:
          break
       # gather input and output parts of the pattern
       seq_x, seq_y = sequence[i:end_ix], sequence[end_ix]
       X.append(seq_x)
       y.append(seq_y)
    return np.array(X), np.array(y)

# split into samples
time_step = inp_history_size
x_train, y_train = split_sequence(train_data_initial, time_step)
x_test, y_test = split_sequence(test_data_initial, time_step)

# reshape input to be [samples, time steps, features] which is required for LSTM
x_train =x_train.reshape(x_train.shape[0],x_train.shape[1],1)
x_test = x_test.reshape(x_test.shape[0],x_test.shape[1],1)


# define model
from keras.models import Sequential
from keras.layers import Dense, Activation, Conv1D, MaxPooling1D, Dropout, Flatten, LSTM
from keras.metrics import RootMeanSquaredError as rmse
from tensorflow.keras import callbacks
model = Sequential()
model.add(Conv1D(filters=256, kernel_size=2, activation='relu',padding = 'same',input_shape=(inp_history_size,1)))
model.add(MaxPooling1D(pool_size=2))
model.add(LSTM(100, return_sequences = True))
model.add(Dropout(0.3))
model.add(LSTM(100, return_sequences = False))
model.add(Dropout(0.3))
model.add(Dense(units=1, activation = 'sigmoid'))
model.compile(optimizer='adam', loss= 'mse' , metrics = [rmse()])

# Set up early stopping
early_stopping = callbacks.EarlyStopping(
    monitor='val_loss',
    patience=5,
    restore_best_weights=True,
)

# model training for 300 epochs
history = model.fit(x_train, y_train, epochs = 300 , validation_data = (x_test,y_test), batch_size=32, callbacks=[early_stopping], verbose=2)

# evaluate training data
train_loss, train_rmse = model.evaluate(x_train,y_train, batch_size = 32)
print(f"train_loss={train_loss:.3f}")
print(f"train_rmse={train_rmse:.3f}")

# evaluate testing data
test_loss, test_rmse = model.evaluate(x_test,y_test, batch_size = 32)
print(f"test_loss={test_loss:.3f}")
print(f"test_rmse={test_rmse:.3f}")

# save model to ONNX
output_path = data_path+inp_model_name
onnx_model = tf2onnx.convert.from_keras(model, output_path=output_path)
print(f"saved model to {output_path}")

output_path = file_path+inp_model_name
onnx_model = tf2onnx.convert.from_keras(model, output_path=output_path)
print(f"saved model to {output_path}")

# finish
mt5.shutdown()
#prediction using testing data

#prediction using testing data
test_predict = model.predict(x_test)
print(test_predict)
print("longitud total de la prediccion: ", len(test_predict))
print("longitud total del sample: ", sample_size)

plot_y_test = np.array(y_test).reshape(-1, 1)  # Selecciona solo el último elemento de cada muestra de prueba
plot_y_train = y_train.reshape(-1,1)
train_predict = model.predict(x_train)
#print(plot_y_test)

#calculate metrics
from sklearn import metrics
from sklearn.metrics import r2_score
#transform data to real values
value1=scaler.inverse_transform(plot_y_test)
#print(value1)
# Escala las predicciones inversas al transformarlas a la escala original
value2 = scaler.inverse_transform(test_predict.reshape(-1, 1))
#print(value2)
#calc score
score = np.sqrt(metrics.mean_squared_error(value1,value2))

print("RMSE         : {}".format(score))
print("MSE          :", metrics.mean_squared_error(value1,value2))
print("R2 score     :",metrics.r2_score(value1,value2))


#sumarize model
model.summary()

#Print error
value11=pd.DataFrame(value1)
value22=pd.DataFrame(value2)
#print(value11)
#print(value22)


value111=value11.iloc[:,:]
value222=value22.iloc[:,:]

print("longitud salida (tandas de 1 minuto): ",len(value111) )
#print("en horas son " + str((len(value111))*60*24)+ " minutos")
print("en horas son " + str(((len(value111)))/60)+ " horas")
print("en horas son " + str(((len(value111)))/60/24)+ " dias")


# Calculate error
error = value111 - value222

import matplotlib.pyplot as plt
# Plot error
plt.figure(figsize=(10, 6))
plt.scatter(range(len(error)), error, color='blue', label='Error')
plt.axhline(y=0, color='red', linestyle='--', linewidth=1)  # Línea horizontal en y=0
plt.title('Error de Predicción ' + str(symbol))
plt.xlabel('Índice de la muestra')
plt.ylabel('Error')
plt.legend()
plt.grid(True)
plt.savefig(str(symbol)+str(optional)+'.png')

rmse_ = format(score)
mse_ = metrics.mean_squared_error(value1,value2)
r2_ = metrics.r2_score(value1,value2)

resultados= [rmse_,mse_,r2_]

# Abre un archivo en modo escritura
with open(str(symbol)+str(optional)+"results.txt", "w") as archivo:
    # Escribe cada resultado en una línea separada
    for resultado in resultados:
        archivo.write(str(resultado) + "\n")

# finish
mt5.shutdown()

#show iteration-rmse graph for training and validation
plt.figure(figsize = (18,10))
plt.plot(history.history['root_mean_squared_error'],label='Training RMSE',color='b')
plt.plot(history.history['val_root_mean_squared_error'],label='Validation-RMSE',color='g')
plt.xlabel("Iteration")
plt.ylabel("RMSE")
plt.title("RMSE" + str(symbol))
plt.legend()
plt.savefig(str(symbol)+str(optional)+'1.png')

#show iteration-loss graph for training and validation
plt.figure(figsize = (18,10))
plt.plot(history.history['loss'],label='Training Loss',color='b')
plt.plot(history.history['val_loss'],label='Validation-loss',color='g')
plt.xlabel("Iteration")
plt.ylabel("Loss")
plt.title("LOSS" + str(symbol))
plt.legend()
plt.savefig(str(symbol)+str(optional)+'2.png')

#show actual vs predicted (training) graph
plt.figure(figsize=(18,10))
plt.plot(scaler.inverse_transform(plot_y_train),color = 'b', label = 'Original')
plt.plot(scaler.inverse_transform(train_predict),color='red', label = 'Predicted')
plt.title("Prediction Graph Using Training Data" + str(symbol))
plt.xlabel("Hours")
plt.ylabel("Price")
plt.legend()
plt.savefig(str(symbol)+str(optional)+'3.png')

#show actual vs predicted (testing) graph
plt.figure(figsize=(18,10))
plt.plot(scaler.inverse_transform(plot_y_test),color = 'b',  label = 'Original')
plt.plot(scaler.inverse_transform(test_predict),color='g', label = 'Predicted')
plt.title("Prediction Graph Using Testing Data" + str(symbol))
plt.xlabel("Hours")
plt.ylabel("Price")
plt.legend()
plt.savefig(str(symbol)+str(optional)+'4.png')


################################################################################################ EURJPY 1


# python libraries
import MetaTrader5 as mt5
import tensorflow as tf
import numpy as np
import pandas as pd
import tf2onnx

# input parameters

inp_history_size = 120

sample_size = sample_size1
symbol = symbol2
optional = optional
inp_model_name = str(symbol)+"_"+str(optional)+".onnx"

if not mt5.initialize():
    print("initialize() failed, error code =",mt5.last_error())
    quit()

# we will save generated onnx-file near our script to use as resource
from sys import argv
data_path=argv[0]
last_index=data_path.rfind("\\")+1
data_path=data_path[0:last_index]
print("data path to save onnx model",data_path)

# and save to MQL5\Files folder to use as file
terminal_info=mt5.terminal_info()
file_path=terminal_info.data_path+"\\MQL5\\Files\\"
print("file path to save onnx model",file_path)

# set start and end dates for history data
from datetime import timedelta, datetime
#end_date = datetime.now()
#end_date = datetime(2024, 5, 1, 0)
start_date = end_date - timedelta(days=inp_history_size*20)

# print start and end dates
print("data start date =",start_date)
print("data end date =",end_date)

# get rates
eurusd_rates2 = mt5.copy_rates_from(symbol, timeframe ,  end_date, sample_size)
# create dataframe
df=pd.DataFrame()
df2 = pd.DataFrame(eurusd_rates2)
print(df2)
# Extraer los precios de cierre directamente
datas2 = df2['close'].values

"""inverted_data = 1 / datas

# Convertir los datos invertidos a un array de numpy si es necesario
data = inverted_data.values"""
data2 = datas2.reshape(-1,1)


# Convertir los datos invertidos a un array de numpy si es necesario
#data = datas.values

# Imprimir los resultados

# scale data
from sklearn.preprocessing import MinMaxScaler
scaler2=MinMaxScaler(feature_range=(0,1))
scaled_data2 = scaler2.fit_transform(data2)

# training size is 80% of the data
training_size2 = int(len(scaled_data2)*0.80)
print("Training_size:",training_size2)
train_data_initial2 = scaled_data2[0:training_size2,:]
test_data_initial2 = scaled_data2[training_size2:,:1]

# split a univariate sequence into samples
def split_sequence(sequence, n_steps):
    X, y = list(), list()
    for i in range(len(sequence)):
       # find the end of this pattern
       end_ix = i + n_steps
       # check if we are beyond the sequence
       if end_ix > len(sequence)-1:
          break
       # gather input and output parts of the pattern
       seq_x, seq_y = sequence[i:end_ix], sequence[end_ix]
       X.append(seq_x)
       y.append(seq_y)
    return np.array(X), np.array(y)

# split into samples
time_step = inp_history_size
x_train2, y_train2 = split_sequence(train_data_initial2, time_step)
x_test2, y_test2 = split_sequence(test_data_initial2, time_step)

# reshape input to be [samples, time steps, features] which is required for LSTM
x_train2 =x_train2.reshape(x_train2.shape[0],x_train2.shape[1],1)
x_test2 = x_test2.reshape(x_test2.shape[0],x_test2.shape[1],1)


# define model
from keras.models import Sequential
from keras.layers import Dense, Activation, Conv1D, MaxPooling1D, Dropout, Flatten, LSTM
from keras.metrics import RootMeanSquaredError as rmse
from tensorflow.keras import callbacks
model = Sequential()
model.add(Conv1D(filters=256, kernel_size=2, activation='relu',padding = 'same',input_shape=(inp_history_size,1)))
model.add(MaxPooling1D(pool_size=2))
model.add(LSTM(100, return_sequences = True))
model.add(Dropout(0.3))
model.add(LSTM(100, return_sequences = False))
model.add(Dropout(0.3))
model.add(Dense(units=1, activation = 'sigmoid'))
model.compile(optimizer='adam', loss= 'mse' , metrics = [rmse()])

# Set up early stopping
early_stopping = callbacks.EarlyStopping(
    monitor='val_loss',
    patience=5,
    restore_best_weights=True,
)

# model training for 300 epochs
history2 = model.fit(x_train2, y_train2, epochs = 300 , validation_data = (x_test2,y_test2), batch_size=32, callbacks=[early_stopping], verbose=2)

# evaluate training data
train_loss2, train_rmse2 = model.evaluate(x_train2,y_train2, batch_size = 32)
print(f"train_loss={train_loss2:.3f}")
print(f"train_rmse={train_rmse2:.3f}")

# evaluate testing data
test_loss2, test_rmse2 = model.evaluate(x_test2,y_test2, batch_size = 32)
print(f"test_loss={test_loss2:.3f}")
print(f"test_rmse={test_rmse2:.3f}")

# save model to ONNX
output_path = data_path+inp_model_name
onnx_model = tf2onnx.convert.from_keras(model, output_path=output_path)
print(f"saved model to {output_path}")

output_path = file_path+inp_model_name
onnx_model = tf2onnx.convert.from_keras(model, output_path=output_path)
print(f"saved model to {output_path}")

# finish
mt5.shutdown()
#prediction using testing data

#prediction using testing data
test_predict2 = model.predict(x_test2)
print(test_predict2)
print("longitud total de la prediccion: ", len(test_predict2))
print("longitud total del sample: ", sample_size)

plot_y_test2 = np.array(y_test2).reshape(-1, 1)  # Selecciona solo el último elemento de cada muestra de prueba
plot_y_train2 = y_train2.reshape(-1,1)
train_predict2 = model.predict(x_train2)
#print(plot_y_test)

#calculate metrics
from sklearn import metrics
from sklearn.metrics import r2_score
#transform data to real values
value12=scaler2.inverse_transform(plot_y_test2)
#print(value1)
# Escala las predicciones inversas al transformarlas a la escala original
value22 = scaler2.inverse_transform(test_predict2.reshape(-1, 1))
#print(value2)
#calc score
score2 = np.sqrt(metrics.mean_squared_error(value12,value22))

print("RMSE         : {}".format(score2))
print("MSE          :", metrics.mean_squared_error(value12,value22))
print("R2 score     :",metrics.r2_score(value12,value22))


#sumarize model
model.summary()

#Print error
value112=pd.DataFrame(value12)
value222=pd.DataFrame(value22)
#print(value11)
#print(value22)


value1112=value112.iloc[:,:]
value2222=value222.iloc[:,:]

print("longitud salida (tandas de 1 min): ",len(value1112) )
#print("en horas son " + str((len(value1112))*60*24)+ " minutos")
print("en horas son " + str(((len(value1112)))/60)+ " horas")
print("en horas son " + str(((len(value1112)))/60/24)+ " dias")


# Calculate error
error2 = value1112 - value2222

import matplotlib.pyplot as plt
# Plot error
plt.figure(figsize=(10, 6))
plt.scatter(range(len(error2)), error2, color='blue', label='Error')
plt.axhline(y=0, color='red', linestyle='--', linewidth=1)  # Línea horizontal en y=0
plt.title('Error de Predicción ' + str(symbol))
plt.xlabel('Índice de la muestra')
plt.ylabel('Error')
plt.legend()
plt.grid(True)
plt.savefig(str(symbol)+str(optional)+'.png')

rmse_2 = format(score2)
mse_2 = metrics.mean_squared_error(value12,value22)
r2_2 = metrics.r2_score(value12,value22)

resultados2= [rmse_2,mse_2,r2_2]

# Abre un archivo en modo escritura
with open(str(symbol)+str(optional)+"results.txt", "w") as archivo:
    # Escribe cada resultado en una línea separada
    for resultado in resultados2:
        archivo.write(str(resultado) + "\n")

# finish
mt5.shutdown()

#show iteration-rmse graph for training and validation
plt.figure(figsize = (18,10))
plt.plot(history2.history['root_mean_squared_error'],label='Training RMSE',color='b')
plt.plot(history2.history['val_root_mean_squared_error'],label='Validation-RMSE',color='g')
plt.xlabel("Iteration")
plt.ylabel("RMSE")
plt.title("RMSE" + str(symbol))
plt.legend()
plt.savefig(str(symbol)+str(optional)+'1.png')

#show iteration-loss graph for training and validation
plt.figure(figsize = (18,10))
plt.plot(history2.history['loss'],label='Training Loss',color='b')
plt.plot(history2.history['val_loss'],label='Validation-loss',color='g')
plt.xlabel("Iteration")
plt.ylabel("Loss")
plt.title("LOSS" + str(symbol))
plt.legend()
plt.savefig(str(symbol)+str(optional)+'2.png')

#show actual vs predicted (training) graph
plt.figure(figsize=(18,10))
plt.plot(scaler2.inverse_transform(plot_y_train2),color = 'b', label = 'Original')
plt.plot(scaler2.inverse_transform(train_predict2),color='red', label = 'Predicted')
plt.title("Prediction Graph Using Training Data" + str(symbol))
plt.xlabel("Hours")
plt.ylabel("Price")
plt.legend()
plt.savefig(str(symbol)+str(optional)+'3.png')

#show actual vs predicted (testing) graph
plt.figure(figsize=(18,10))
plt.plot(scaler2.inverse_transform(plot_y_test2),color = 'b',  label = 'Original')
plt.plot(scaler2.inverse_transform(test_predict2),color='g', label = 'Predicted')
plt.title("Prediction Graph Using Testing Data" + str(symbol))
plt.xlabel("Hours")
plt.ylabel("Price")
plt.legend()
plt.savefig(str(symbol)+str(optional)+'4.png')


##############################################################################################  JPYUSD


# python libraries
import MetaTrader5 as mt5
import tensorflow as tf
import numpy as np
import pandas as pd
import tf2onnx

# input parameters

inp_history_size = 120

sample_size = sample_size1
symbol = symbol3
optional = optional
inp_model_name = str(symbol)+"_"+str(optional)+".onnx"

if not mt5.initialize():
    print("initialize() failed, error code =",mt5.last_error())
    quit()

# we will save generated onnx-file near our script to use as resource
from sys import argv
data_path=argv[0]
last_index=data_path.rfind("\\")+1
data_path=data_path[0:last_index]
print("data path to save onnx model",data_path)

# and save to MQL5\Files folder to use as file
terminal_info=mt5.terminal_info()
file_path=terminal_info.data_path+"\\MQL5\\Files\\"
print("file path to save onnx model",file_path)

# set start and end dates for history data
from datetime import timedelta, datetime
#end_date = datetime.now()
#end_date = datetime(2024, 5, 1, 0)
start_date = end_date - timedelta(days=inp_history_size*20)

# print start and end dates
print("data start date =",start_date)
print("data end date =",end_date)

# get rates
eurusd_rates3 = mt5.copy_rates_from(symbol, timeframe ,  end_date, sample_size)
# create dataframe
df3=pd.DataFrame()
df3 = pd.DataFrame(eurusd_rates3)
print(df3)
# Extraer los precios de cierre directamente
datas3 = df3['close'].values

"""# Calcular la inversa de cada valor
inverted_data = 1 / datas

# Convertir los datos invertidos a un array de numpy si es necesario
data = inverted_data.values"""
data3 = datas3.reshape(-1,1)
# Imprimir los resultados
"""data = datas"""
# scale data
from sklearn.preprocessing import MinMaxScaler
scaler3=MinMaxScaler(feature_range=(0,1))
scaled_data3 = scaler3.fit_transform(data3)

# training size is 80% of the data
training_size3 = int(len(scaled_data3)*0.80)
print("Training_size:",training_size3)
train_data_initial3 = scaled_data3[0:training_size3,:]
test_data_initial3 = scaled_data3[training_size3:,:1]

# split a univariate sequence into samples
def split_sequence(sequence, n_steps):
    X, y = list(), list()
    for i in range(len(sequence)):
       # find the end of this pattern
       end_ix = i + n_steps
       # check if we are beyond the sequence
       if end_ix > len(sequence)-1:
          break
       # gather input and output parts of the pattern
       seq_x, seq_y = sequence[i:end_ix], sequence[end_ix]
       X.append(seq_x)
       y.append(seq_y)
    return np.array(X), np.array(y)

# split into samples
time_step = inp_history_size
x_train3, y_train3 = split_sequence(train_data_initial3, time_step)
x_test3, y_test3 = split_sequence(test_data_initial3, time_step)

# reshape input to be [samples, time steps, features] which is required for LSTM
x_train3 =x_train3.reshape(x_train3.shape[0],x_train3.shape[1],1)
x_test3 = x_test3.reshape(x_test3.shape[0],x_test3.shape[1],1)


# define model
from keras.models import Sequential
from keras.layers import Dense, Activation, Conv1D, MaxPooling1D, Dropout, Flatten, LSTM
from keras.metrics import RootMeanSquaredError as rmse
from tensorflow.keras import callbacks
model = Sequential()
model.add(Conv1D(filters=256, kernel_size=2, activation='relu',padding = 'same',input_shape=(inp_history_size,1)))
model.add(MaxPooling1D(pool_size=2))
model.add(LSTM(100, return_sequences = True))
model.add(Dropout(0.3))
model.add(LSTM(100, return_sequences = False))
model.add(Dropout(0.3))
model.add(Dense(units=1, activation = 'sigmoid'))
model.compile(optimizer='adam', loss= 'mse' , metrics = [rmse()])

# Set up early stopping
early_stopping = callbacks.EarlyStopping(
    monitor='val_loss',
    patience=5,
    restore_best_weights=True,
)

# model training for 300 epochs
history3 = model.fit(x_train3, y_train3, epochs = 300 , validation_data = (x_test3,y_test3), batch_size=32, callbacks=[early_stopping], verbose=2)

# evaluate training data
train_loss3, train_rmse3 = model.evaluate(x_train3,y_train3, batch_size = 32)
print(f"train_loss={train_loss3:.3f}")
print(f"train_rmse={train_rmse3:.3f}")

# evaluate testing data
test_loss3, test_rmse3 = model.evaluate(x_test3,y_test3, batch_size = 32)
print(f"test_loss={test_loss3:.3f}")
print(f"test_rmse={test_rmse3:.3f}")

# save model to ONNX
output_path = data_path+inp_model_name
onnx_model = tf2onnx.convert.from_keras(model, output_path=output_path)
print(f"saved model to {output_path}")

output_path = file_path+inp_model_name
onnx_model = tf2onnx.convert.from_keras(model, output_path=output_path)
print(f"saved model to {output_path}")

# finish
mt5.shutdown()
#prediction using testing data

#prediction using testing data
test_predict3 = model.predict(x_test3)
print(test_predict3)
print("longitud total de la prediccion: ", len(test_predict3))
print("longitud total del sample: ", sample_size)

plot_y_test3 = np.array(y_test3).reshape(-1, 1)  # Selecciona solo el último elemento de cada muestra de prueba
plot_y_train3 = y_train3.reshape(-1,1)
train_predict3 = model.predict(x_train3)
#print(plot_y_test)

#calculate metrics
from sklearn import metrics
from sklearn.metrics import r2_score
#transform data to real values
value13=scaler3.inverse_transform(plot_y_test3)
#print(value1)
# Escala las predicciones inversas al transformarlas a la escala original
value23 = scaler3.inverse_transform(test_predict3.reshape(-1, 1))
#print(value2)
#calc score
score3 = np.sqrt(metrics.mean_squared_error(value13,value23))

print("RMSE         : {}".format(score3))
print("MSE          :", metrics.mean_squared_error(value13,value23))
print("R2 score     :",metrics.r2_score(value13,value23))


#sumarize model
model.summary()

#Print error
value113=pd.DataFrame(value13)
value223=pd.DataFrame(value23)
#print(value11)
#print(value22)


value1113=value113.iloc[:,:]
value2223=value223.iloc[:,:]

print("longitud salida (tandas de 1 hora): ",len(value1113) )
#print("en horas son " + str((len(value1113))*60*24)+ " minutos")
print("en horas son " + str(((len(value1113)))/60)+ " horas")
print("en horas son " + str(((len(value1113)))/60/24)+ " dias")


# Calculate error
error3 = value1113 - value2223

import matplotlib.pyplot as plt
# Plot error
plt.figure(figsize=(10, 6))
plt.scatter(range(len(error3)), error3, color='blue', label='Error')
plt.axhline(y=0, color='red', linestyle='--', linewidth=1)  # Línea horizontal en y=0
plt.title('Error de Predicción ' + str(symbol))
plt.xlabel('Índice de la muestra')
plt.ylabel('Error')
plt.legend()
plt.grid(True)
plt.savefig(str(symbol)+str(optional)+'.png')

rmse_3 = format(score3)
mse_3 = metrics.mean_squared_error(value13,value23)
r2_3 = metrics.r2_score(value13,value23)

resultados3= [rmse_3,mse_3,r2_3]

# Abre un archivo en modo escritura
with open(str(symbol)+str(optional)+"results.txt", "w") as archivo:
    # Escribe cada resultado en una línea separada
    for resultado in resultados3:
        archivo.write(str(resultado) + "\n")

# finish
mt5.shutdown()

#show iteration-rmse graph for training and validation
plt.figure(figsize = (18,10))
plt.plot(history3.history['root_mean_squared_error'],label='Training RMSE',color='b')
plt.plot(history3.history['val_root_mean_squared_error'],label='Validation-RMSE',color='g')
plt.xlabel("Iteration")
plt.ylabel("RMSE")
plt.title("RMSE" + str(symbol))
plt.legend()
plt.savefig(str(symbol)+str(optional)+'1.png')

#show iteration-loss graph for training and validation
plt.figure(figsize = (18,10))
plt.plot(history3.history['loss'],label='Training Loss',color='b')
plt.plot(history3.history['val_loss'],label='Validation-loss',color='g')
plt.xlabel("Iteration")
plt.ylabel("Loss")
plt.title("LOSS" + str(symbol))
plt.legend()
plt.savefig(str(symbol)+str(optional)+'2.png')

#show actual vs predicted (training) graph
plt.figure(figsize=(18,10))
plt.plot(scaler3.inverse_transform(plot_y_train3),color = 'b', label = 'Original')
plt.plot(scaler3.inverse_transform(train_predict3),color='red', label = 'Predicted')
plt.title("Prediction Graph Using Training Data" + str(symbol))
plt.xlabel("Hours")
plt.ylabel("Price")
plt.legend()
plt.savefig(str(symbol)+str(optional)+'3.png')

#show actual vs predicted (testing) graph
plt.figure(figsize=(18,10))
plt.plot(scaler3.inverse_transform(plot_y_test3),color = 'b',  label = 'Original')
plt.plot(scaler3.inverse_transform(test_predict3),color='g', label = 'Predicted')
plt.title("Prediction Graph Using Testing Data" + str(symbol))
plt.xlabel("Hours")
plt.ylabel("Price")
plt.legend()
plt.savefig(str(symbol)+str(optional)+'4.png')

################################################################################################
##############################################################################################
"""
import onnxruntime as ort
import numpy as np

# Cargar el modelo ONNX
sesion = ort.InferenceSession("EURUSD_M1_inverse_test.onnx")

# Obtener el nombre de la entrada y la salida del modelo
input_name = sesion.get_inputs()[0].name
output_name = sesion.get_outputs()[0].name

# Crear datos de entrada de prueba como un array de numpy
# Asegúrate de que los datos de entrada coincidan con la forma y el tipo esperado por el modelo
input_data = [1,120] #np.random.rand(1, 10).astype(np.float32)  # Ejemplo: entrada de tamaño [1, 10]

# Realizar la inferencia
result = sesion.run([output_name], {input_name: input_data})

# Imprimir el resultado
print(result)
"""
Este .py creará tres ONNX y también algunos gráficos y datos para que puedas comprobar si todo está bien.
Los datos vienen en un archivo txt y cada número representa RMSE, MSE y R2 respectivamente.
Antes de ejecutar este script, debe especificar los símbolos, el tamaño de la muestra, el período de tiempo y la fecha de finalización (desde hasta los períodos de conteo regresivo).
La variable opcional es una cadena donde puedes agregar algo como ticks en M1 o end_date... lo que quieras para guardar los archivos ONNX y los gráficos y datos.
symbol1 = "EURGBP"
symbol2 = "GBPUSD"
symbol3 = "EURUSD"
sample_size1 = 200000
optional = "_M1_test"
timeframe = mt5.TIMEFRAME_M1

#end_date = datetime.now()
end_date = datetime(2024, 3, 4, 0)
Si deseas realizar la prueba en el probador de estrategias modifica la fecha como desees. Si desea operar, sólo tiene que utilizar end_date.
end_date = datetime.now() *** Si estás operando en una cuenta de spread cero, puedes intentar usar ticks en lugar de períodos, solo tienes que cambiar: ***
eurusd_rates = mt5.copy_rates_from(symbol, timeframe , end_date, sample_size)
por esto:
eurusd_rates = mt5.copy_ticks_from(symbol, end_date, sample_size, mt5.COPY_TICKS_ALL)
Aquí tendrá los ticks de Oferta y Demanda. Creo que hay una limitación en el número de ticks. Si necesitas más ticks, puedes descargar todos los ticks de un símbolo con esto: Download all data from a symbol. Es gratis.
Para ejecutar el archivo .py, simplemente ábralo con VSC y presione EJECUTAR -> Ejecutar sin depurar (mientras tenga MT5 abierto). Luego espera a que termine.
Terminarás con un montón de gráficos, archivos TXT y ONNX. Debes guardar el archivo ONNX en la carpeta MQL5/Files y especificar la misma ruta en el código del EA.
Seguirá haciendo ese trabajo gracias a esta línea:
# and save to MQL5\Files folder to use as file
terminal_info=mt5.terminal_info()
file_path=terminal_info.data_path+"\\MQL5\\Files\\"
print("file path to save onnx model",file_path)
Tenga en cuenta que si desea disponer de muchos archivos ONNX, que tiene en otras carpetas, debe especificar la ruta.
Este .py exporta imágenes como éstas:
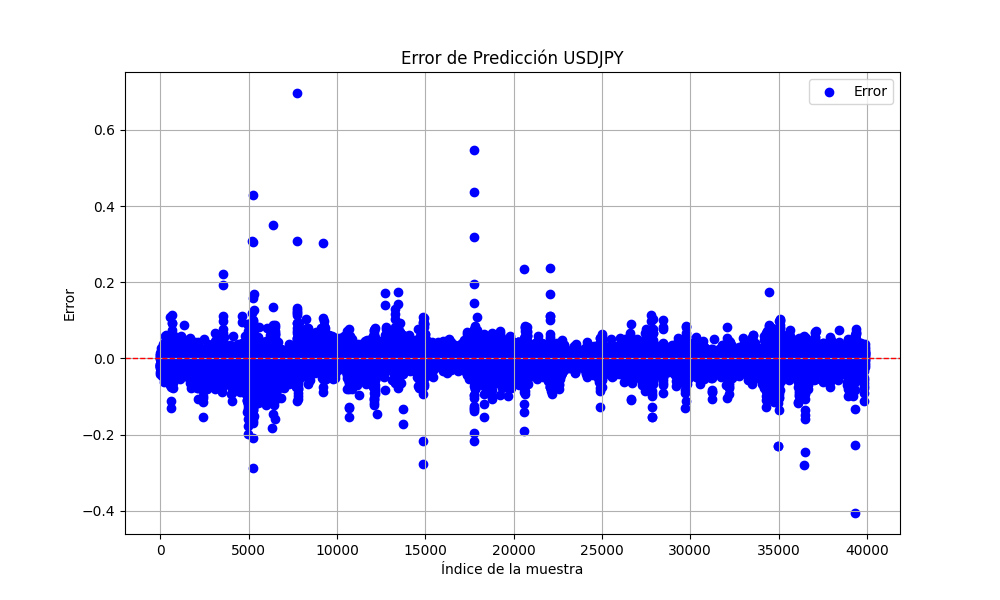
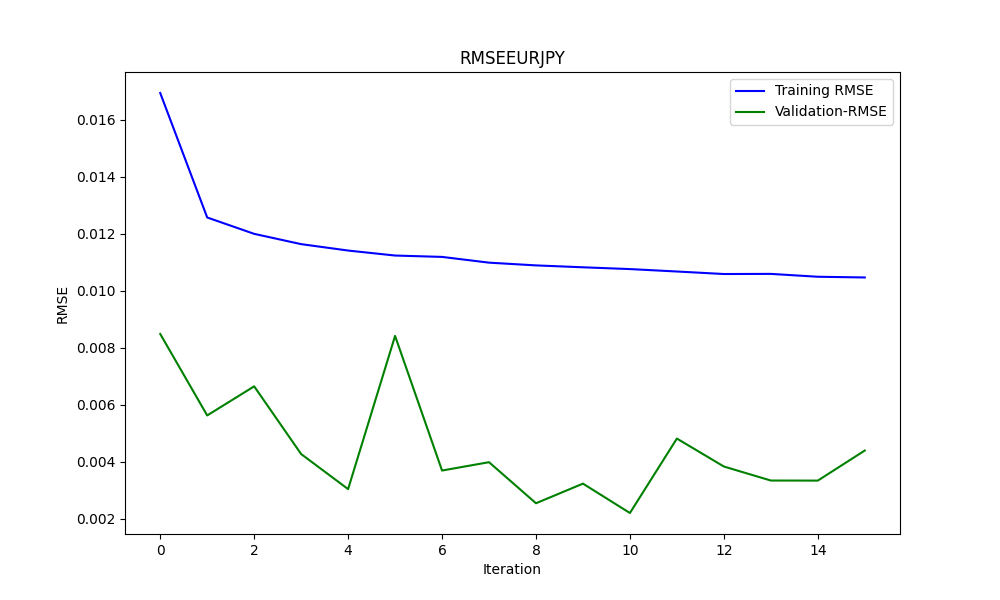
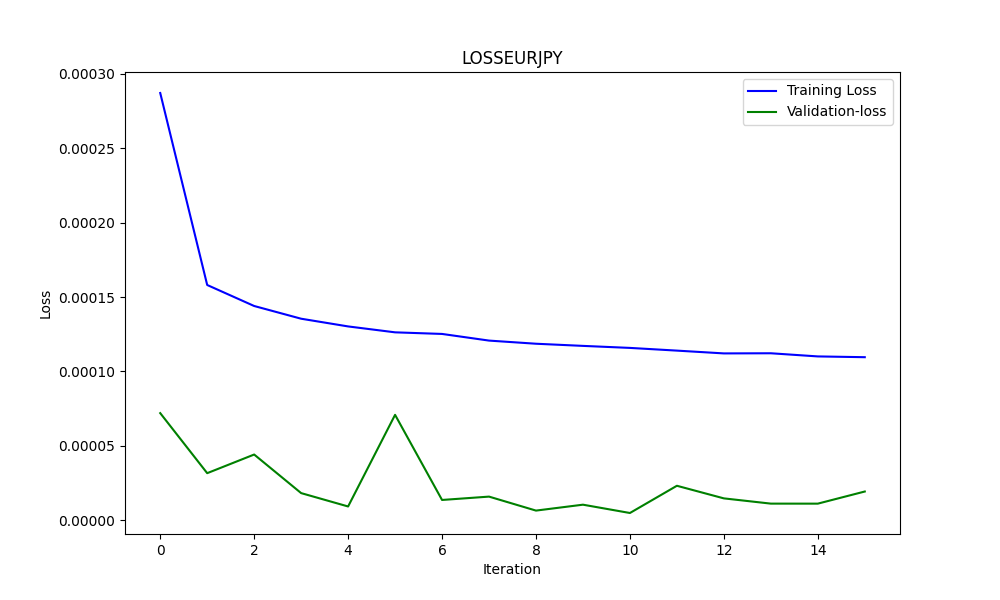
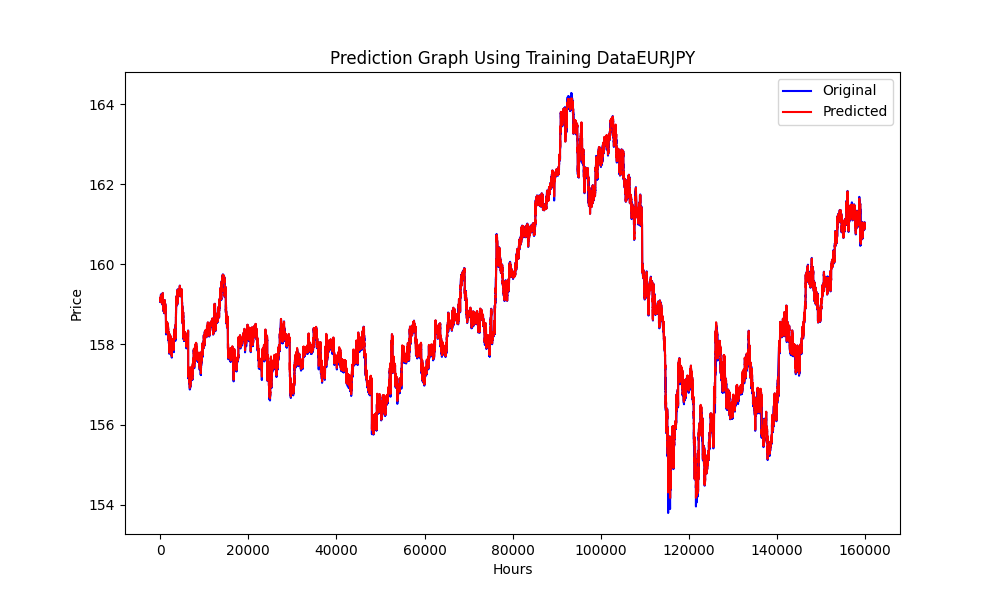
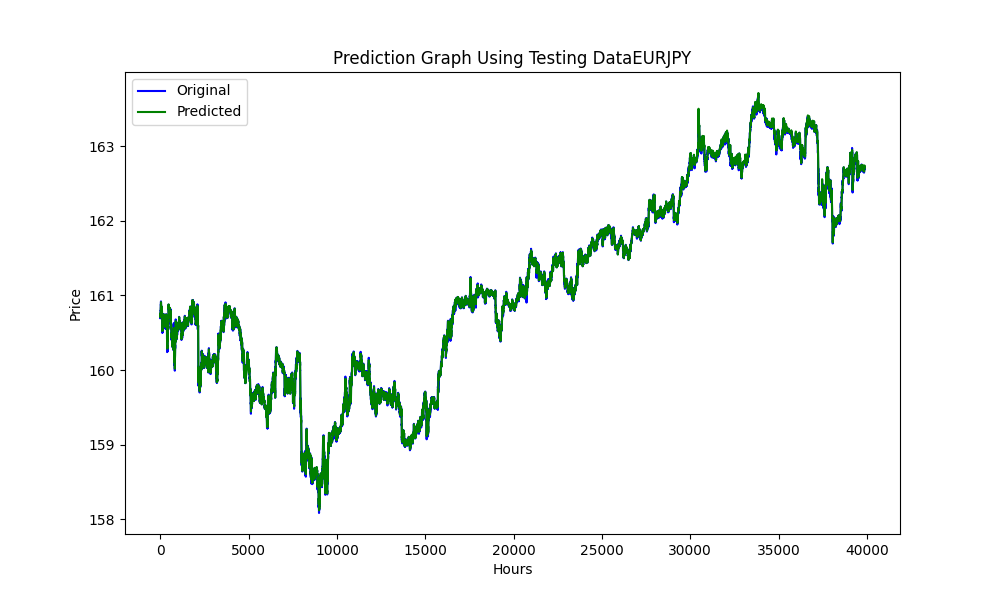
Este gráfico con los valores RMSE, MSE y R2
0.023019903957086384
0.0005299159781934813
0.999707563612641
Con todo esto, podemos saber si nuestros modelos están sobreajustados o infraajustados.
En este caso:
RMSE mide la desviación estándar de los residuos (errores de predicción). Los residuos son una medida de qué tan lejos están los puntos de datos de la línea de regresión; RMSE es una medida de qué tan dispersos están estos residuos. En otras palabras, te indica qué tan concentrados están los datos alrededor de la línea de mejor ajuste.
Un valor RMSE más pequeño indica un mejor ajuste. El valor RMSE que tiene es muy pequeño, lo que sugiere que el modelo se ajusta muy bien al conjunto de datos.
MSE es como RMSE pero cuadra los errores antes de promediarlos, lo que otorga mayor peso a los errores más grandes. Es otra medida de la calidad de un estimador: siempre es no negativo y los valores más cercanos a cero son mejores.
El valor MSE muy pequeño confirma además que las predicciones del modelo están muy cerca de los puntos de datos reales.
R2 es una medida estadística que representa la proporción de la varianza de una variable dependiente que se explica por una o más variables independientes en un modelo de regresión. Un valor de 𝑅2 de 1 indica que las predicciones de regresión se ajustan perfectamente a los datos.
Nuestro R2 El valor está muy cerca de 1, lo que indica que su modelo explica casi toda la variabilidad alrededor de la media, lo cual es excelente.
En general, estas métricas sugieren que su modelo tiene un desempeño excepcionalmente bueno al predecir o adaptarse a su conjunto de datos.
Y para saber si hay sobreajuste utilizamos los gráficos, por ejemplo en este caso el segundo.
He aquí un análisis basado en el gráfico:
-
Pérdida de entrenamiento (línea azul):
- Esta línea muestra un pronunciado descenso inicial, lo que indica que el modelo está aprendiendo rápidamente del conjunto de datos de entrenamiento. A medida que avanzan las iteraciones, la pérdida de formación sigue disminuyendo, pero a un ritmo más lento, lo que es típico cuando el modelo empieza a converger hacia un mínimo.
-
Pérdida de validación (línea verde):
- La pérdida de validación permanece extremadamente baja y bastante estable durante todo el proceso de entrenamiento. Esto sugiere que el modelo se está generalizando bien y no solo memorizando los datos de entrenamiento. Las pequeñas fluctuaciones indican variabilidad en el rendimiento del conjunto de validación a lo largo de las iteraciones, pero permanecen dentro de una banda muy estrecha.
En general, el gráfico sugiere un proceso de entrenamiento muy exitoso con excelente convergencia y generalización. La baja pérdida de validación es particularmente prometedora, ya que indica que el modelo debería funcionar bien con datos no vistos, suponiendo que el conjunto de validación sea representativo del espacio general del problema.
Una vez hecho todo esto, pasémoslo al EA.
Asesor experto para arbitraje triangular con predicciones
//+------------------------------------------------------------------+
//|                          ONNX_Triangular EURUSD-USDJPY-EURJPY.mq5|
//|             Copyright 2024, Javier S. Gastón de Iriarte Cabrera. |
//|                      https://www.mql5.com/en/users/jsgaston/news |
//+------------------------------------------------------------------+
#property copyright   "Copyright 2024, Javier S. Gastón de Iriarte Cabrera."
#property link        "https://www.mql5.com/en/users/jsgaston/news"
#property version     "1.04"

#property strict
#include <Trade\Trade.mqh>
#define MAGIC (965334)


#resource "/Files/art/arbitrage triangular/eurusdjpy/EURUSD__M1_test.onnx" as uchar ExtModel[]
#resource "/Files/art/arbitrage triangular/eurusdjpy/USDJPY__M1_test.onnx" as uchar ExtModel2[]
#resource "/Files/art/arbitrage triangular/eurusdjpy/EURJPY__M1_test.onnx" as uchar ExtModel3[]
CTrade ExtTrade;

#define SAMPLE_SIZE 120

input double lotSize = 3.0;
//input double slippage = 3;
// Add these inputs to allow dynamic control over SL and TP distances
input double StopLossPips = 50.0; // Stop Loss in pips
input double TakeProfitPips = 100.0; // Take Profit in pips
//input double maxSpreadPoints = 10.0;

input ENUM_TIMEFRAMES Periodo = PERIOD_CURRENT;

//+------------------------------------------------------------------+
//|                                                                  |
//+------------------------------------------------------------------+
string symbol1 = Symbol();
input string symbol2 = "USDJPY";
input string symbol3 = "EURJPY";
int ticket1 = 0;
int ticket2 = 0;
int ticket3 = 0;
int ticket11 = 0;
int ticket22 = 0;
int ticket33 = 0;
input bool isArbitrageActive = true;

double spreads[1000]; // Array para almacenar hasta 1000 spreads
int spreadIndex = 0; // Índice para el próximo spread a almacenar

long     ExtHandle=INVALID_HANDLE;
//int      ExtPredictedClass=-1;
datetime ExtNextBar=0;
datetime ExtNextDay=0;
float    ExtMin=0.0;
float    ExtMax=0.0;


long     ExtHandle2=INVALID_HANDLE;
//int      ExtPredictedClass=-1;
datetime ExtNextBar2=0;
datetime ExtNextDay2=0;
float    ExtMin2=0.0;
float    ExtMax2=0.0;

long     ExtHandle3=INVALID_HANDLE;
//int      ExtPredictedClass=-1;
datetime ExtNextBar3=0;
datetime ExtNextDay3=0;
float    ExtMin3=0.0;
float    ExtMax3=0.0;

float predicted=0.0;
float predicted2=0.0;
float predicted3=0.0;
float predicted2i=0.0;
float predicted3i=0.0;

float   lastPredicted1=0.0;
float   lastPredicted2=0.0;
float   lastPredicted3=0.0;
float   lastPredicted2i=0.0;
float   lastPredicted3i=0.0;

int Order=0;

input double targetProfit = 100.0; // Eur benefit goal
input double maxLoss = -50.0;      // Eur max loss

input double perVar = 0.005; // Percentage of variation to make orders

ulong tickets[6]; // Array para almacenar los tickets de las órdenes

double sl=0.0;
double tp=0.0;

int Abrir = 0;
//+------------------------------------------------------------------+
//| Expert initialization function                                   |
//+------------------------------------------------------------------+
int OnInit()
  {

   ExtTrade.SetExpertMagicNumber(MAGIC);
   Print("EA de arbitraje ONNX iniciado");

//--- create a model from static buffer
   ExtHandle=OnnxCreateFromBuffer(ExtModel,ONNX_DEFAULT);
   if(ExtHandle==INVALID_HANDLE)
     {
      Print("OnnxCreateFromBuffer error ",GetLastError());
      return(INIT_FAILED);
     }

//--- since not all sizes defined in the input tensor we must set them explicitly
//--- first index - batch size, second index - series size, third index - number of series (only Close)
   const long input_shape[] = {1,SAMPLE_SIZE,1};
   if(!OnnxSetInputShape(ExtHandle,ONNX_DEFAULT,input_shape))
     {
      Print("OnnxSetInputShape error ",GetLastError());
      return(INIT_FAILED);
     }

//--- since not all sizes defined in the output tensor we must set them explicitly
//--- first index - batch size, must match the batch size of the input tensor
//--- second index - number of predicted prices (we only predict Close)
   const long output_shape[] = {1,1};
   if(!OnnxSetOutputShape(ExtHandle,0,output_shape))
     {
      Print("OnnxSetOutputShape error ",GetLastError());
      return(INIT_FAILED);
     }

////////////////////////////////////////////////////////////////////////////////////////

//--- create a model from static buffer
   ExtHandle2=OnnxCreateFromBuffer(ExtModel2,ONNX_DEFAULT);
   if(ExtHandle2==INVALID_HANDLE)
     {
      Print("OnnxCreateFromBuffer error ",GetLastError());
      return(INIT_FAILED);
     }

//--- since not all sizes defined in the input tensor we must set them explicitly
//--- first index - batch size, second index - series size, third index - number of series (only Close)
   const long input_shape2[] = {1,SAMPLE_SIZE,1};
   if(!OnnxSetInputShape(ExtHandle2,ONNX_DEFAULT,input_shape2))
     {
      Print("OnnxSetInputShape error ",GetLastError());
      return(INIT_FAILED);
     }

//--- since not all sizes defined in the output tensor we must set them explicitly
//--- first index - batch size, must match the batch size of the input tensor
//--- second index - number of predicted prices (we only predict Close)
   const long output_shape2[] = {1,1};
   if(!OnnxSetOutputShape(ExtHandle2,0,output_shape2))
     {
      Print("OnnxSetOutputShape error ",GetLastError());
      return(INIT_FAILED);
     }

/////////////////////////////////////////////////////////////////////////////////////////////////////////////
//--- create a model from static buffer
   ExtHandle3=OnnxCreateFromBuffer(ExtModel3,ONNX_DEFAULT);
   if(ExtHandle3==INVALID_HANDLE)
     {
      Print("OnnxCreateFromBuffer error ",GetLastError());
      return(INIT_FAILED);
     }

//--- since not all sizes defined in the input tensor we must set them explicitly
//--- first index - batch size, second index - series size, third index - number of series (only Close)
   const long input_shape3[] = {1,SAMPLE_SIZE,1};
   if(!OnnxSetInputShape(ExtHandle3,ONNX_DEFAULT,input_shape3))
     {
      Print("OnnxSetInputShape error ",GetLastError());
      return(INIT_FAILED);
     }

//--- since not all sizes defined in the output tensor we must set them explicitly
//--- first index - batch size, must match the batch size of the input tensor
//--- second index - number of predicted prices (we only predict Close)
   const long output_shape3[] = {1,1};
   if(!OnnxSetOutputShape(ExtHandle3,0,output_shape3))
     {
      Print("OnnxSetOutputShape error ",GetLastError());
      return(INIT_FAILED);
     }

   return(INIT_SUCCEEDED);
  }

//+------------------------------------------------------------------+
//| Expert deinitialization function                                 |
//+------------------------------------------------------------------+
void OnDeinit(const int reason)
  {
   if(ExtHandle!=INVALID_HANDLE)
     {
      OnnxRelease(ExtHandle);
      ExtHandle=INVALID_HANDLE;
     }

   if(ExtHandle2!=INVALID_HANDLE)
     {
      OnnxRelease(ExtHandle2);
      ExtHandle2=INVALID_HANDLE;
     }

   if(ExtHandle3!=INVALID_HANDLE)
     {
      OnnxRelease(ExtHandle3);
      ExtHandle3=INVALID_HANDLE;
     }
  }

//+------------------------------------------------------------------+
//| Expert tick function                                             |
//+------------------------------------------------------------------+
void OnTick()
  {

   SymbolProcessor processor; // Crear instancia de SymbolProcessor

   string A = processor.GetFirstThree(symbol1);
   string B = processor.GetLastThree(symbol1);

   string C = processor.GetFirstThree(symbol2);
   string D = processor.GetLastThree(symbol2);

   string E = processor.GetFirstThree(symbol3);
   string F = processor.GetLastThree(symbol3);

   if((A != E) || (B != C) || (D != F))
     {
      Print("Wrongly selected symbols");
      return;
     }


//--- check new day
   if(TimeCurrent()>=ExtNextDay)
     {
      GetMinMax();
      GetMinMax2();
      GetMinMax3();
      //--- set next day time
      ExtNextDay=TimeCurrent();
      ExtNextDay-=ExtNextDay%PeriodSeconds(Periodo);
      ExtNextDay+=PeriodSeconds(Periodo);

     }

//--- check new bar
   if(TimeCurrent()<ExtNextBar)
     {

      return;
     }
//--- set next bar time
   ExtNextBar=TimeCurrent();
   ExtNextBar-=ExtNextBar%PeriodSeconds();
   ExtNextBar+=PeriodSeconds();
//--- check min and max
   float close=(float)iClose(symbol1,Periodo,0);
   if(ExtMin>close)
      ExtMin=close;
   if(ExtMax<close)
      ExtMax=close;
   float close2=(float)iClose(symbol2,Periodo,0);
   if(ExtMin2>close2)
      ExtMin2=close2;
   if(ExtMax2<close2)
      ExtMax2=close2;
   float close3=(float)iClose(symbol3,Periodo,0);
   if(ExtMin3>close3)
      ExtMin3=close3;
   if(ExtMax3<close3)
      ExtMax3=close3;

   lastPredicted1=predicted;
   lastPredicted2=predicted2;
   lastPredicted3=predicted3;
   lastPredicted2i=predicted2i;
   lastPredicted3i=predicted3i;

//--- predict next price
   PredictPrice();
   PredictPrice2();
   PredictPrice3();


   /*   */
   double price1 = SymbolInfoDouble(symbol1, SYMBOL_BID);/////////////////
   double price2 = SymbolInfoDouble(symbol2, SYMBOL_BID);
   double price2i = 1/price2;
   double price3 = SymbolInfoDouble(symbol3, SYMBOL_ASK);
   double price3i = 1/price3;

   double price11 = SymbolInfoDouble(symbol1, SYMBOL_ASK);/////////////////
   double price22 = SymbolInfoDouble(symbol2, SYMBOL_ASK);
   double price22i = 1/price22;
   double price33 = SymbolInfoDouble(symbol3, SYMBOL_BID);
   double price33i = 1/price33;

   predicted2i = 1/predicted2;
   predicted3i = 1/predicted3;


//double lotSize = 1.0; // Lote base
   double lotSize2 = lotSize * predicted / predicted2;   /// tengo dudas con usar el invertido o no invertido
   double lotSize3 = lotSize * predicted / predicted3;

   double lotSize22 = lotSize * predicted / predicted2;  /// tengo dudas con usar el invertido o no invertido
   double lotSize33 = lotSize * predicted / predicted3;

// Redondear lotes a un múltiplo aceptable por tu bróker
   lotSize2 = NormalizeDouble(lotSize2, 2); // Asume 2 decimales para lotes
   lotSize3 = NormalizeDouble(lotSize3, 2);

   lotSize22 = NormalizeDouble(lotSize22, 2); // Asume 2 decimales para lotes
   lotSize33 = NormalizeDouble(lotSize33, 2);

   int totalPositions = PositionsTotal();

   if(Order==1 || Order==2)
     {
      // Verificar y cerrar órdenes si se cumplen las condiciones
      Print("Verificar y cerrar órdenes si se cumplen las condiciones");
      CheckAndCloseOrders();

     }


   if(!isArbitrageActive || ArePositionsOpen())
     {
      Print("Arbitraje inactivo o ya hay posiciones abiertas.");
      return;
     }
   double varia11 = 100.0 - (close*100/predicted);
   double varia21 = 100.0 - (close2*100/predicted2);
   double varia31 = 100.0 - (predicted3*100/close3);
   double varia12 = 100.0 - (predicted*100/close);
   double varia22 = 100.0 - (predicted2*100/close2);
   double varia32 = 100.0 - (close3*100/predicted3);


   if((varia11 > perVar)   && (varia21 > perVar) && (varia31 > perVar))
     {
      Print("se debería proceder a apertura de ordenes de derechas");
      Abrir = 1;
     }
   if((varia12 > perVar)   && (varia22 > perVar) && (varia32 > perVar))
     {
      Print("se debería proceder a apertura de ordenes de izquierdas");
      Abrir = 2;
     }
   if(Abrir == 1 && (predicted*predicted2*predicted3i>1))
     {
      Print("orden derecha");
      // Inicia el arbitraje si aún no está activo
      if(isArbitrageActive)
        {

         if((ticket1 == 0 && ticket2 == 0 && ticket3 ==0) && (Order==0) &&  totalPositions ==0)
           {
            Print("Preparando para abrir órdenes");
            Order = 1;


            MqlTradeRequest request;
            MqlTradeResult  result;


              {

               MqlRates rates[];
               ArraySetAsSeries(rates,true);
               int copied=CopyRates(symbol1,0,0,1,rates);

               CalculateSL(true,rates[0].close,symbol1);
               CalculateTP(true,rates[0].close,symbol1);

               if(ExtTrade.Buy(lotSize, symbol1, rates[0].close, sl, tp, "Arbitraje"))
                 {
                  tickets[0] = ExtTrade.ResultDeal();  // Getting the ticket of the last trade
                  Print("Order placed with ticket: ", tickets[0]);
                 }
               else
                 {
                  Print("Failed to place order: ", GetLastError());
                 }
              }

              {
               MqlRates rates[];
               ArraySetAsSeries(rates,true);
               int copied=CopyRates(symbol2,0,0,1,rates);

               CalculateSL(true,rates[0].close,symbol2);
               CalculateTP(true,rates[0].close,symbol2);

               if(ExtTrade.Buy(lotSize2, symbol2, rates[0].close, sl, tp, "Arbitraje"))
                 {
                  tickets[1] = ExtTrade.ResultDeal();  // Getting the ticket of the last trade
                  Print("Order placed with ticket: ", tickets[1]);
                 }
               else
                 {
                  Print("Failed to place order: ", GetLastError());
                 }
              }

              {
               MqlRates rates[];
               ArraySetAsSeries(rates,true);
               int copied=CopyRates(symbol3,0,0,1,rates);

               CalculateSL(false,rates[0].close,symbol3);
               CalculateTP(false,rates[0].close,symbol3);


               if(ExtTrade.Sell(lotSize3, symbol3, rates[0].close, sl, tp, "Arbitraje"))
                 {
                  tickets[2] = ExtTrade.ResultDeal();  // Getting the ticket of the last trade
                  Print("Order placed with ticket: ", tickets[2]);
                 }
               else
                 {
                  Print("Failed to place order: ", GetLastError());
                 }
              }


            ticket1=1;
            ticket2=1;
            ticket3=1;
            Abrir=0;

            return;
           }
         else
           {
            Print(" no se puede abrir ordenes");
           }
        }
     }

   if(Abrir == 2 && (predicted*predicted2*predicted3i<1))
     {
      Print("Orden Inversa");
      // Inicia el arbitraje si aún no está activo
      if(isArbitrageActive)
        {

         if((ticket11 == 0 && ticket22 == 0 && ticket33 ==0) && (Order==0) && totalPositions==0)
           {
            Print("Preparando para abrir órdenes");
            Order = 2;

            MqlTradeRequest request;
            MqlTradeResult  result;

              {
               MqlRates rates[];
               ArraySetAsSeries(rates,true);
               int copied=CopyRates(symbol1,0,0,1,rates);

               CalculateSL(false,rates[0].close,symbol1);
               CalculateTP(false,rates[0].close,symbol1);

               if(ExtTrade.Sell(lotSize, symbol1, rates[0].close, sl, tp, "Arbitraje"))
                 {
                  tickets[3] = ExtTrade.ResultDeal();  // Getting the ticket of the last trade
                  Print("Order placed with ticket: ", tickets[3]);
                 }
               else
                 {
                  Print("Failed to place order: ", GetLastError());
                 }
              }

              {
               MqlRates rates[];
               ArraySetAsSeries(rates,true);
               int copied=CopyRates(symbol2,0,0,1,rates);
               CalculateSL(false,rates[0].close,symbol2);
               CalculateTP(false,rates[0].close,symbol2);

               if(ExtTrade.Sell(lotSize2, symbol2, rates[0].close, sl, tp, "Arbitraje"))
                 {
                  tickets[4] = ExtTrade.ResultDeal();  // Getting the ticket of the last trade
                  Print("Order placed with ticket: ", tickets[4]);
                 }
               else
                 {
                  Print("Failed to place order: ", GetLastError());
                 }
              }

              {
               MqlRates rates[];
               ArraySetAsSeries(rates,true);
               int copied=CopyRates(symbol3,0,0,1,rates);

               CalculateSL(true,rates[0].close,symbol3);
               CalculateTP(true,rates[0].close,symbol3);

               if(ExtTrade.Buy(lotSize3, symbol3, rates[0].close, sl, tp, "Arbitraje"))
                 {
                  tickets[5] = ExtTrade.ResultDeal();  // Getting the ticket of the last trade
                  Print("Order placed with ticket: ", tickets[5]);
                 }
               else
                 {
                  Print("Failed to place order: ", GetLastError());
                 }
              }


            ticket11=1;
            ticket22=1;
            ticket33=1;
            Abrir=0;

            return;
           }
         else
           {
            Print(" no se puede abrir ordenes");
           }
        }
     }

  }

//+------------------------------------------------------------------+
//| Postions are open function                                       |
//+------------------------------------------------------------------+
bool ArePositionsOpen()
  {
// Check for positions on symbol1
   if(PositionSelect(symbol1) && PositionGetDouble(POSITION_VOLUME) > 0)
      return true;
// Check for positions on symbol2
   if(PositionSelect(symbol2) && PositionGetDouble(POSITION_VOLUME) > 0)
      return true;
// Check for positions on symbol3
   if(PositionSelect(symbol3) && PositionGetDouble(POSITION_VOLUME) > 0)
      return true;

   return false;
  }
//+------------------------------------------------------------------+
//| Price prediction function                                        |
//+------------------------------------------------------------------+
void PredictPrice(void)
  {
   static vectorf output_data(1);            // vector to get result
   static vectorf x_norm(SAMPLE_SIZE);       // vector for prices normalize

//--- check for normalization possibility
   if(ExtMin>=ExtMax)
     {
      Print("ExtMin>=ExtMax");
      //ExtPredictedClass=-1;
      return;
     }
//--- request last bars
   if(!x_norm.CopyRates(_Symbol,Periodo,COPY_RATES_CLOSE,1,SAMPLE_SIZE))
     {
      Print("CopyRates ",x_norm.Size());
      //ExtPredictedClass=-1;
      return;
     }
   float last_close=x_norm[SAMPLE_SIZE-1];
//--- normalize prices
   x_norm-=ExtMin;
   x_norm/=(ExtMax-ExtMin);
//--- run the inference
   if(!OnnxRun(ExtHandle,ONNX_NO_CONVERSION,x_norm,output_data))
     {
      Print("OnnxRun");
      //ExtPredictedClass=-1;
      return;
     }
//--- denormalize the price from the output value
   predicted=output_data[0]*(ExtMax-ExtMin)+ExtMin;
//return predicted;
  }

//+------------------------------------------------------------------+
//| Price prediction function                                        |
//+------------------------------------------------------------------+
void PredictPrice2(void)
  {
   static vectorf output_data2(1);            // vector to get result
   static vectorf x_norm2(SAMPLE_SIZE);       // vector for prices normalize

//--- check for normalization possibility
   if(ExtMin2>=ExtMax2)
     {
      Print("ExtMin2>=ExtMax2");
      //ExtPredictedClass=-1;
      return;
     }
//--- request last bars
   if(!x_norm2.CopyRates(symbol2,Periodo,COPY_RATES_CLOSE,1,SAMPLE_SIZE))
     {
      Print("CopyRates ",x_norm2.Size());
      //ExtPredictedClass=-1;
      return;
     }
   float last_close2=x_norm2[SAMPLE_SIZE-1];
//--- normalize prices
   x_norm2-=ExtMin2;
   x_norm2/=(ExtMax2-ExtMin2);
//--- run the inference
   if(!OnnxRun(ExtHandle2,ONNX_NO_CONVERSION,x_norm2,output_data2))
     {
      Print("OnnxRun");
      //ExtPredictedClass=-1;
      return;
     }
//--- denormalize the price from the output value
   predicted2=output_data2[0]*(ExtMax2-ExtMin2)+ExtMin2;
//--- classify predicted price movement
//return predicted2;
  }

//+------------------------------------------------------------------+
//| Price prediction function                                        |
//+------------------------------------------------------------------+
void PredictPrice3(void)
  {
   static vectorf output_data3(1);            // vector to get result
   static vectorf x_norm3(SAMPLE_SIZE);       // vector for prices normalize

//--- check for normalization possibility
   if(ExtMin3>=ExtMax3)
     {
      Print("ExtMin3>=ExtMax3");
      //ExtPredictedClass=-1;
      return;
     }
//--- request last bars
   if(!x_norm3.CopyRates(symbol3,Periodo,COPY_RATES_CLOSE,1,SAMPLE_SIZE))
     {
      Print("CopyRates ",x_norm3.Size());
      //ExtPredictedClass=-1;
      return;
     }
   float last_close3=x_norm3[SAMPLE_SIZE-1];
//--- normalize prices
   x_norm3-=ExtMin3;
   x_norm3/=(ExtMax3-ExtMin3);
//--- run the inference
   if(!OnnxRun(ExtHandle3,ONNX_NO_CONVERSION,x_norm3,output_data3))
     {
      Print("OnnxRun");
      //ExtPredictedClass=-1;
      return;
     }
//--- denormalize the price from the output value
   predicted3=output_data3[0]*(ExtMax3-ExtMin3)+ExtMin3;
//--- classify predicted price movement
//return predicted2;
  }

//+------------------------------------------------------------------+
//| Get minimal and maximal Close for last 120 values                |
//+------------------------------------------------------------------+
void GetMinMax(void)
  {
   vectorf closeMN;
   closeMN.CopyRates(symbol1,Periodo,COPY_RATES_CLOSE,0,SAMPLE_SIZE);
   ExtMin=closeMN.Min();
   ExtMax=closeMN.Max();
  }

//+------------------------------------------------------------------+
//| Get minimal and maximal Close for last 120 values                |
//+------------------------------------------------------------------+
void GetMinMax2(void)
  {
   vectorf closeMN2;
   closeMN2.CopyRates(symbol2,Periodo,COPY_RATES_CLOSE,0,SAMPLE_SIZE);
   ExtMin2=closeMN2.Min();
   ExtMax2=closeMN2.Max();
  }

//+------------------------------------------------------------------+
//| Get minimal and maximal Close for last 120 values                |
//+------------------------------------------------------------------+
void GetMinMax3(void)
  {
   vectorf closeMN3;
   closeMN3.CopyRates(symbol3,Periodo,COPY_RATES_CLOSE,0,SAMPLE_SIZE);
   ExtMin3=closeMN3.Min();
   ExtMax3=closeMN3.Max();
  }

//+------------------------------------------------------------------+
//| Symbols class returns both pairs of a symbol                     |
//+------------------------------------------------------------------+
class SymbolProcessor
  {
public:
   // Método para obtener los primeros tres caracteres de un símbolo dado
   string            GetFirstThree(string symbol)
     {
      return StringSubstr(symbol, 0, 3);
     }

   // Método para obtener los últimos tres caracteres de un símbolo dado
   string            GetLastThree(string symbol)
     {
      if(StringLen(symbol) >= 3)
         return StringSubstr(symbol, StringLen(symbol) - 3, 3);
      else
         return ""; // Retorna un string vacío si el símbolo es demasiado corto
     }
  };

//+------------------------------------------------------------------+
//| Calculate total profit from all open positions for the current symbol
//+------------------------------------------------------------------+
double CalculateCurrentArbitrageProfit()
  {
   double totalProfit = 0.0;
   int totalPositions = PositionsTotal(); // Get the total number of open positions

// Loop through all open positions
   for(int i = 0; i < totalPositions; i++)
     {
      // Get the ticket of the position at index i
      ulong ticket = PositionGetTicket(i);
      if(PositionSelectByTicket(ticket))    // Select the position by its ticket
        {
         // Add the profit of the current position to the total profit
         totalProfit += PositionGetDouble(POSITION_PROFIT);
         //Print("totalProfit ", totalProfit);
        }
     }

   return totalProfit; // Return the total profit of all open positions
  }
// Función para cerrar todas las órdenes
void CloseAllOrders()
  {
   string symbols[] = {symbol1, symbol2, symbol3};
   for(int i = 0; i < ArraySize(symbols); i++)
     {
      if(ExtTrade.PositionClose(symbols[i], 3))
         Print("Posición cerrada correctamente para ", symbols[i]);
      else
         Print("Error al cerrar posición para ", symbols[i], ": Error", GetLastError());
     }

// Resetea tickets y ordenes
   ticket1 = 0;
   ticket2 = 0;
   ticket3 = 0;
   ticket11 = 0;
   ticket22 = 0;
   ticket33 = 0;
   Order = 0;

   Print("Todas las órdenes están cerradas");
  }

//+------------------------------------------------------------------+
//| Check and close orders funcion                                   |
//+------------------------------------------------------------------+
// Función para verificar y cerrar órdenes
void CheckAndCloseOrders()
  {
   double currentProfit = CalculateCurrentArbitrageProfit();

// Condiciones para cerrar las órdenes
   if((currentProfit >= targetProfit || currentProfit <= maxLoss))
     {
      CloseAllOrders();  // Cierra todas las órdenes
      Print("Todas las órdenes cerradas. Beneficio/Pérdida actual: ", currentProfit);
     }
  }

//+------------------------------------------------------------------+
//| Get order volume function                                        |
//+------------------------------------------------------------------+
double GetOrderVolume(int ticket)
  {
   if(PositionSelectByTicket(ticket))
     {
      double volume = PositionGetDouble(POSITION_VOLUME);
      return volume;
     }
   else
     {
      Print("No se pudo seleccionar la posición con el ticket: ", ticket);
      return 0; // Retorna 0 si no se encuentra la posición
     }
  }
//+------------------------------------------------------------------+
// Function to get the price and calculate SL dynamically

double CalculateSL(bool isBuyOrder,double entryPrice,string simbolo)
  {

   double pointSize = SymbolInfoDouble(simbolo, SYMBOL_POINT);
   int digits = (int)SymbolInfoInteger(simbolo, SYMBOL_DIGITS);
   double pipSize = pointSize * 10;


   if(isBuyOrder)
     {
      sl = NormalizeDouble(entryPrice - StopLossPips * pipSize, digits);
      tp = NormalizeDouble(entryPrice + TakeProfitPips * pipSize, digits);
     }
   else
     {
      sl = NormalizeDouble(entryPrice + StopLossPips * pipSize, digits);
      tp = NormalizeDouble(entryPrice - TakeProfitPips * pipSize, digits);
     }
   return sl;
  }
//+------------------------------------------------------------------+
// Function to get the price and calculate TP dynamically
double CalculateTP(bool isBuyOrder,double entryPrice, string simbolo)
  {

   double pointSize = SymbolInfoDouble(simbolo, SYMBOL_POINT);
   int digits = (int)SymbolInfoInteger(simbolo, SYMBOL_DIGITS);
   double pipSize = pointSize * 10;


   if(isBuyOrder)
     {
      sl = NormalizeDouble(entryPrice - StopLossPips * pipSize, digits);
      tp = NormalizeDouble(entryPrice + TakeProfitPips * pipSize, digits);
     }
   else
     {
      sl = NormalizeDouble(entryPrice + StopLossPips * pipSize, digits);
      tp = NormalizeDouble(entryPrice - TakeProfitPips * pipSize, digits);
     }
   return tp;
  }
//+------------------------------------------------------------------+
// Function to handle errors and retry
bool TryOrderSend(MqlTradeRequest &request, MqlTradeResult &result)
  {
   for(int attempts = 0; attempts < 5; attempts++)
     {
      if(OrderSend(request, result))
        {
         return true;
        }
      else
        {
         Print("Failed to send order on attempt ", attempts + 1, ": Error ", GetLastError());
         Sleep(1000); // Pause before retrying to avoid 'context busy' errors
        }
     }
   return false;
  }
//+------------------------------------------------------------------+
Explicación del Asesor Experto
La estrategia
Ahora todos sabemos qué es el arbitraje triangular, pero he añadido al código una diferencia de cantidad mínima entre la predicción y el valor de cierre real, esta diferencia es el cambio de tasa porcentual entre esos dos valores, y puedes modificar esa cantidad con esta entrada:
input double perVar = 0.005; // Percentage of variation to make orders
*** Observe en el código que tiene esta lógica: ***
EUR       USD     | EUR  |^(-1)
----   x  ---  x  | ---- |
USD       JPY     | JPY  |
Todo está adaptado a esta lógica, por lo que si se utilizan otros pares, todo deberá modificarse.
Adjuntaré otro ejemplo (EURUSD - GBPUSD - EURGBP) para que puedas ver los cambios. Utiliza esta lógica:
EUR      | GBP |^(-1)    | EUR  |^(-1)
----   x | --- |      x  | ---- |
USD      | USD |         | GBP  |
Toda la estrategia se basa en que cuando multiplicas esa lógica, si es >1 puedes multiplicar en la dirección correcta, y si es <1 puedes multiplicar en la dirección izquierda.
Pero la estrategia de este Asesor Experto es que en lugar de utilizar los precios reales utilizaremos los precios previstos.
Esta lógica significa que si multiplicas por la derecha, multiplicas los precios, y si multiplicas por la inversa, es una división. A la izquierda es al revés. Puedes observar estos cambios en el código.
Los tamaños de los lotes deben seleccionarse de acuerdo al precio más alto, es por esto que en este EUR-USD-JPY el lote mínimo ronda los 2 o tres lotes.
La lógica para los tamaños de lotes es la siguiente:
   double lotSize2 = lotSize * predicted / predicted2;
   double lotSize3 = lotSize * predicted / predicted3;
Donde predicted es el precio predicho para EURUSD, predicted2 es el precio para USDJPY y predicted3 es el precio para EURJPY.
La última parte de esto es normalizar el tamaño del lote según los requisitos de los corredores.
lotSize2 = NormalizeDouble(lotSize2, 2);
lotSize3 = NormalizeDouble(lotSize3, 2);
Ejemplo
Para este ejemplo, utilizaremos los pares EUR-USD-JPY.
Con esta lógica:
EUR       USD     | EUR  |^(-1)
----   x  ---  x  | ---- |
USD       JPY     | JPY  |
Entrenaremos y realizaremos pruebas durante un período de tiempo de 200.000 minutos (tamaño de muestra), hasta el 3 de abril. Esto nos dará alrededor de 17 días de predicciones.
Entonces, la prueba en el probador de estrategias se desarrollará del 3 de abril al 21 del mismo mes y seleccionaremos el marco temporal de 1 minuto.
Para la primera prueba, utilizaremos estas entradas y configuraciones (seleccione cuidadosamente los símbolos a medida que se agregan al EA (OONX)):


Y estos son los resultados:
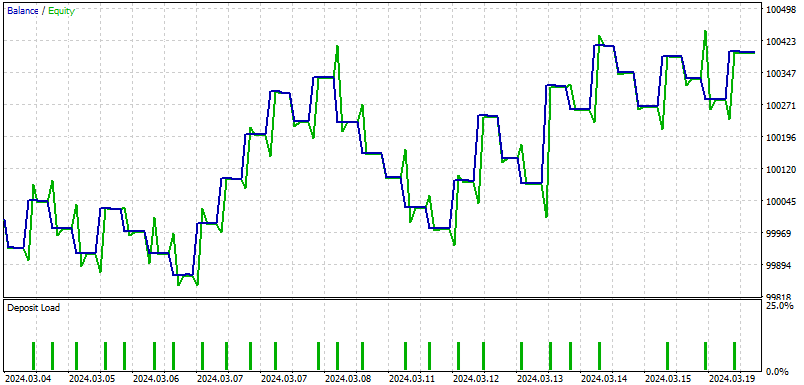
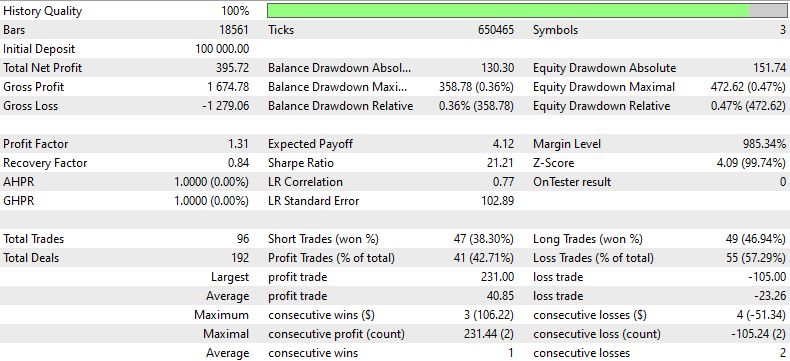
Esto es lo que resume un EA para los resultados de este backtesting:
Este informe de backtesting proporciona un análisis detallado del rendimiento de una estrategia comercial durante un período determinado utilizando datos históricos. La estrategia comenzó con un depósito inicial de $100,000 y terminó con una ganancia neta total de $395,72, a pesar de una pérdida bruta significativa de $1,279,06 en comparación con la ganancia bruta de $1,674,78. El factor de beneficio de 1,31 indica que el beneficio bruto superó la pérdida bruta en un 31%, lo que demuestra la capacidad de la estrategia para generar beneficios sobre pérdidas.
La estrategia ejecutó un total de 96 operaciones, con una división aproximadamente igual entre operaciones ganadoras y perdedoras, como lo indican los porcentajes de operaciones cortas ganadas (38,30%) y operaciones largas ganadas (46,94%). La estrategia tuvo más operaciones perdedoras en general (55 o 57,29%), lo que enfatiza la necesidad de mejorar la selección de operaciones o las estrategias de salida.
El factor de recuperación de 0,84 sugiere un riesgo moderado, ya que la estrategia recupera el 84% de la caída máxima. Además, la caída máxima fue relativamente alta, $358,78 (0,36% de la cuenta), lo que indica que si bien la estrategia fue rentable, también enfrentó caídas significativas de las que tuvo que recuperarse.
El backtest también mostró caídas sustanciales en términos de capital, con una caída máxima del capital del 0,47% de la cuenta. Esto, sumado al elevado ratio de 21,21, sugiere que los rendimientos fueron considerablemente mayores que el riesgo asumido, lo cual es positivo. Sin embargo, el bajo promedio de ganancias consecutivas (3 operaciones) versus el mayor promedio de pérdidas consecutivas (2 operaciones) sugieren que la estrategia podría beneficiarse al refinar su enfoque para mantener la consistencia en las operaciones ganadoras.
Conclusión
En este artículo, desglosamos el apasionante concepto del arbitraje triangular utilizando predicciones, todo a través de la plataforma MT5 fácil de usar y la programación Python. Imagina tener una fórmula secreta que te permita jugar un juego inteligente de cambio de divisas, convirtiendo dólares en euros, luego en yenes y nuevamente en dólares, con el objetivo de terminar con más de lo que comenzaste. Esto no es magia; se trata de utilizar modelos predictivos especiales llamados ONNX y arbitraje triangular, que aprenden de los precios de divisas pasados para predecir los futuros, guiando sus movimientos comerciales.
El artículo es muy útil para configurar todo, ya que muestra cómo instalar todas las herramientas que necesitará, como Python y Visual Studio Code, y cómo preparar su computadora para comenzar a realizar pruebas. El artículo lo explica en términos simples, asegurándose de que sepa cómo ajustar la estrategia independientemente de si su cuenta comercial es básica o sofisticada.
En general, este artículo es un recurso fantástico para cualquiera que quiera adentrarse en el juego del trading de divisas, utilizando algunas de las tecnologías más inteligentes disponibles. Lo guía a través de los detalles de la configuración y el funcionamiento de su sistema de trading, para que pueda probar suerte en el trading con una ventaja, gracias a lo último en inteligencia artificial y aprendizaje automático. Ya sea que seas un novato en codificación o trading, esta guía te respalda y te muestra paso a paso cómo dar el salto digital al trading automatizado.
Espero que disfrutes leyendo este artículo tanto como yo lo hice haciéndolo.
Traducción del inglés realizada por MetaQuotes Ltd.
Artículo original: https://www.mql5.com/en/articles/14873
Advertencia: todos los derechos de estos materiales pertenecen a MetaQuotes Ltd. Queda totalmente prohibido el copiado total o parcial.
Este artículo ha sido escrito por un usuario del sitio web y refleja su punto de vista personal. MetaQuotes Ltd. no se responsabiliza de la exactitud de la información ofrecida, ni de las posibles consecuencias del uso de las soluciones, estrategias o recomendaciones descritas.
 Redes neuronales: así de sencillo (Parte 84): Normalización reversible (RevIN)
 Características del Wizard MQL5 que debe conocer (Parte 19): Inferencia bayesiana
 Características del Wizard MQL5 que debe conocer (Parte 20): Regresión simbólica
 Red neuronal en la práctica: La primera neurona
- Aplicaciones de trading gratuitas
- 8 000+ señales para copiar
- Noticias económicas para analizar los mercados financieros
Usted acepta la política del sitio web y las condiciones de uso
Minmax lo que hace es normalizar (quiere decir: en vez de usar valores de precio, usa valores de a a b) entre 0 y 1.
No entiendo lo otro q, por favor expliquen con detalles (hace tiempo q hice este articulo).
Hola,
Si pudieras pegar los detalles de la q, podría resolverlos más rápido (hice el artículo hace mucho tiempo).
Por lo que recuerdo, no se puede usar el mismo tamaño de lote. La razón es que los pares utilizados tienen diferente precio.
Minmax hace lo que hace: normaliza (es decir: utiliza valores de a a b en lugar de valores de precio) entre 0 y 1.
No entiendo los otros q, por favor explique más (hace mucho tiempo que hice este artículo).
¿Qué necesidad hay de instalar Visual Studio Code?
¿Qué necesidad hay de instalar Visual Studio Code?
para los primeros usuarios ... es una buena idea