
Arbitragem triangular com previsões
Introdução
Este artigo é sobre a estratégia de arbitragem triangular. Ele contém um exemplo de duas arbitragens triangulares que são baseadas em modelos de deep learning. Esses modelos e o EA utilizado estão disponíveis nos anexos do artigo. Arbitragem triangular aproveita discrepâncias nas taxas de câmbio para gerar lucros sem risco.
O que é arbitragem triangular?
A arbitragem é muito curiosa, ela foi proibida entre os corretores de apostas esportivas. Imagine que você tenha uma odd de 1,25 para o Real Madrid vencer a Champions 2024, e o Borussia Dortmund tenha uma odd de 3,60. Isso significa que o Madrid tem 100/1,25 = 80% de chances de ganhar e o Borussia 27,7% de chances de vencer. Se você somar essas duas, terá 107,7%. Isso acontece porque os corretores querem ganhar dinheiro, e esse valor acima de 100% é sua comissão. Mas, imagine que você encontre o Corretor número 2, que oferece odds para o Borussia com 19% de chances de vitória, odds de 5,26. Então, você poderia apostar no Corretor 1 para o Real Madrid e no Corretor 2 para o Borussia, e se você apostar a quantidade apropriada em cada equipe, ganhará dinheiro no jogo, pois as probabilidades somam menos de 100%. Esta é uma maneira simples de explicar por que é proibido nas apostas esportivas e o que é arbitragem.
Agora, imagine que você é uma pessoa "legal" e não quer que sua conta de apostas esportivas seja fechada por fazer arbitragem. Mesmo se você apostar no Madrid, poderia fazer arbitragem "legal" se esperasse até o minuto 70' do jogo ou até o Real Madrid marcar para ter essas odds para o Borussia e garantir uma vitória... isso parece um pouco arriscado, mas aqui é onde podemos aproveitar o aprendizado profundo (Deep Learning). Sabemos que o Real Madrid vai marcar, então você terá essas odds com 98% de probabilidades (sabemos disso com cointegração entre as previsões e os valores reais). Isso é o que há de novo com o Deep Learning e a Arbitragem.
Agora que sabemos o que é arbitragem e como ganhamos mais com a ajuda do Deep Learning, o que é arbitragem triangular? Bem, é o mesmo que arbitragem, mas usando três pares. Por quê? Porque é usada no mercado forex e em criptomoedas, que usam esta fórmula para um símbolo A / B, e se você tiver que resolver isso, precisará de três equações (A / B) * (B / C) * (C / A), então, quando isso for > 1 você multiplica do jeito certo, e quando < 1, do jeito contrário.
Por que você pode ou não pode fazer arbitragem triangular com todas as contas?
Why can or can't you do triangular arbitrage with all accounts?
Se você tiver uma conta de spread zero, a arbitragem triangular seria feita em um segundo ou menos. Se você tiver spread, é impossível superar o spread em tempos tão curtos. Mas, como eu disse antes, não se preocupe, este EA é realmente lucrativo de ambas as formas. Minha conta não é de spread zero, então este artigo terá um exemplo com spreads.
O que precisamos para este EA?
Este EA usa previsões feitas em python para modelos ONNX para usá-los em EAs do MT5. Por isso, vou passar por todo o processo para garantir que todos possam usar este EA. Se você souber como criar um modelo ONNX, pode pular para a parte do EA.
Você precisará instalar pela primeira vez:
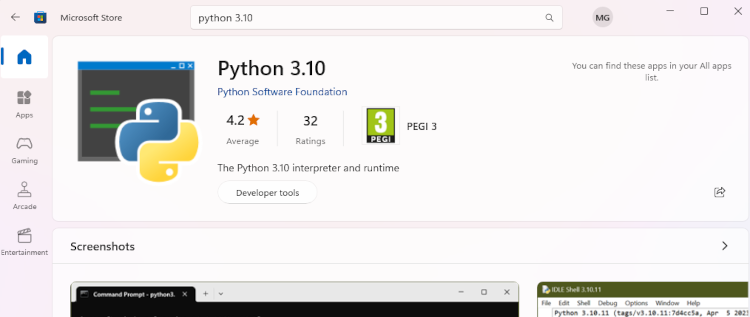
- Python 3.10
Você pode encontrar isso na Microsoft Store, basta clicar em instalar.
- Código do Visual Studio
Você pode encontrá-lo na Loja da Microsoft, basta clicar em instalar e ele fará tudo por você.

Depois disso, você precisa instalar Visual Studio 2019 ou C++ daqui (será solicitado para ser instalado com uma biblioteca do python):
https://learn.microsoft.com/en-US/cpp/windows/latest-supported-vc-redist?view=msvc-170#visual-studio-2015-2017-2019-and-2022 Depois que isso for feito, você deve adicionar a pasta de scripts do python às variáveis de caminho. Você também deve adicionar ".py" ao PATHEXT.
Depois de tudo isso feito, podemos agora instalar as bibliotecas, assim.
Abra o VSC -> Terminal -> Novo Terminal.
O VSC pode pedir para instalar extensões do python (basta clicar em OK). E basta copiar e colar isso (e pressionar Enter):
pip install MetaTrader5==5.0.4200
pip install pandas==2.2.1
pip install scipy==1.12.0
pip install statsmodels==0.14.1
pip install numpy==1.26.4
pip install tensorflow==2.15.0
pip install tf2onnx==1.16.1
pip install scikit-learn==1.4.1.post1
pip install keras==2.15.0
pip install matplotlib==3.8.3
Não deve haver erros, se houver, você pode perguntar aqui.
Uma vez que todas as partes necessárias estejam instaladas e sem erros, podemos prosseguir para o modelo de teste .py. Vou copiar e colar este exemplo:
# python libraries
import MetaTrader5 as mt5
import tensorflow as tf
import numpy as np
import pandas as pd
import tf2onnx
from datetime import timedelta, datetime
# input parameters

symbol1 = "EURGBP"
symbol2 = "GBPUSD"
symbol3 = "EURUSD"
sample_size1 = 200000
optional = "_M1_test"
timeframe = mt5.TIMEFRAME_M1

#end_date = datetime.now()
end_date = datetime(2024, 3, 4, 0)

inp_history_size = 120

sample_size = sample_size1
symbol = symbol1
optional = optional
inp_model_name = str(symbol)+"_"+str(optional)+".onnx"

if not mt5.initialize():
    print("initialize() failed, error code =",mt5.last_error())
    quit()

# we will save generated onnx-file near our script to use as resource
from sys import argv
data_path=argv[0]
last_index=data_path.rfind("\\")+1
data_path=data_path[0:last_index]
print("data path to save onnx model",data_path)

# and save to MQL5\Files folder to use as file
terminal_info=mt5.terminal_info()
file_path=terminal_info.data_path+"\\MQL5\\Files\\"
print("file path to save onnx model",file_path)

# set start and end dates for history data

#end_date = datetime.now()
#end_date = datetime(2024, 5, 1, 0)
start_date = end_date - timedelta(days=inp_history_size*20)

# print start and end dates
print("data start date =",start_date)
print("data end date =",end_date)

# get rates
eurusd_rates = mt5.copy_rates_from(symbol, timeframe , end_date, sample_size )

# create dataframe
df=pd.DataFrame()
df = pd.DataFrame(eurusd_rates)
print(df)
# Extraer los precios de cierre directamente
datas = df['close'].values

"""# Calcular la inversa de cada valor
inverted_data = 1 / datas

# Convertir los datos invertidos a un array de numpy si es necesario
data = inverted_data.values"""

data = datas.reshape(-1,1)
# Imprimir los resultados
"""data = datas"""
# scale data
from sklearn.preprocessing import MinMaxScaler
scaler=MinMaxScaler(feature_range=(0,1))
scaled_data = scaler.fit_transform(data)

# training size is 80% of the data
training_size = int(len(scaled_data)*0.80)
print("Training_size:",training_size)
train_data_initial = scaled_data[0:training_size,:]
test_data_initial = scaled_data[training_size:,:1]

# split a univariate sequence into samples
def split_sequence(sequence, n_steps):
    X, y = list(), list()
    for i in range(len(sequence)):
       # find the end of this pattern
       end_ix = i + n_steps
       # check if we are beyond the sequence
       if end_ix > len(sequence)-1:
          break
       # gather input and output parts of the pattern
       seq_x, seq_y = sequence[i:end_ix], sequence[end_ix]
       X.append(seq_x)
       y.append(seq_y)
    return np.array(X), np.array(y)

# split into samples
time_step = inp_history_size
x_train, y_train = split_sequence(train_data_initial, time_step)
x_test, y_test = split_sequence(test_data_initial, time_step)

# reshape input to be [samples, time steps, features] which is required for LSTM
x_train =x_train.reshape(x_train.shape[0],x_train.shape[1],1)
x_test = x_test.reshape(x_test.shape[0],x_test.shape[1],1)


# define model
from keras.models import Sequential
from keras.layers import Dense, Activation, Conv1D, MaxPooling1D, Dropout, Flatten, LSTM
from keras.metrics import RootMeanSquaredError as rmse
from tensorflow.keras import callbacks
model = Sequential()
model.add(Conv1D(filters=256, kernel_size=2, activation='relu',padding = 'same',input_shape=(inp_history_size,1)))
model.add(MaxPooling1D(pool_size=2))
model.add(LSTM(100, return_sequences = True))
model.add(Dropout(0.3))
model.add(LSTM(100, return_sequences = False))
model.add(Dropout(0.3))
model.add(Dense(units=1, activation = 'sigmoid'))
model.compile(optimizer='adam', loss= 'mse' , metrics = [rmse()])

# Set up early stopping
early_stopping = callbacks.EarlyStopping(
    monitor='val_loss',
    patience=5,
    restore_best_weights=True,
)

# model training for 300 epochs
history = model.fit(x_train, y_train, epochs = 300 , validation_data = (x_test,y_test), batch_size=32, callbacks=[early_stopping], verbose=2)

# evaluate training data
train_loss, train_rmse = model.evaluate(x_train,y_train, batch_size = 32)
print(f"train_loss={train_loss:.3f}")
print(f"train_rmse={train_rmse:.3f}")

# evaluate testing data
test_loss, test_rmse = model.evaluate(x_test,y_test, batch_size = 32)
print(f"test_loss={test_loss:.3f}")
print(f"test_rmse={test_rmse:.3f}")

# save model to ONNX
output_path = data_path+inp_model_name
onnx_model = tf2onnx.convert.from_keras(model, output_path=output_path)
print(f"saved model to {output_path}")

output_path = file_path+inp_model_name
onnx_model = tf2onnx.convert.from_keras(model, output_path=output_path)
print(f"saved model to {output_path}")

# finish
mt5.shutdown()
#prediction using testing data

#prediction using testing data
test_predict = model.predict(x_test)
print(test_predict)
print("longitud total de la prediccion: ", len(test_predict))
print("longitud total del sample: ", sample_size)

plot_y_test = np.array(y_test).reshape(-1, 1)  # Selecciona solo el último elemento de cada muestra de prueba
plot_y_train = y_train.reshape(-1,1)
train_predict = model.predict(x_train)
#print(plot_y_test)

#calculate metrics
from sklearn import metrics
from sklearn.metrics import r2_score
#transform data to real values
value1=scaler.inverse_transform(plot_y_test)
#print(value1)
# Escala las predicciones inversas al transformarlas a la escala original
value2 = scaler.inverse_transform(test_predict.reshape(-1, 1))
#print(value2)
#calc score
score = np.sqrt(metrics.mean_squared_error(value1,value2))

print("RMSE         : {}".format(score))
print("MSE          :", metrics.mean_squared_error(value1,value2))
print("R2 score     :",metrics.r2_score(value1,value2))


#sumarize model
model.summary()

#Print error
value11=pd.DataFrame(value1)
value22=pd.DataFrame(value2)
#print(value11)
#print(value22)


value111=value11.iloc[:,:]
value222=value22.iloc[:,:]

print("longitud salida (tandas de 1 minuto): ",len(value111) )
#print("en horas son " + str((len(value111))*60*24)+ " minutos")
print("en horas son " + str(((len(value111)))/60)+ " horas")
print("en horas son " + str(((len(value111)))/60/24)+ " dias")


# Calculate error
error = value111 - value222

import matplotlib.pyplot as plt
# Plot error
plt.figure(figsize=(10, 6))
plt.scatter(range(len(error)), error, color='blue', label='Error')
plt.axhline(y=0, color='red', linestyle='--', linewidth=1)  # Línea horizontal en y=0
plt.title('Error de Predicción ' + str(symbol))
plt.xlabel('Índice de la muestra')
plt.ylabel('Error')
plt.legend()
plt.grid(True)
plt.savefig(str(symbol)+str(optional)+'.png')

rmse_ = format(score)
mse_ = metrics.mean_squared_error(value1,value2)
r2_ = metrics.r2_score(value1,value2)

resultados= [rmse_,mse_,r2_]

# Abre un archivo en modo escritura
with open(str(symbol)+str(optional)+"results.txt", "w") as archivo:
    # Escribe cada resultado en una línea separada
    for resultado in resultados:
        archivo.write(str(resultado) + "\n")

# finish
mt5.shutdown()

#show iteration-rmse graph for training and validation
plt.figure(figsize = (18,10))
plt.plot(history.history['root_mean_squared_error'],label='Training RMSE',color='b')
plt.plot(history.history['val_root_mean_squared_error'],label='Validation-RMSE',color='g')
plt.xlabel("Iteration")
plt.ylabel("RMSE")
plt.title("RMSE" + str(symbol))
plt.legend()
plt.savefig(str(symbol)+str(optional)+'1.png')

#show iteration-loss graph for training and validation
plt.figure(figsize = (18,10))
plt.plot(history.history['loss'],label='Training Loss',color='b')
plt.plot(history.history['val_loss'],label='Validation-loss',color='g')
plt.xlabel("Iteration")
plt.ylabel("Loss")
plt.title("LOSS" + str(symbol))
plt.legend()
plt.savefig(str(symbol)+str(optional)+'2.png')

#show actual vs predicted (training) graph
plt.figure(figsize=(18,10))
plt.plot(scaler.inverse_transform(plot_y_train),color = 'b', label = 'Original')
plt.plot(scaler.inverse_transform(train_predict),color='red', label = 'Predicted')
plt.title("Prediction Graph Using Training Data" + str(symbol))
plt.xlabel("Hours")
plt.ylabel("Price")
plt.legend()
plt.savefig(str(symbol)+str(optional)+'3.png')

#show actual vs predicted (testing) graph
plt.figure(figsize=(18,10))
plt.plot(scaler.inverse_transform(plot_y_test),color = 'b',  label = 'Original')
plt.plot(scaler.inverse_transform(test_predict),color='g', label = 'Predicted')
plt.title("Prediction Graph Using Testing Data" + str(symbol))
plt.xlabel("Hours")
plt.ylabel("Price")
plt.legend()
plt.savefig(str(symbol)+str(optional)+'4.png')


################################################################################################ EURJPY 1


# python libraries
import MetaTrader5 as mt5
import tensorflow as tf
import numpy as np
import pandas as pd
import tf2onnx

# input parameters

inp_history_size = 120

sample_size = sample_size1
symbol = symbol2
optional = optional
inp_model_name = str(symbol)+"_"+str(optional)+".onnx"

if not mt5.initialize():
    print("initialize() failed, error code =",mt5.last_error())
    quit()

# we will save generated onnx-file near our script to use as resource
from sys import argv
data_path=argv[0]
last_index=data_path.rfind("\\")+1
data_path=data_path[0:last_index]
print("data path to save onnx model",data_path)

# and save to MQL5\Files folder to use as file
terminal_info=mt5.terminal_info()
file_path=terminal_info.data_path+"\\MQL5\\Files\\"
print("file path to save onnx model",file_path)

# set start and end dates for history data
from datetime import timedelta, datetime
#end_date = datetime.now()
#end_date = datetime(2024, 5, 1, 0)
start_date = end_date - timedelta(days=inp_history_size*20)

# print start and end dates
print("data start date =",start_date)
print("data end date =",end_date)

# get rates
eurusd_rates2 = mt5.copy_rates_from(symbol, timeframe ,  end_date, sample_size)
# create dataframe
df=pd.DataFrame()
df2 = pd.DataFrame(eurusd_rates2)
print(df2)
# Extraer los precios de cierre directamente
datas2 = df2['close'].values

"""inverted_data = 1 / datas

# Convertir los datos invertidos a un array de numpy si es necesario
data = inverted_data.values"""
data2 = datas2.reshape(-1,1)


# Convertir los datos invertidos a un array de numpy si es necesario
#data = datas.values

# Imprimir los resultados

# scale data
from sklearn.preprocessing import MinMaxScaler
scaler2=MinMaxScaler(feature_range=(0,1))
scaled_data2 = scaler2.fit_transform(data2)

# training size is 80% of the data
training_size2 = int(len(scaled_data2)*0.80)
print("Training_size:",training_size2)
train_data_initial2 = scaled_data2[0:training_size2,:]
test_data_initial2 = scaled_data2[training_size2:,:1]

# split a univariate sequence into samples
def split_sequence(sequence, n_steps):
    X, y = list(), list()
    for i in range(len(sequence)):
       # find the end of this pattern
       end_ix = i + n_steps
       # check if we are beyond the sequence
       if end_ix > len(sequence)-1:
          break
       # gather input and output parts of the pattern
       seq_x, seq_y = sequence[i:end_ix], sequence[end_ix]
       X.append(seq_x)
       y.append(seq_y)
    return np.array(X), np.array(y)

# split into samples
time_step = inp_history_size
x_train2, y_train2 = split_sequence(train_data_initial2, time_step)
x_test2, y_test2 = split_sequence(test_data_initial2, time_step)

# reshape input to be [samples, time steps, features] which is required for LSTM
x_train2 =x_train2.reshape(x_train2.shape[0],x_train2.shape[1],1)
x_test2 = x_test2.reshape(x_test2.shape[0],x_test2.shape[1],1)


# define model
from keras.models import Sequential
from keras.layers import Dense, Activation, Conv1D, MaxPooling1D, Dropout, Flatten, LSTM
from keras.metrics import RootMeanSquaredError as rmse
from tensorflow.keras import callbacks
model = Sequential()
model.add(Conv1D(filters=256, kernel_size=2, activation='relu',padding = 'same',input_shape=(inp_history_size,1)))
model.add(MaxPooling1D(pool_size=2))
model.add(LSTM(100, return_sequences = True))
model.add(Dropout(0.3))
model.add(LSTM(100, return_sequences = False))
model.add(Dropout(0.3))
model.add(Dense(units=1, activation = 'sigmoid'))
model.compile(optimizer='adam', loss= 'mse' , metrics = [rmse()])

# Set up early stopping
early_stopping = callbacks.EarlyStopping(
    monitor='val_loss',
    patience=5,
    restore_best_weights=True,
)

# model training for 300 epochs
history2 = model.fit(x_train2, y_train2, epochs = 300 , validation_data = (x_test2,y_test2), batch_size=32, callbacks=[early_stopping], verbose=2)

# evaluate training data
train_loss2, train_rmse2 = model.evaluate(x_train2,y_train2, batch_size = 32)
print(f"train_loss={train_loss2:.3f}")
print(f"train_rmse={train_rmse2:.3f}")

# evaluate testing data
test_loss2, test_rmse2 = model.evaluate(x_test2,y_test2, batch_size = 32)
print(f"test_loss={test_loss2:.3f}")
print(f"test_rmse={test_rmse2:.3f}")

# save model to ONNX
output_path = data_path+inp_model_name
onnx_model = tf2onnx.convert.from_keras(model, output_path=output_path)
print(f"saved model to {output_path}")

output_path = file_path+inp_model_name
onnx_model = tf2onnx.convert.from_keras(model, output_path=output_path)
print(f"saved model to {output_path}")

# finish
mt5.shutdown()
#prediction using testing data

#prediction using testing data
test_predict2 = model.predict(x_test2)
print(test_predict2)
print("longitud total de la prediccion: ", len(test_predict2))
print("longitud total del sample: ", sample_size)

plot_y_test2 = np.array(y_test2).reshape(-1, 1)  # Selecciona solo el último elemento de cada muestra de prueba
plot_y_train2 = y_train2.reshape(-1,1)
train_predict2 = model.predict(x_train2)
#print(plot_y_test)

#calculate metrics
from sklearn import metrics
from sklearn.metrics import r2_score
#transform data to real values
value12=scaler2.inverse_transform(plot_y_test2)
#print(value1)
# Escala las predicciones inversas al transformarlas a la escala original
value22 = scaler2.inverse_transform(test_predict2.reshape(-1, 1))
#print(value2)
#calc score
score2 = np.sqrt(metrics.mean_squared_error(value12,value22))

print("RMSE         : {}".format(score2))
print("MSE          :", metrics.mean_squared_error(value12,value22))
print("R2 score     :",metrics.r2_score(value12,value22))


#sumarize model
model.summary()

#Print error
value112=pd.DataFrame(value12)
value222=pd.DataFrame(value22)
#print(value11)
#print(value22)


value1112=value112.iloc[:,:]
value2222=value222.iloc[:,:]

print("longitud salida (tandas de 1 min): ",len(value1112) )
#print("en horas son " + str((len(value1112))*60*24)+ " minutos")
print("en horas son " + str(((len(value1112)))/60)+ " horas")
print("en horas son " + str(((len(value1112)))/60/24)+ " dias")


# Calculate error
error2 = value1112 - value2222

import matplotlib.pyplot as plt
# Plot error
plt.figure(figsize=(10, 6))
plt.scatter(range(len(error2)), error2, color='blue', label='Error')
plt.axhline(y=0, color='red', linestyle='--', linewidth=1)  # Línea horizontal en y=0
plt.title('Error de Predicción ' + str(symbol))
plt.xlabel('Índice de la muestra')
plt.ylabel('Error')
plt.legend()
plt.grid(True)
plt.savefig(str(symbol)+str(optional)+'.png')

rmse_2 = format(score2)
mse_2 = metrics.mean_squared_error(value12,value22)
r2_2 = metrics.r2_score(value12,value22)

resultados2= [rmse_2,mse_2,r2_2]

# Abre un archivo en modo escritura
with open(str(symbol)+str(optional)+"results.txt", "w") as archivo:
    # Escribe cada resultado en una línea separada
    for resultado in resultados2:
        archivo.write(str(resultado) + "\n")

# finish
mt5.shutdown()

#show iteration-rmse graph for training and validation
plt.figure(figsize = (18,10))
plt.plot(history2.history['root_mean_squared_error'],label='Training RMSE',color='b')
plt.plot(history2.history['val_root_mean_squared_error'],label='Validation-RMSE',color='g')
plt.xlabel("Iteration")
plt.ylabel("RMSE")
plt.title("RMSE" + str(symbol))
plt.legend()
plt.savefig(str(symbol)+str(optional)+'1.png')

#show iteration-loss graph for training and validation
plt.figure(figsize = (18,10))
plt.plot(history2.history['loss'],label='Training Loss',color='b')
plt.plot(history2.history['val_loss'],label='Validation-loss',color='g')
plt.xlabel("Iteration")
plt.ylabel("Loss")
plt.title("LOSS" + str(symbol))
plt.legend()
plt.savefig(str(symbol)+str(optional)+'2.png')

#show actual vs predicted (training) graph
plt.figure(figsize=(18,10))
plt.plot(scaler2.inverse_transform(plot_y_train2),color = 'b', label = 'Original')
plt.plot(scaler2.inverse_transform(train_predict2),color='red', label = 'Predicted')
plt.title("Prediction Graph Using Training Data" + str(symbol))
plt.xlabel("Hours")
plt.ylabel("Price")
plt.legend()
plt.savefig(str(symbol)+str(optional)+'3.png')

#show actual vs predicted (testing) graph
plt.figure(figsize=(18,10))
plt.plot(scaler2.inverse_transform(plot_y_test2),color = 'b',  label = 'Original')
plt.plot(scaler2.inverse_transform(test_predict2),color='g', label = 'Predicted')
plt.title("Prediction Graph Using Testing Data" + str(symbol))
plt.xlabel("Hours")
plt.ylabel("Price")
plt.legend()
plt.savefig(str(symbol)+str(optional)+'4.png')


##############################################################################################  JPYUSD


# python libraries
import MetaTrader5 as mt5
import tensorflow as tf
import numpy as np
import pandas as pd
import tf2onnx

# input parameters

inp_history_size = 120

sample_size = sample_size1
symbol = symbol3
optional = optional
inp_model_name = str(symbol)+"_"+str(optional)+".onnx"

if not mt5.initialize():
    print("initialize() failed, error code =",mt5.last_error())
    quit()

# we will save generated onnx-file near our script to use as resource
from sys import argv
data_path=argv[0]
last_index=data_path.rfind("\\")+1
data_path=data_path[0:last_index]
print("data path to save onnx model",data_path)

# and save to MQL5\Files folder to use as file
terminal_info=mt5.terminal_info()
file_path=terminal_info.data_path+"\\MQL5\\Files\\"
print("file path to save onnx model",file_path)

# set start and end dates for history data
from datetime import timedelta, datetime
#end_date = datetime.now()
#end_date = datetime(2024, 5, 1, 0)
start_date = end_date - timedelta(days=inp_history_size*20)

# print start and end dates
print("data start date =",start_date)
print("data end date =",end_date)

# get rates
eurusd_rates3 = mt5.copy_rates_from(symbol, timeframe ,  end_date, sample_size)
# create dataframe
df3=pd.DataFrame()
df3 = pd.DataFrame(eurusd_rates3)
print(df3)
# Extraer los precios de cierre directamente
datas3 = df3['close'].values

"""# Calcular la inversa de cada valor
inverted_data = 1 / datas

# Convertir los datos invertidos a un array de numpy si es necesario
data = inverted_data.values"""
data3 = datas3.reshape(-1,1)
# Imprimir los resultados
"""data = datas"""
# scale data
from sklearn.preprocessing import MinMaxScaler
scaler3=MinMaxScaler(feature_range=(0,1))
scaled_data3 = scaler3.fit_transform(data3)

# training size is 80% of the data
training_size3 = int(len(scaled_data3)*0.80)
print("Training_size:",training_size3)
train_data_initial3 = scaled_data3[0:training_size3,:]
test_data_initial3 = scaled_data3[training_size3:,:1]

# split a univariate sequence into samples
def split_sequence(sequence, n_steps):
    X, y = list(), list()
    for i in range(len(sequence)):
       # find the end of this pattern
       end_ix = i + n_steps
       # check if we are beyond the sequence
       if end_ix > len(sequence)-1:
          break
       # gather input and output parts of the pattern
       seq_x, seq_y = sequence[i:end_ix], sequence[end_ix]
       X.append(seq_x)
       y.append(seq_y)
    return np.array(X), np.array(y)

# split into samples
time_step = inp_history_size
x_train3, y_train3 = split_sequence(train_data_initial3, time_step)
x_test3, y_test3 = split_sequence(test_data_initial3, time_step)

# reshape input to be [samples, time steps, features] which is required for LSTM
x_train3 =x_train3.reshape(x_train3.shape[0],x_train3.shape[1],1)
x_test3 = x_test3.reshape(x_test3.shape[0],x_test3.shape[1],1)


# define model
from keras.models import Sequential
from keras.layers import Dense, Activation, Conv1D, MaxPooling1D, Dropout, Flatten, LSTM
from keras.metrics import RootMeanSquaredError as rmse
from tensorflow.keras import callbacks
model = Sequential()
model.add(Conv1D(filters=256, kernel_size=2, activation='relu',padding = 'same',input_shape=(inp_history_size,1)))
model.add(MaxPooling1D(pool_size=2))
model.add(LSTM(100, return_sequences = True))
model.add(Dropout(0.3))
model.add(LSTM(100, return_sequences = False))
model.add(Dropout(0.3))
model.add(Dense(units=1, activation = 'sigmoid'))
model.compile(optimizer='adam', loss= 'mse' , metrics = [rmse()])

# Set up early stopping
early_stopping = callbacks.EarlyStopping(
    monitor='val_loss',
    patience=5,
    restore_best_weights=True,
)

# model training for 300 epochs
history3 = model.fit(x_train3, y_train3, epochs = 300 , validation_data = (x_test3,y_test3), batch_size=32, callbacks=[early_stopping], verbose=2)

# evaluate training data
train_loss3, train_rmse3 = model.evaluate(x_train3,y_train3, batch_size = 32)
print(f"train_loss={train_loss3:.3f}")
print(f"train_rmse={train_rmse3:.3f}")

# evaluate testing data
test_loss3, test_rmse3 = model.evaluate(x_test3,y_test3, batch_size = 32)
print(f"test_loss={test_loss3:.3f}")
print(f"test_rmse={test_rmse3:.3f}")

# save model to ONNX
output_path = data_path+inp_model_name
onnx_model = tf2onnx.convert.from_keras(model, output_path=output_path)
print(f"saved model to {output_path}")

output_path = file_path+inp_model_name
onnx_model = tf2onnx.convert.from_keras(model, output_path=output_path)
print(f"saved model to {output_path}")

# finish
mt5.shutdown()
#prediction using testing data

#prediction using testing data
test_predict3 = model.predict(x_test3)
print(test_predict3)
print("longitud total de la prediccion: ", len(test_predict3))
print("longitud total del sample: ", sample_size)

plot_y_test3 = np.array(y_test3).reshape(-1, 1)  # Selecciona solo el último elemento de cada muestra de prueba
plot_y_train3 = y_train3.reshape(-1,1)
train_predict3 = model.predict(x_train3)
#print(plot_y_test)

#calculate metrics
from sklearn import metrics
from sklearn.metrics import r2_score
#transform data to real values
value13=scaler3.inverse_transform(plot_y_test3)
#print(value1)
# Escala las predicciones inversas al transformarlas a la escala original
value23 = scaler3.inverse_transform(test_predict3.reshape(-1, 1))
#print(value2)
#calc score
score3 = np.sqrt(metrics.mean_squared_error(value13,value23))

print("RMSE         : {}".format(score3))
print("MSE          :", metrics.mean_squared_error(value13,value23))
print("R2 score     :",metrics.r2_score(value13,value23))


#sumarize model
model.summary()

#Print error
value113=pd.DataFrame(value13)
value223=pd.DataFrame(value23)
#print(value11)
#print(value22)


value1113=value113.iloc[:,:]
value2223=value223.iloc[:,:]

print("longitud salida (tandas de 1 hora): ",len(value1113) )
#print("en horas son " + str((len(value1113))*60*24)+ " minutos")
print("en horas son " + str(((len(value1113)))/60)+ " horas")
print("en horas son " + str(((len(value1113)))/60/24)+ " dias")


# Calculate error
error3 = value1113 - value2223

import matplotlib.pyplot as plt
# Plot error
plt.figure(figsize=(10, 6))
plt.scatter(range(len(error3)), error3, color='blue', label='Error')
plt.axhline(y=0, color='red', linestyle='--', linewidth=1)  # Línea horizontal en y=0
plt.title('Error de Predicción ' + str(symbol))
plt.xlabel('Índice de la muestra')
plt.ylabel('Error')
plt.legend()
plt.grid(True)
plt.savefig(str(symbol)+str(optional)+'.png')

rmse_3 = format(score3)
mse_3 = metrics.mean_squared_error(value13,value23)
r2_3 = metrics.r2_score(value13,value23)

resultados3= [rmse_3,mse_3,r2_3]

# Abre un archivo en modo escritura
with open(str(symbol)+str(optional)+"results.txt", "w") as archivo:
    # Escribe cada resultado en una línea separada
    for resultado in resultados3:
        archivo.write(str(resultado) + "\n")

# finish
mt5.shutdown()

#show iteration-rmse graph for training and validation
plt.figure(figsize = (18,10))
plt.plot(history3.history['root_mean_squared_error'],label='Training RMSE',color='b')
plt.plot(history3.history['val_root_mean_squared_error'],label='Validation-RMSE',color='g')
plt.xlabel("Iteration")
plt.ylabel("RMSE")
plt.title("RMSE" + str(symbol))
plt.legend()
plt.savefig(str(symbol)+str(optional)+'1.png')

#show iteration-loss graph for training and validation
plt.figure(figsize = (18,10))
plt.plot(history3.history['loss'],label='Training Loss',color='b')
plt.plot(history3.history['val_loss'],label='Validation-loss',color='g')
plt.xlabel("Iteration")
plt.ylabel("Loss")
plt.title("LOSS" + str(symbol))
plt.legend()
plt.savefig(str(symbol)+str(optional)+'2.png')

#show actual vs predicted (training) graph
plt.figure(figsize=(18,10))
plt.plot(scaler3.inverse_transform(plot_y_train3),color = 'b', label = 'Original')
plt.plot(scaler3.inverse_transform(train_predict3),color='red', label = 'Predicted')
plt.title("Prediction Graph Using Training Data" + str(symbol))
plt.xlabel("Hours")
plt.ylabel("Price")
plt.legend()
plt.savefig(str(symbol)+str(optional)+'3.png')

#show actual vs predicted (testing) graph
plt.figure(figsize=(18,10))
plt.plot(scaler3.inverse_transform(plot_y_test3),color = 'b',  label = 'Original')
plt.plot(scaler3.inverse_transform(test_predict3),color='g', label = 'Predicted')
plt.title("Prediction Graph Using Testing Data" + str(symbol))
plt.xlabel("Hours")
plt.ylabel("Price")
plt.legend()
plt.savefig(str(symbol)+str(optional)+'4.png')

################################################################################################
##############################################################################################
"""
import onnxruntime as ort
import numpy as np

# Cargar el modelo ONNX
sesion = ort.InferenceSession("EURUSD_M1_inverse_test.onnx")

# Obtener el nombre de la entrada y la salida del modelo
input_name = sesion.get_inputs()[0].name
output_name = sesion.get_outputs()[0].name

# Crear datos de entrada de prueba como un array de numpy
# Asegúrate de que los datos de entrada coincidan con la forma y el tipo esperado por el modelo
input_data = [1,120] #np.random.rand(1, 10).astype(np.float32)  # Ejemplo: entrada de tamaño [1, 10]

# Realizar la inferencia
result = sesion.run([output_name], {input_name: input_data})

# Imprimir el resultado
print(result)
"""
Este .py criará três arquivos ONNX, além de alguns gráficos e dados para que você possa verificar se tudo está funcionando corretamente.
Os dados vêm em um arquivo txt, e cada número representa, respectivamente, RMSE, MSE e R2.
Antes de rodar este script, você deve especificar os símbolos, o tamanho da amostra, o timeframe e a data de término (a partir da qual os períodos serão contados para trás).
A variável opcional é uma string onde você pode adicionar algo como M1 Ticks ou a data de término... qualquer coisa que você queira para salvar os arquivos onnx, os gráficos e os dados.
symbol1 = "EURGBP"
symbol2 = "GBPUSD"
symbol3 = "EURUSD"
sample_size1 = 200000
optional = "_M1_test"
timeframe = mt5.TIMEFRAME_M1

#end_date = datetime.now()
end_date = datetime(2024, 3, 4, 0)
Se você quiser testar no strategy tester, modifique a data conforme necessário. Se você quiser negociar, basta usar esta data de término.
end_date = datetime.now() *** Se você estiver negociando em uma conta de spread zero, pode tentar usar ticks em vez de períodos; basta alterar: ***
eurusd_rates = mt5.copy_rates_from(symbol, timeframe , end_date, sample_size)
por este:
eurusd_rates = mt5.copy_ticks_from(symbol, end_date, sample_size, mt5.COPY_TICKS_ALL)
Aqui você terá Bid e Ask ticks. Acredito que haja uma limitação para o número de ticks. Se precisar de mais ticks, você pode baixar todos os ticks de um símbolo com este: Baixar todos os dados de um símbolo que é gratuito.
Para executar o arquivo .py, basta abri-lo com o VSC e clicar em RUN -> Run Without Debugging (com o MT5 aberto). Então, espere até que ele termine.
No final, você terá vários gráficos, arquivos txt e arquivos ONNX. Você deve salvar o arquivo ONNX na pasta MQL5/Files e especificar o mesmo caminho no código do EA.
Ainda fará esse trabalho graças a esta linha:
# and save to MQL5\Files folder to use as file
terminal_info=mt5.terminal_info()
file_path=terminal_info.data_path+"\\MQL5\\Files\\"
print("file path to save onnx model",file_path)
Observe que se você quiser ter muitos arquivos ONNX, que estão em outras pastas, você deve especificar o caminho.
Este .py exporta imagens como estas:
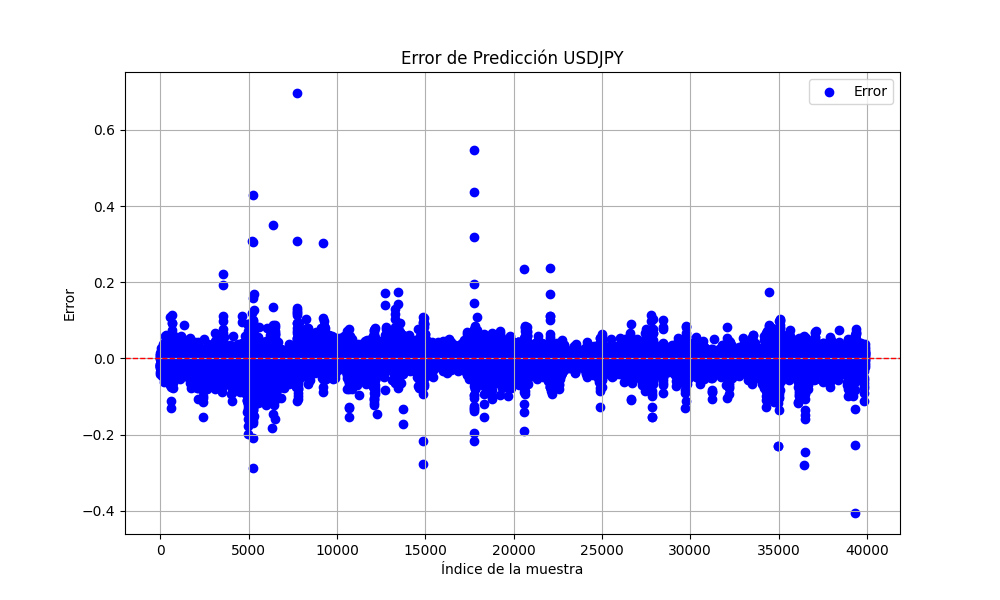
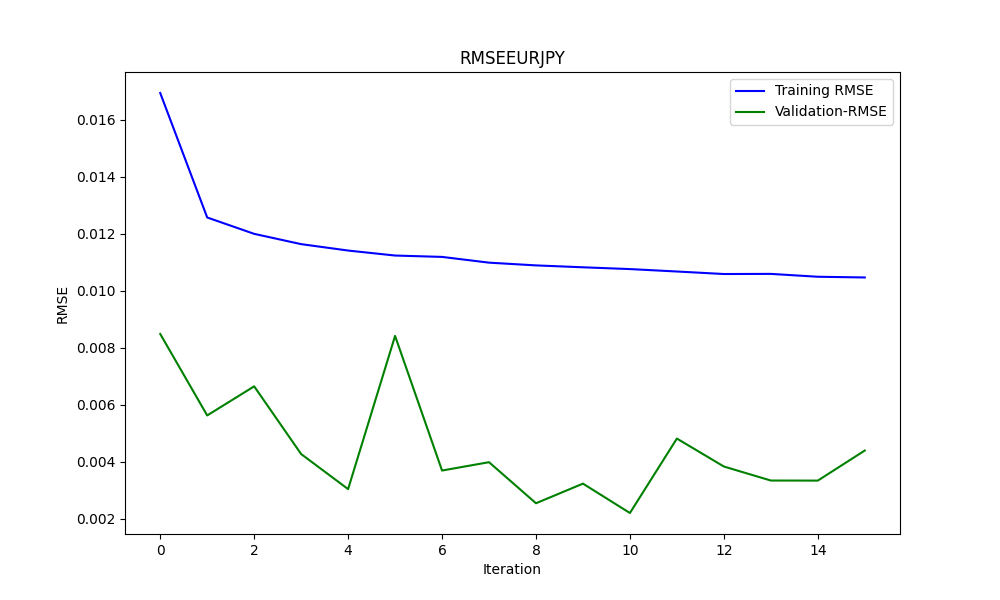
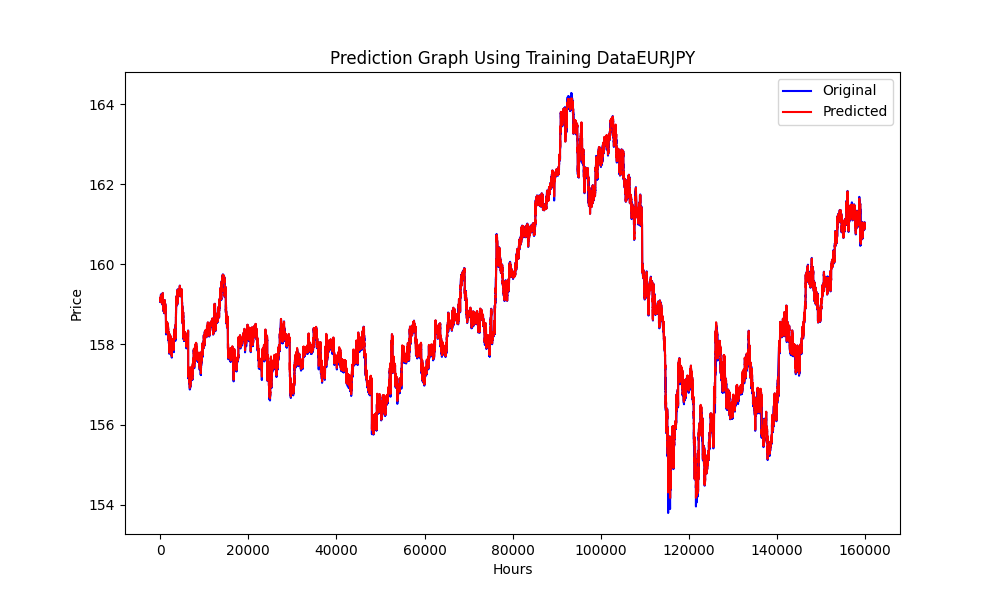
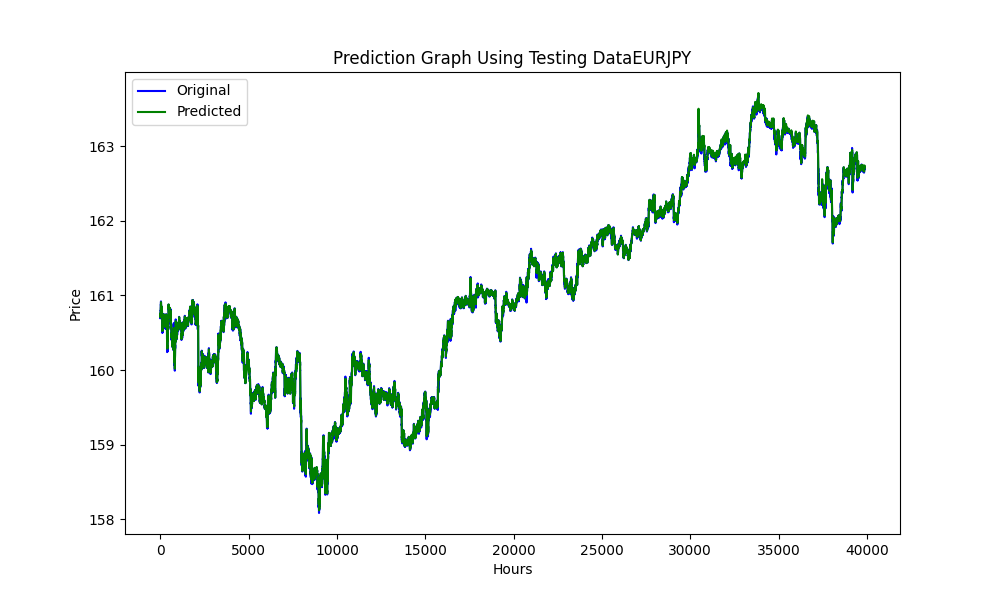
Esses gráficos com os valores de RMSE, MSE e R2:
0.023019903957086384
0.0005299159781934813
0.999707563612641
Com tudo isso, podemos saber se nossos modelos estão overfitted ou underfitted.
Neste caso:
RMSE mede o desvio padrão dos resíduos (erros de previsão). Os resíduos são uma medida de quão distantes os pontos de dados estão da linha de regressão; o RMSE é uma medida de quão dispersos esses resíduos estão. Em outras palavras, ele indica quão concentrados os dados estão em torno da linha de melhor ajuste.
Um valor menor de RMSE indica um ajuste melhor. O valor de RMSE que você tem é muito pequeno, sugerindo que o modelo se ajusta muito bem ao conjunto de dados.
O MSE é semelhante ao RMSE, mas eleva ao quadrado os erros antes de calcular a média, o que dá mais peso a erros maiores. É outra medida da qualidade de um estimador — sempre é não-negativo, e valores mais próximos de zero são melhores.
O valor de MSE muito pequeno confirma ainda mais que as previsões do modelo estão muito próximas dos pontos de dados reais.
R2é uma medida estatística que representa a proporção da variância de uma variável dependente que é explicada por uma variável ou variáveis independentes em um modelo de regressão. Um valor de R2 de 1 indica que as previsões de regressão se ajustam perfeitamente aos dados.
NossoR2 o valor é muito próximo de 1, indicando que seu modelo explica quase toda a variabilidade em torno da média, o que é excelente.
No geral, essas métricas sugerem que seu modelo está performando excepcionalmente bem em prever ou se ajustar ao seu conjunto de dados.
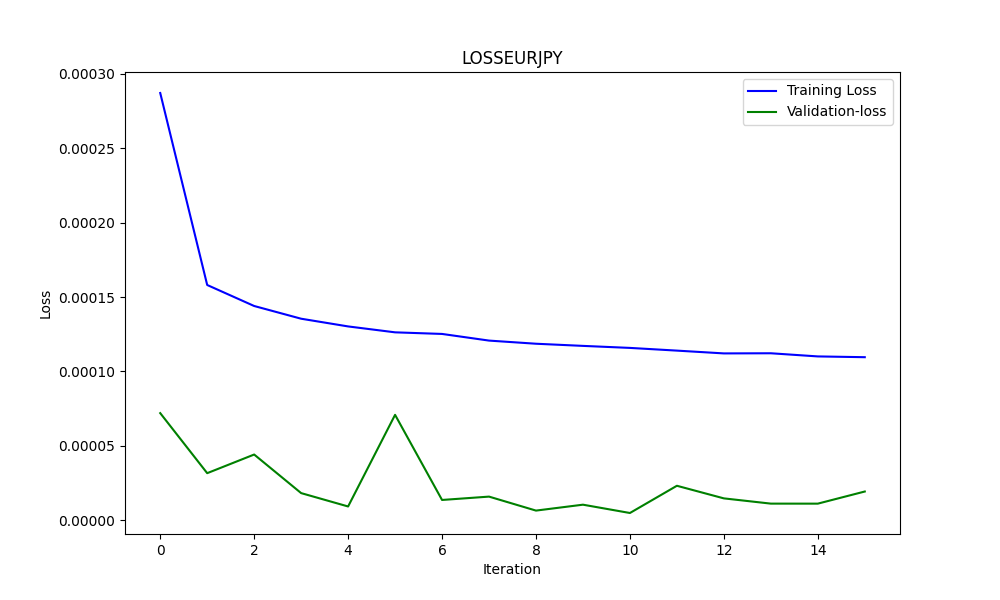
E para saber se está overfitted, usamos os gráficos, por exemplo, neste caso, o segundo gráfico.
Aqui está uma análise baseada no gráfico:
-
Perda de Treinamento (Linha Azul):
- Esta linha mostra uma queda acentuada inicialmente, indicando que o modelo está aprendendo rapidamente com o conjunto de dados de treinamento. Conforme as iterações progridem, a perda de treinamento continua a diminuir, mas em um ritmo mais lento, o que é típico quando o modelo começa a convergir para um mínimo.
-
Perda de Validação (Linha Verde):
- A perda de validação permanece extremamente baixa e bastante estável ao longo do processo de treinamento. Isso sugere que o modelo está generalizando bem e não está apenas memorizando os dados de treinamento. As pequenas flutuações indicam variabilidade no desempenho do conjunto de validação entre as iterações, mas permanecem dentro de uma faixa muito estreita.
No geral, o gráfico sugere um processo de treinamento muito bem-sucedido com excelente convergência e generalização. A baixa perda de validação é particularmente promissora, pois indica que o modelo deve performar bem em dados não vistos, assumindo que o conjunto de validação seja representativo do problema geral.
Depois de tudo isso feito, vamos passá-lo para o EA.
Expert Advisor para Arbitragem Triangular com previsões.
//+------------------------------------------------------------------+
//|                          ONNX_Triangular EURUSD-USDJPY-EURJPY.mq5|
//|             Copyright 2024, Javier S. Gastón de Iriarte Cabrera. |
//|                      https://www.mql5.com/en/users/jsgaston/news |
//+------------------------------------------------------------------+
#property copyright   "Copyright 2024, Javier S. Gastón de Iriarte Cabrera."
#property link        "https://www.mql5.com/en/users/jsgaston/news"
#property version     "1.04"

#property strict
#include <Trade\Trade.mqh>
#define MAGIC (965334)


#resource "/Files/art/arbitrage triangular/eurusdjpy/EURUSD__M1_test.onnx" as uchar ExtModel[]
#resource "/Files/art/arbitrage triangular/eurusdjpy/USDJPY__M1_test.onnx" as uchar ExtModel2[]
#resource "/Files/art/arbitrage triangular/eurusdjpy/EURJPY__M1_test.onnx" as uchar ExtModel3[]
CTrade ExtTrade;

#define SAMPLE_SIZE 120

input double lotSize = 3.0;
//input double slippage = 3;
// Add these inputs to allow dynamic control over SL and TP distances
input double StopLossPips = 50.0; // Stop Loss in pips
input double TakeProfitPips = 100.0; // Take Profit in pips
//input double maxSpreadPoints = 10.0;

input ENUM_TIMEFRAMES Periodo = PERIOD_CURRENT;

//+------------------------------------------------------------------+
//|                                                                  |
//+------------------------------------------------------------------+
string symbol1 = Symbol();
input string symbol2 = "USDJPY";
input string symbol3 = "EURJPY";
int ticket1 = 0;
int ticket2 = 0;
int ticket3 = 0;
int ticket11 = 0;
int ticket22 = 0;
int ticket33 = 0;
input bool isArbitrageActive = true;

double spreads[1000]; // Array para almacenar hasta 1000 spreads
int spreadIndex = 0; // Índice para el próximo spread a almacenar

long     ExtHandle=INVALID_HANDLE;
//int      ExtPredictedClass=-1;
datetime ExtNextBar=0;
datetime ExtNextDay=0;
float    ExtMin=0.0;
float    ExtMax=0.0;


long     ExtHandle2=INVALID_HANDLE;
//int      ExtPredictedClass=-1;
datetime ExtNextBar2=0;
datetime ExtNextDay2=0;
float    ExtMin2=0.0;
float    ExtMax2=0.0;

long     ExtHandle3=INVALID_HANDLE;
//int      ExtPredictedClass=-1;
datetime ExtNextBar3=0;
datetime ExtNextDay3=0;
float    ExtMin3=0.0;
float    ExtMax3=0.0;

float predicted=0.0;
float predicted2=0.0;
float predicted3=0.0;
float predicted2i=0.0;
float predicted3i=0.0;

float   lastPredicted1=0.0;
float   lastPredicted2=0.0;
float   lastPredicted3=0.0;
float   lastPredicted2i=0.0;
float   lastPredicted3i=0.0;

int Order=0;

input double targetProfit = 100.0; // Eur benefit goal
input double maxLoss = -50.0;      // Eur max loss

input double perVar = 0.005; // Percentage of variation to make orders

ulong tickets[6]; // Array para almacenar los tickets de las órdenes

double sl=0.0;
double tp=0.0;

int Abrir = 0;
//+------------------------------------------------------------------+
//| Expert initialization function                                   |
//+------------------------------------------------------------------+
int OnInit()
  {

   ExtTrade.SetExpertMagicNumber(MAGIC);
   Print("EA de arbitraje ONNX iniciado");

//--- create a model from static buffer
   ExtHandle=OnnxCreateFromBuffer(ExtModel,ONNX_DEFAULT);
   if(ExtHandle==INVALID_HANDLE)
     {
      Print("OnnxCreateFromBuffer error ",GetLastError());
      return(INIT_FAILED);
     }

//--- since not all sizes defined in the input tensor we must set them explicitly
//--- first index - batch size, second index - series size, third index - number of series (only Close)
   const long input_shape[] = {1,SAMPLE_SIZE,1};
   if(!OnnxSetInputShape(ExtHandle,ONNX_DEFAULT,input_shape))
     {
      Print("OnnxSetInputShape error ",GetLastError());
      return(INIT_FAILED);
     }

//--- since not all sizes defined in the output tensor we must set them explicitly
//--- first index - batch size, must match the batch size of the input tensor
//--- second index - number of predicted prices (we only predict Close)
   const long output_shape[] = {1,1};
   if(!OnnxSetOutputShape(ExtHandle,0,output_shape))
     {
      Print("OnnxSetOutputShape error ",GetLastError());
      return(INIT_FAILED);
     }

////////////////////////////////////////////////////////////////////////////////////////

//--- create a model from static buffer
   ExtHandle2=OnnxCreateFromBuffer(ExtModel2,ONNX_DEFAULT);
   if(ExtHandle2==INVALID_HANDLE)
     {
      Print("OnnxCreateFromBuffer error ",GetLastError());
      return(INIT_FAILED);
     }

//--- since not all sizes defined in the input tensor we must set them explicitly
//--- first index - batch size, second index - series size, third index - number of series (only Close)
   const long input_shape2[] = {1,SAMPLE_SIZE,1};
   if(!OnnxSetInputShape(ExtHandle2,ONNX_DEFAULT,input_shape2))
     {
      Print("OnnxSetInputShape error ",GetLastError());
      return(INIT_FAILED);
     }

//--- since not all sizes defined in the output tensor we must set them explicitly
//--- first index - batch size, must match the batch size of the input tensor
//--- second index - number of predicted prices (we only predict Close)
   const long output_shape2[] = {1,1};
   if(!OnnxSetOutputShape(ExtHandle2,0,output_shape2))
     {
      Print("OnnxSetOutputShape error ",GetLastError());
      return(INIT_FAILED);
     }

/////////////////////////////////////////////////////////////////////////////////////////////////////////////
//--- create a model from static buffer
   ExtHandle3=OnnxCreateFromBuffer(ExtModel3,ONNX_DEFAULT);
   if(ExtHandle3==INVALID_HANDLE)
     {
      Print("OnnxCreateFromBuffer error ",GetLastError());
      return(INIT_FAILED);
     }

//--- since not all sizes defined in the input tensor we must set them explicitly
//--- first index - batch size, second index - series size, third index - number of series (only Close)
   const long input_shape3[] = {1,SAMPLE_SIZE,1};
   if(!OnnxSetInputShape(ExtHandle3,ONNX_DEFAULT,input_shape3))
     {
      Print("OnnxSetInputShape error ",GetLastError());
      return(INIT_FAILED);
     }

//--- since not all sizes defined in the output tensor we must set them explicitly
//--- first index - batch size, must match the batch size of the input tensor
//--- second index - number of predicted prices (we only predict Close)
   const long output_shape3[] = {1,1};
   if(!OnnxSetOutputShape(ExtHandle3,0,output_shape3))
     {
      Print("OnnxSetOutputShape error ",GetLastError());
      return(INIT_FAILED);
     }

   return(INIT_SUCCEEDED);
  }

//+------------------------------------------------------------------+
//| Expert deinitialization function                                 |
//+------------------------------------------------------------------+
void OnDeinit(const int reason)
  {
   if(ExtHandle!=INVALID_HANDLE)
     {
      OnnxRelease(ExtHandle);
      ExtHandle=INVALID_HANDLE;
     }

   if(ExtHandle2!=INVALID_HANDLE)
     {
      OnnxRelease(ExtHandle2);
      ExtHandle2=INVALID_HANDLE;
     }

   if(ExtHandle3!=INVALID_HANDLE)
     {
      OnnxRelease(ExtHandle3);
      ExtHandle3=INVALID_HANDLE;
     }
  }

//+------------------------------------------------------------------+
//| Expert tick function                                             |
//+------------------------------------------------------------------+
void OnTick()
  {

   SymbolProcessor processor; // Crear instancia de SymbolProcessor

   string A = processor.GetFirstThree(symbol1);
   string B = processor.GetLastThree(symbol1);

   string C = processor.GetFirstThree(symbol2);
   string D = processor.GetLastThree(symbol2);

   string E = processor.GetFirstThree(symbol3);
   string F = processor.GetLastThree(symbol3);

   if((A != E) || (B != C) || (D != F))
     {
      Print("Wrongly selected symbols");
      return;
     }


//--- check new day
   if(TimeCurrent()>=ExtNextDay)
     {
      GetMinMax();
      GetMinMax2();
      GetMinMax3();
      //--- set next day time
      ExtNextDay=TimeCurrent();
      ExtNextDay-=ExtNextDay%PeriodSeconds(Periodo);
      ExtNextDay+=PeriodSeconds(Periodo);

     }

//--- check new bar
   if(TimeCurrent()<ExtNextBar)
     {

      return;
     }
//--- set next bar time
   ExtNextBar=TimeCurrent();
   ExtNextBar-=ExtNextBar%PeriodSeconds();
   ExtNextBar+=PeriodSeconds();
//--- check min and max
   float close=(float)iClose(symbol1,Periodo,0);
   if(ExtMin>close)
      ExtMin=close;
   if(ExtMax<close)
      ExtMax=close;
   float close2=(float)iClose(symbol2,Periodo,0);
   if(ExtMin2>close2)
      ExtMin2=close2;
   if(ExtMax2<close2)
      ExtMax2=close2;
   float close3=(float)iClose(symbol3,Periodo,0);
   if(ExtMin3>close3)
      ExtMin3=close3;
   if(ExtMax3<close3)
      ExtMax3=close3;

   lastPredicted1=predicted;
   lastPredicted2=predicted2;
   lastPredicted3=predicted3;
   lastPredicted2i=predicted2i;
   lastPredicted3i=predicted3i;

//--- predict next price
   PredictPrice();
   PredictPrice2();
   PredictPrice3();


   /*   */
   double price1 = SymbolInfoDouble(symbol1, SYMBOL_BID);/////////////////
   double price2 = SymbolInfoDouble(symbol2, SYMBOL_BID);
   double price2i = 1/price2;
   double price3 = SymbolInfoDouble(symbol3, SYMBOL_ASK);
   double price3i = 1/price3;

   double price11 = SymbolInfoDouble(symbol1, SYMBOL_ASK);/////////////////
   double price22 = SymbolInfoDouble(symbol2, SYMBOL_ASK);
   double price22i = 1/price22;
   double price33 = SymbolInfoDouble(symbol3, SYMBOL_BID);
   double price33i = 1/price33;

   predicted2i = 1/predicted2;
   predicted3i = 1/predicted3;


//double lotSize = 1.0; // Lote base
   double lotSize2 = lotSize * predicted / predicted2;   /// tengo dudas con usar el invertido o no invertido
   double lotSize3 = lotSize * predicted / predicted3;

   double lotSize22 = lotSize * predicted / predicted2;  /// tengo dudas con usar el invertido o no invertido
   double lotSize33 = lotSize * predicted / predicted3;

// Redondear lotes a un múltiplo aceptable por tu bróker
   lotSize2 = NormalizeDouble(lotSize2, 2); // Asume 2 decimales para lotes
   lotSize3 = NormalizeDouble(lotSize3, 2);

   lotSize22 = NormalizeDouble(lotSize22, 2); // Asume 2 decimales para lotes
   lotSize33 = NormalizeDouble(lotSize33, 2);

   int totalPositions = PositionsTotal();

   if(Order==1 || Order==2)
     {
      // Verificar y cerrar órdenes si se cumplen las condiciones
      Print("Verificar y cerrar órdenes si se cumplen las condiciones");
      CheckAndCloseOrders();

     }


   if(!isArbitrageActive || ArePositionsOpen())
     {
      Print("Arbitraje inactivo o ya hay posiciones abiertas.");
      return;
     }
   double varia11 = 100.0 - (close*100/predicted);
   double varia21 = 100.0 - (close2*100/predicted2);
   double varia31 = 100.0 - (predicted3*100/close3);
   double varia12 = 100.0 - (predicted*100/close);
   double varia22 = 100.0 - (predicted2*100/close2);
   double varia32 = 100.0 - (close3*100/predicted3);


   if((varia11 > perVar)   && (varia21 > perVar) && (varia31 > perVar))
     {
      Print("se debería proceder a apertura de ordenes de derechas");
      Abrir = 1;
     }
   if((varia12 > perVar)   && (varia22 > perVar) && (varia32 > perVar))
     {
      Print("se debería proceder a apertura de ordenes de izquierdas");
      Abrir = 2;
     }
   if(Abrir == 1 && (predicted*predicted2*predicted3i>1))
     {
      Print("orden derecha");
      // Inicia el arbitraje si aún no está activo
      if(isArbitrageActive)
        {

         if((ticket1 == 0 && ticket2 == 0 && ticket3 ==0) && (Order==0) &&  totalPositions ==0)
           {
            Print("Preparando para abrir órdenes");
            Order = 1;


            MqlTradeRequest request;
            MqlTradeResult  result;


              {

               MqlRates rates[];
               ArraySetAsSeries(rates,true);
               int copied=CopyRates(symbol1,0,0,1,rates);

               CalculateSL(true,rates[0].close,symbol1);
               CalculateTP(true,rates[0].close,symbol1);

               if(ExtTrade.Buy(lotSize, symbol1, rates[0].close, sl, tp, "Arbitraje"))
                 {
                  tickets[0] = ExtTrade.ResultDeal();  // Getting the ticket of the last trade
                  Print("Order placed with ticket: ", tickets[0]);
                 }
               else
                 {
                  Print("Failed to place order: ", GetLastError());
                 }
              }

              {
               MqlRates rates[];
               ArraySetAsSeries(rates,true);
               int copied=CopyRates(symbol2,0,0,1,rates);

               CalculateSL(true,rates[0].close,symbol2);
               CalculateTP(true,rates[0].close,symbol2);

               if(ExtTrade.Buy(lotSize2, symbol2, rates[0].close, sl, tp, "Arbitraje"))
                 {
                  tickets[1] = ExtTrade.ResultDeal();  // Getting the ticket of the last trade
                  Print("Order placed with ticket: ", tickets[1]);
                 }
               else
                 {
                  Print("Failed to place order: ", GetLastError());
                 }
              }

              {
               MqlRates rates[];
               ArraySetAsSeries(rates,true);
               int copied=CopyRates(symbol3,0,0,1,rates);

               CalculateSL(false,rates[0].close,symbol3);
               CalculateTP(false,rates[0].close,symbol3);


               if(ExtTrade.Sell(lotSize3, symbol3, rates[0].close, sl, tp, "Arbitraje"))
                 {
                  tickets[2] = ExtTrade.ResultDeal();  // Getting the ticket of the last trade
                  Print("Order placed with ticket: ", tickets[2]);
                 }
               else
                 {
                  Print("Failed to place order: ", GetLastError());
                 }
              }


            ticket1=1;
            ticket2=1;
            ticket3=1;
            Abrir=0;

            return;
           }
         else
           {
            Print(" no se puede abrir ordenes");
           }
        }
     }

   if(Abrir == 2 && (predicted*predicted2*predicted3i<1))
     {
      Print("Orden Inversa");
      // Inicia el arbitraje si aún no está activo
      if(isArbitrageActive)
        {

         if((ticket11 == 0 && ticket22 == 0 && ticket33 ==0) && (Order==0) && totalPositions==0)
           {
            Print("Preparando para abrir órdenes");
            Order = 2;

            MqlTradeRequest request;
            MqlTradeResult  result;

              {
               MqlRates rates[];
               ArraySetAsSeries(rates,true);
               int copied=CopyRates(symbol1,0,0,1,rates);

               CalculateSL(false,rates[0].close,symbol1);
               CalculateTP(false,rates[0].close,symbol1);

               if(ExtTrade.Sell(lotSize, symbol1, rates[0].close, sl, tp, "Arbitraje"))
                 {
                  tickets[3] = ExtTrade.ResultDeal();  // Getting the ticket of the last trade
                  Print("Order placed with ticket: ", tickets[3]);
                 }
               else
                 {
                  Print("Failed to place order: ", GetLastError());
                 }
              }

              {
               MqlRates rates[];
               ArraySetAsSeries(rates,true);
               int copied=CopyRates(symbol2,0,0,1,rates);
               CalculateSL(false,rates[0].close,symbol2);
               CalculateTP(false,rates[0].close,symbol2);

               if(ExtTrade.Sell(lotSize2, symbol2, rates[0].close, sl, tp, "Arbitraje"))
                 {
                  tickets[4] = ExtTrade.ResultDeal();  // Getting the ticket of the last trade
                  Print("Order placed with ticket: ", tickets[4]);
                 }
               else
                 {
                  Print("Failed to place order: ", GetLastError());
                 }
              }

              {
               MqlRates rates[];
               ArraySetAsSeries(rates,true);
               int copied=CopyRates(symbol3,0,0,1,rates);

               CalculateSL(true,rates[0].close,symbol3);
               CalculateTP(true,rates[0].close,symbol3);

               if(ExtTrade.Buy(lotSize3, symbol3, rates[0].close, sl, tp, "Arbitraje"))
                 {
                  tickets[5] = ExtTrade.ResultDeal();  // Getting the ticket of the last trade
                  Print("Order placed with ticket: ", tickets[5]);
                 }
               else
                 {
                  Print("Failed to place order: ", GetLastError());
                 }
              }


            ticket11=1;
            ticket22=1;
            ticket33=1;
            Abrir=0;

            return;
           }
         else
           {
            Print(" no se puede abrir ordenes");
           }
        }
     }

  }

//+------------------------------------------------------------------+
//| Postions are open function                                       |
//+------------------------------------------------------------------+
bool ArePositionsOpen()
  {
// Check for positions on symbol1
   if(PositionSelect(symbol1) && PositionGetDouble(POSITION_VOLUME) > 0)
      return true;
// Check for positions on symbol2
   if(PositionSelect(symbol2) && PositionGetDouble(POSITION_VOLUME) > 0)
      return true;
// Check for positions on symbol3
   if(PositionSelect(symbol3) && PositionGetDouble(POSITION_VOLUME) > 0)
      return true;

   return false;
  }
//+------------------------------------------------------------------+
//| Price prediction function                                        |
//+------------------------------------------------------------------+
void PredictPrice(void)
  {
   static vectorf output_data(1);            // vector to get result
   static vectorf x_norm(SAMPLE_SIZE);       // vector for prices normalize

//--- check for normalization possibility
   if(ExtMin>=ExtMax)
     {
      Print("ExtMin>=ExtMax");
      //ExtPredictedClass=-1;
      return;
     }
//--- request last bars
   if(!x_norm.CopyRates(_Symbol,Periodo,COPY_RATES_CLOSE,1,SAMPLE_SIZE))
     {
      Print("CopyRates ",x_norm.Size());
      //ExtPredictedClass=-1;
      return;
     }
   float last_close=x_norm[SAMPLE_SIZE-1];
//--- normalize prices
   x_norm-=ExtMin;
   x_norm/=(ExtMax-ExtMin);
//--- run the inference
   if(!OnnxRun(ExtHandle,ONNX_NO_CONVERSION,x_norm,output_data))
     {
      Print("OnnxRun");
      //ExtPredictedClass=-1;
      return;
     }
//--- denormalize the price from the output value
   predicted=output_data[0]*(ExtMax-ExtMin)+ExtMin;
//return predicted;
  }

//+------------------------------------------------------------------+
//| Price prediction function                                        |
//+------------------------------------------------------------------+
void PredictPrice2(void)
  {
   static vectorf output_data2(1);            // vector to get result
   static vectorf x_norm2(SAMPLE_SIZE);       // vector for prices normalize

//--- check for normalization possibility
   if(ExtMin2>=ExtMax2)
     {
      Print("ExtMin2>=ExtMax2");
      //ExtPredictedClass=-1;
      return;
     }
//--- request last bars
   if(!x_norm2.CopyRates(symbol2,Periodo,COPY_RATES_CLOSE,1,SAMPLE_SIZE))
     {
      Print("CopyRates ",x_norm2.Size());
      //ExtPredictedClass=-1;
      return;
     }
   float last_close2=x_norm2[SAMPLE_SIZE-1];
//--- normalize prices
   x_norm2-=ExtMin2;
   x_norm2/=(ExtMax2-ExtMin2);
//--- run the inference
   if(!OnnxRun(ExtHandle2,ONNX_NO_CONVERSION,x_norm2,output_data2))
     {
      Print("OnnxRun");
      //ExtPredictedClass=-1;
      return;
     }
//--- denormalize the price from the output value
   predicted2=output_data2[0]*(ExtMax2-ExtMin2)+ExtMin2;
//--- classify predicted price movement
//return predicted2;
  }

//+------------------------------------------------------------------+
//| Price prediction function                                        |
//+------------------------------------------------------------------+
void PredictPrice3(void)
  {
   static vectorf output_data3(1);            // vector to get result
   static vectorf x_norm3(SAMPLE_SIZE);       // vector for prices normalize

//--- check for normalization possibility
   if(ExtMin3>=ExtMax3)
     {
      Print("ExtMin3>=ExtMax3");
      //ExtPredictedClass=-1;
      return;
     }
//--- request last bars
   if(!x_norm3.CopyRates(symbol3,Periodo,COPY_RATES_CLOSE,1,SAMPLE_SIZE))
     {
      Print("CopyRates ",x_norm3.Size());
      //ExtPredictedClass=-1;
      return;
     }
   float last_close3=x_norm3[SAMPLE_SIZE-1];
//--- normalize prices
   x_norm3-=ExtMin3;
   x_norm3/=(ExtMax3-ExtMin3);
//--- run the inference
   if(!OnnxRun(ExtHandle3,ONNX_NO_CONVERSION,x_norm3,output_data3))
     {
      Print("OnnxRun");
      //ExtPredictedClass=-1;
      return;
     }
//--- denormalize the price from the output value
   predicted3=output_data3[0]*(ExtMax3-ExtMin3)+ExtMin3;
//--- classify predicted price movement
//return predicted2;
  }

//+------------------------------------------------------------------+
//| Get minimal and maximal Close for last 120 values                |
//+------------------------------------------------------------------+
void GetMinMax(void)
  {
   vectorf closeMN;
   closeMN.CopyRates(symbol1,Periodo,COPY_RATES_CLOSE,0,SAMPLE_SIZE);
   ExtMin=closeMN.Min();
   ExtMax=closeMN.Max();
  }

//+------------------------------------------------------------------+
//| Get minimal and maximal Close for last 120 values                |
//+------------------------------------------------------------------+
void GetMinMax2(void)
  {
   vectorf closeMN2;
   closeMN2.CopyRates(symbol2,Periodo,COPY_RATES_CLOSE,0,SAMPLE_SIZE);
   ExtMin2=closeMN2.Min();
   ExtMax2=closeMN2.Max();
  }

//+------------------------------------------------------------------+
//| Get minimal and maximal Close for last 120 values                |
//+------------------------------------------------------------------+
void GetMinMax3(void)
  {
   vectorf closeMN3;
   closeMN3.CopyRates(symbol3,Periodo,COPY_RATES_CLOSE,0,SAMPLE_SIZE);
   ExtMin3=closeMN3.Min();
   ExtMax3=closeMN3.Max();
  }

//+------------------------------------------------------------------+
//| Symbols class returns both pairs of a symbol                     |
//+------------------------------------------------------------------+
class SymbolProcessor
  {
public:
   // Método para obtener los primeros tres caracteres de un símbolo dado
   string            GetFirstThree(string symbol)
     {
      return StringSubstr(symbol, 0, 3);
     }

   // Método para obtener los últimos tres caracteres de un símbolo dado
   string            GetLastThree(string symbol)
     {
      if(StringLen(symbol) >= 3)
         return StringSubstr(symbol, StringLen(symbol) - 3, 3);
      else
         return ""; // Retorna un string vacío si el símbolo es demasiado corto
     }
  };

//+------------------------------------------------------------------+
//| Calculate total profit from all open positions for the current symbol
//+------------------------------------------------------------------+
double CalculateCurrentArbitrageProfit()
  {
   double totalProfit = 0.0;
   int totalPositions = PositionsTotal(); // Get the total number of open positions

// Loop through all open positions
   for(int i = 0; i < totalPositions; i++)
     {
      // Get the ticket of the position at index i
      ulong ticket = PositionGetTicket(i);
      if(PositionSelectByTicket(ticket))    // Select the position by its ticket
        {
         // Add the profit of the current position to the total profit
         totalProfit += PositionGetDouble(POSITION_PROFIT);
         //Print("totalProfit ", totalProfit);
        }
     }

   return totalProfit; // Return the total profit of all open positions
  }
// Función para cerrar todas las órdenes
void CloseAllOrders()
  {
   string symbols[] = {symbol1, symbol2, symbol3};
   for(int i = 0; i < ArraySize(symbols); i++)
     {
      if(ExtTrade.PositionClose(symbols[i], 3))
         Print("Posición cerrada correctamente para ", symbols[i]);
      else
         Print("Error al cerrar posición para ", symbols[i], ": Error", GetLastError());
     }

// Resetea tickets y ordenes
   ticket1 = 0;
   ticket2 = 0;
   ticket3 = 0;
   ticket11 = 0;
   ticket22 = 0;
   ticket33 = 0;
   Order = 0;

   Print("Todas las órdenes están cerradas");
  }

//+------------------------------------------------------------------+
//| Check and close orders funcion                                   |
//+------------------------------------------------------------------+
// Función para verificar y cerrar órdenes
void CheckAndCloseOrders()
  {
   double currentProfit = CalculateCurrentArbitrageProfit();

// Condiciones para cerrar las órdenes
   if((currentProfit >= targetProfit || currentProfit <= maxLoss))
     {
      CloseAllOrders();  // Cierra todas las órdenes
      Print("Todas las órdenes cerradas. Beneficio/Pérdida actual: ", currentProfit);
     }
  }

//+------------------------------------------------------------------+
//| Get order volume function                                        |
//+------------------------------------------------------------------+
double GetOrderVolume(int ticket)
  {
   if(PositionSelectByTicket(ticket))
     {
      double volume = PositionGetDouble(POSITION_VOLUME);
      return volume;
     }
   else
     {
      Print("No se pudo seleccionar la posición con el ticket: ", ticket);
      return 0; // Retorna 0 si no se encuentra la posición
     }
  }
//+------------------------------------------------------------------+
// Function to get the price and calculate SL dynamically

double CalculateSL(bool isBuyOrder,double entryPrice,string simbolo)
  {

   double pointSize = SymbolInfoDouble(simbolo, SYMBOL_POINT);
   int digits = (int)SymbolInfoInteger(simbolo, SYMBOL_DIGITS);
   double pipSize = pointSize * 10;


   if(isBuyOrder)
     {
      sl = NormalizeDouble(entryPrice - StopLossPips * pipSize, digits);
      tp = NormalizeDouble(entryPrice + TakeProfitPips * pipSize, digits);
     }
   else
     {
      sl = NormalizeDouble(entryPrice + StopLossPips * pipSize, digits);
      tp = NormalizeDouble(entryPrice - TakeProfitPips * pipSize, digits);
     }
   return sl;
  }
//+------------------------------------------------------------------+
// Function to get the price and calculate TP dynamically
double CalculateTP(bool isBuyOrder,double entryPrice, string simbolo)
  {

   double pointSize = SymbolInfoDouble(simbolo, SYMBOL_POINT);
   int digits = (int)SymbolInfoInteger(simbolo, SYMBOL_DIGITS);
   double pipSize = pointSize * 10;


   if(isBuyOrder)
     {
      sl = NormalizeDouble(entryPrice - StopLossPips * pipSize, digits);
      tp = NormalizeDouble(entryPrice + TakeProfitPips * pipSize, digits);
     }
   else
     {
      sl = NormalizeDouble(entryPrice + StopLossPips * pipSize, digits);
      tp = NormalizeDouble(entryPrice - TakeProfitPips * pipSize, digits);
     }
   return tp;
  }
//+------------------------------------------------------------------+
// Function to handle errors and retry
bool TryOrderSend(MqlTradeRequest &request, MqlTradeResult &result)
  {
   for(int attempts = 0; attempts < 5; attempts++)
     {
      if(OrderSend(request, result))
        {
         return true;
        }
      else
        {
         Print("Failed to send order on attempt ", attempts + 1, ": Error ", GetLastError());
         Sleep(1000); // Pause before retrying to avoid 'context busy' errors
        }
     }
   return false;
  }
//+------------------------------------------------------------------+
Explicação do Expert Advisor
A Estratégia
Todos nós já sabemos o que é arbitragem triangular, mas, eu adicionei ao código uma diferença mínima entre a previsão e o valor de fechamento atual. Essa diferença é a taxa de variação percentual entre esses dois valores, e você pode modificar essa quantidade com este input:
input double perVar = 0.005; // Percentage of variation to make orders
*** Observe no código que ele segue essa lógica: ***
EUR       USD     | EUR  |^(-1)
----   x  ---  x  | ---- |
USD       JPY     | JPY  |
Tudo está adaptado a essa lógica, então, se você usar outros pares, tudo deverá ser modificado.
Vou anexar outro exemplo (EURUSD - GBPUSD - EURGBP) para que você possa ver as mudanças. Ele usa essa lógica:
EUR      | GBP |^(-1)    | EUR  |^(-1)
----   x | --- |      x  | ---- |
USD      | USD |         | GBP  |
Toda a estratégia é baseada em que, quando você multiplica essa lógica, se for >1, você pode multiplicar na direção certa, e se for <1, você pode multiplicar na direção oposta.
Mas a estratégia deste Expert Advisor é que, em vez de usar os preços reais, usaremos os preços previstos.
Essa lógica significa que, se você multiplicar para a direita, está multiplicando preços, e se multiplicar pelo inverso, é uma divisão. Para a esquerda, é o contrário. Você pode observar essas mudanças no código.
Os tamanhos de lote devem ser selecionados de acordo com o maior preço. Por isso, nesse caso EUR-USD-JPY, o lote mínimo é de cerca de 2 ou 3 lotes.
A lógica para os tamanhos de lote é esta:
   double lotSize2 = lotSize * predicted / predicted2;
   double lotSize3 = lotSize * predicted / predicted3;
onde predicted é o preço previsto para EURUSD, predicted2 é o preço para USDJPY e predicted3 é o preço para EURJPY.
A última parte disso é normalizar o tamanho do lote para os requisitos do corretor.
lotSize2 = NormalizeDouble(lotSize2, 2);
lotSize3 = NormalizeDouble(lotSize3, 2);
Exemplo:
Para este exemplo, usaremos os pares EUR-USD-JPY.
Com esta lógica:
EUR       USD     | EUR  |^(-1)
----   x  ---  x  | ---- |
USD       JPY     | JPY  |
Vamos treinar e testar com 200.000 períodos de tempo em minutos (tamanho da amostra), até o dia 3 de abril. Isso nos dará cerca de 17 dias de previsões.
Portanto, o teste no strategy tester será executado de 3 de abril até o dia 21 do mesmo mês, e selecionaremos o timeframe de 1 minuto.
Para o primeiro teste, usaremos estas entradas e configurações (selecionar cuidadosamente os símbolos, pois eles são adicionados ao EA (ONNX)):


Os resultados são:
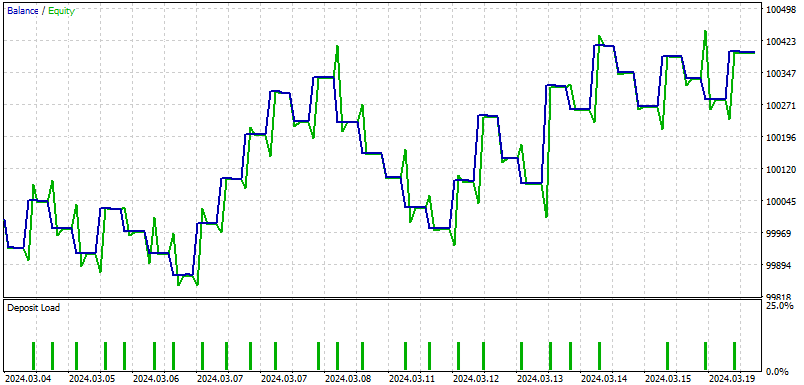
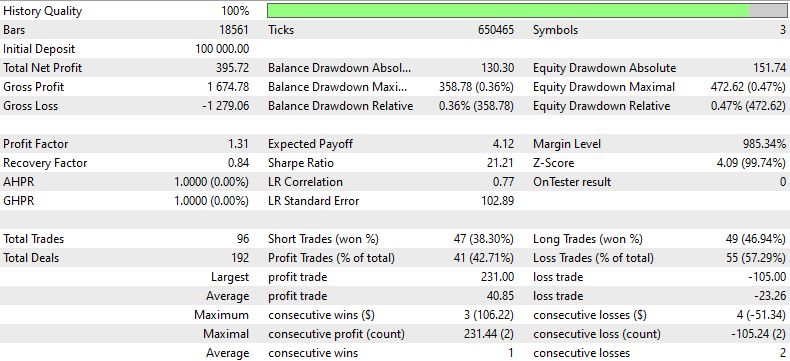
Este é o resumo que o EA apresenta dos resultados deste back-testing:
Este relatório de backtesting fornece uma análise detalhada do desempenho de uma estratégia de negociação durante um determinado período, usando dados históricos. A estratégia começou com um depósito inicial de $100.000 e terminou com um lucro líquido total de $395,72, apesar de uma perda bruta significativa de $1.279,06 em comparação com o lucro bruto de $1.674,78. O fator de lucro de 1,31 indica que o lucro bruto excedeu a perda bruta em 31%, mostrando a capacidade da estratégia de gerar lucro em relação à perda.
A estratégia executou um total de 96 operações, com uma divisão quase igual entre operações vencedoras e perdedoras, como indicado pelos percentuais de operações curtas vencidas (38,30%) e operações longas vencidas (46,94%). A estratégia teve mais operações perdedoras no geral (55 ou 57,29%), enfatizando a necessidade de melhoria na seleção ou nas estratégias de saída das operações.
O fator de recuperação de 0,84 sugere risco moderado, com a estratégia recuperando 84% do máximo drawdown. Além disso, o drawdown máximo foi relativamente alto em $358,78 (0,36% da conta), indicando que, embora a estratégia tenha sido lucrativa, também enfrentou quedas significativas das quais precisou se recuperar.
O backtest também mostrou drawdowns substanciais em termos de patrimônio, com um drawdown máximo de 0,47% da conta. Isso, juntamente com o índice de Sharpe de 21,21, sugere que os retornos foram consideravelmente maiores do que o risco assumido, o que é positivo. No entanto, o baixo número médio de vitórias consecutivas (3 operações) em comparação com as perdas consecutivas mais altas (2 operações) sugere que a estratégia pode se beneficiar de refinamentos para manter consistência nas operações vencedoras.
Conclusão
Neste artigo, desmembramos o emocionante conceito de arbitragem triangular usando previsões, tudo através da plataforma amigável MT5 e programação Python. Imagine ter uma fórmula secreta que lhe permita jogar de forma inteligente no câmbio de moedas, transformando dólares em euros, depois em ienes e de volta para dólares, com o objetivo de terminar com mais do que começou. Isso não é mágica; trata-se de usar modelos preditivos especiais chamados ONNX e arbitragem triangular, que aprendem com os preços de moedas passados para prever os futuros, guiando seus movimentos de negociação.
O artigo é super útil para configurar tudo, mostrando como instalar todas as ferramentas necessárias, como Python e Visual Studio Code, e como preparar seu computador para começar os testes. Explica de forma simples, garantindo que você saiba como ajustar a estratégia, seja sua conta de negociação básica ou avançada.
No geral, este artigo é um excelente recurso para qualquer pessoa que deseja entrar no jogo de negociação forex, usando algumas das tecnologias mais inteligentes disponíveis. Guia você pelos detalhes de configurar e executar seu sistema de negociação, para que você possa experimentar negociar com uma vantagem, graças ao mais recente em inteligência artificial e aprendizado de máquina. Seja você iniciante em programação ou em negociação, este guia está ao seu lado, mostrando passo a passo como fazer a transição digital para a negociação automatizada.
Espero que você tenha gostado de ler este artigo tanto quanto eu gostei de escrevê-lo.
Traduzido do Inglês pela MetaQuotes Ltd.
Artigo original: https://www.mql5.com/en/articles/14873
 Técnicas do MQL5 Wizard que você deve conhecer (Parte 20): Regressão Simbólica
 Desenvolvendo um EA multimoeda (Parte 10): Criação de objetos a partir de uma string
 Está chegando o novo MetaTrader 5 e MQL5
 Algoritmo de otimização baseado em brainstorming — Brain Storm Optimization (Parte II): Multimodalidade
- Aplicativos de negociação gratuitos
- 8 000+ sinais para cópia
- Notícias econômicas para análise dos mercados financeiros
Você concorda com a política do site e com os termos de uso