
MetaTrader 5 and Python integration: receiving and sending data

Why integrate MQL5 and Python?
Comprehensive data processing requires extensive tools and is often beyond the sandbox of one single application. Specialized programming languages are used for processing and analyzing data, statistics and machine learning. One of the leading programming languages for data processing is Python. A very effective solution is to use the power of the language and included libraries for the development of trading systems.
There are different solutions for implementing the interaction of two or more programs. Sockets are one the fastest and most flexible solutions.
A network socket is the endpoint of interprocess communication over a computer network. The MQL5 Standard Library includes a group of Socket functions, which provide a low-level interface for working on the Internet. This is a common interface for different programming languages, as it uses system calls at the operating system level.
Data exchange between the prices is implemented over TCP/IP (Transmission Control Protocol/Internet Protocol). Thus, processes can interact within a single computer and over a local network or the Internet.
To establish a connection, it is necessary to create and initialize a TCP server to which the client process will connect. Once the interaction of processes is completed, the connection must be forcibly closed. Data in a TCP exchange is a stream of bytes.
When creating a server, we need to associate a socket with one or more hosts (IP addresses) and an unused port. If the list of hosts is not set or is specified as "0.0.0.0", the socket will listen to all hosts. If you specify "127.0.0.1" or 'localhost', connection will be possible only within the "internal loop", i.e. only within one computer.
Since only the client is available in MQL5, we will create a server in Python.
Creating a socket server in Python
The purpose of the article is not to teach the Python programming basics. It is therefore assumed that the reader is familiar with this language.
We will use version 3.7.2 and the built-in socket package. Please read related documentation for more details.
We will write a simple program which will create a socket server and receive the necessary information from the client (the MQL5 program), handle it and send back the result. This seems to be the most efficient interaction method. Suppose we need to use a machine learning library, such as for example scikit learn, which will calculate linear regression using prices and return coordinates, based on which a line can be drawn in the MetaTrader 5 terminal. This is the basic example. However, such interaction can also be used for training a neural network, for sending to it data from the terminal (quotes), learning and returning the result to the terminal.
Let us create the socketserver.py program and import the libraries described above:
import socket, numpy as np
from sklearn.linear_model import LinearRegression
Now we can proceed to creating a class responsible for socket manipulation:
class socketserver:
    def __init__(self, address = '', port = 9090):
        self.sock = socket.socket(socket.AF_INET, socket.SOCK_STREAM)
        self.address = address
        self.port = port
        self.sock.bind((self.address, self.port))
        self.cummdata = ''

    def recvmsg(self):
        self.sock.listen(1)
        self.conn, self.addr = self.sock.accept()
        print('connected to', self.addr)
        self.cummdata = ''

        while True:
            data = self.conn.recv(10000)
            self.cummdata+=data.decode("utf-8")
            if not data:
                break
            self.conn.send(bytes(calcregr(self.cummdata), "utf-8"))
            return self.cummdata

    def __del__(self):
        self.sock.close()
When creating a class object, the constructor gets the host name (IP address) and port number. Then the sock object is created, which is associated with the address and port sock.bind().
The recvmsg method listens for the incoming connection sock.listen(1). When an incoming client connection arrives, the server accepts it self.sock.accept().
Then the server waits in an infinite loop for an incoming client message, which arrives as a stream of bytes. Since the message length is not known in advance, the server receives this message in parts, say 1 Kbytes at a time, until the whole message is read self.conn.recv(10000). Received piece of data is converted to a string data.decode("utf-8") and is added to the rest of the string summdata.
Once all the data have been received (if not data:), the server sends to the client a string containing the rightmost and leftmost coordinates of the calculated regression line. The string is preliminary converted to a byte array conn.send(bytes(calcregr(self.cummdata), "utf-8")).
At the end, the method returns the string received from the client. It can be used for the visualization of received quotes, among others.
A destructor closes the socket once the Python program execution is completed.
Please note that this is not the only possible implementation of the class. Alternatively, you can separate the methods for receiving and sending messages and use it in different ways at different points in time. I have only described the basic technology for creating a connection. You can implement your own solutions.
Let us consider in more detail the linear regression learning method within the current implementation:
def calcregr(msg = ''):
    chartdata = np.fromstring(msg, dtype=float, sep= ' ')
    Y = np.array(chartdata).reshape(-1,1)
    X = np.array(np.arange(len(chartdata))).reshape(-1,1)

    lr = LinearRegression()
    lr.fit(X, Y)
    Y_pred = lr.predict(X)
    type(Y_pred)
    P = Y_pred.astype(str).item(-1) + ' ' + Y_pred.astype(str).item(0)
    print(P)
    return str(P)
The received byte stream is converted to a utf-8 string, which is then accepted by the calcregr(msg = ' ') method. Since the string contains a sequence of prices separated by spaces (as implemented in the client), it is converted to a NumPy array of the float type. After that the price array is converted to a column (the data receiving format is sclearn) Y = np.array(chartdata).reshape(-1,1). The predictor for the model is the linear time (a sequence of values; its size is equal to the length of the training sample) X = np.array(np.arange(len(chartdata))).reshape(-1,1)
This is followed by training and model prediction, while the first and the last values of the line (the edges of the segment) are written to the "P" variable, converted to a string and passed to the client in byte form.
Now, we only need to create the class object and call the recvmsg() method in a loop:
serv = socketserver('127.0.0.1', 9090)

while True:
    msg = serv.recvmsg()
Creating a socket client in MQL5
Let us create a simple Expert Advisor, which can connect to the server, pass the specified number of recent Close prices, get back the coordinates of the regression line and draw it on the chart.
The socksend() function will pass data to the server:
bool socksend(int sock,string request)
  {
   char req[];
   int  len=StringToCharArray(request,req)-1;
   if(len<0) return(false);
   return(SocketSend(sock,req,len)==len);
  }
It receives the string, converts to a byte array and sends to a server.
The socketreceive() function listens on the port. Once a server response is received, the function returns it as a string:
string socketreceive(int sock,int timeout)
  {
   char rsp[];
   string result="";
   uint len;
   uint timeout_check=GetTickCount()+timeout;
   do
     {
      len=SocketIsReadable(sock);
      if(len)
        {
         int rsp_len;
         rsp_len=SocketRead(sock,rsp,len,timeout);
         if(rsp_len>0)
           {
            result+=CharArrayToString(rsp,0,rsp_len);
           }
        }
     }
   while((GetTickCount()<timeout_check) && !IsStopped());
   return result;
  }
The last function drawlr() receives a string, in which the left and right line coordinates are written, then parses the string to a string array and draws the linear regression line on a chart:
void drawlr(string points)
  {
   string res[];
   StringSplit(points,' ',res);

   if(ArraySize(res)==2)
     {
      Print(StringToDouble(res[0]));
      Print(StringToDouble(res[1]));
      datetime temp[];
      CopyTime(Symbol(),Period(),TimeCurrent(),lrlenght,temp);
      ObjectCreate(0,"regrline",OBJ_TREND,0,TimeCurrent(),NormalizeDouble(StringToDouble(res[0]),_Digits),temp[0],NormalizeDouble(StringToDouble(res[1]),_Digits));
     }
The function is implemented in the OnTick() handler.
void OnTick() {
 socket=SocketCreate();
 if(socket!=INVALID_HANDLE) {
  if(SocketConnect(socket,"localhost",9090,1000)) {
   Print("Connected to "," localhost",":",9090);

   double clpr[];
   int copyed = CopyClose(_Symbol,PERIOD_CURRENT,0,lrlenght,clpr);

   string tosend;
   for(int i=0;i<ArraySize(clpr);i++) tosend+=(string)clpr[i]+" ";
   string received = socksend(socket, tosend) ? socketreceive(socket, 10) : "";
   drawlr(recieved); }

  else Print("Connection ","localhost",":",9090," error ",GetLastError());
  SocketClose(socket); }
 else Print("Socket creation error ",GetLastError()); }
Testing the MQL5-Python Client-Server application
To run the application, you need to have the Python interpreter installed. You can download it from the official website.
Then run the server application socketserver.py. It creates a socket and listens for new connections from the MQL5 program socketclientEA.mq5.
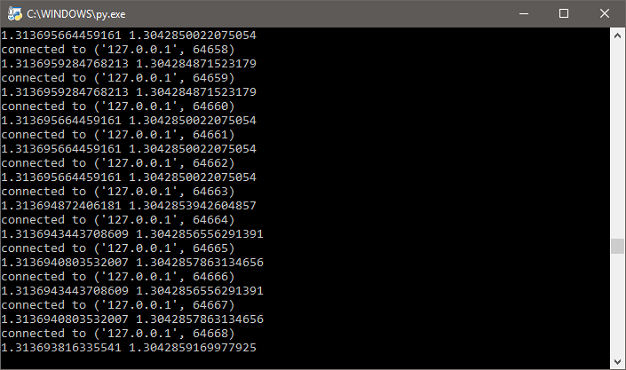
After a successful connection, the connection process and regression line prices are displayed in the program window. The prices are sent back to the client:
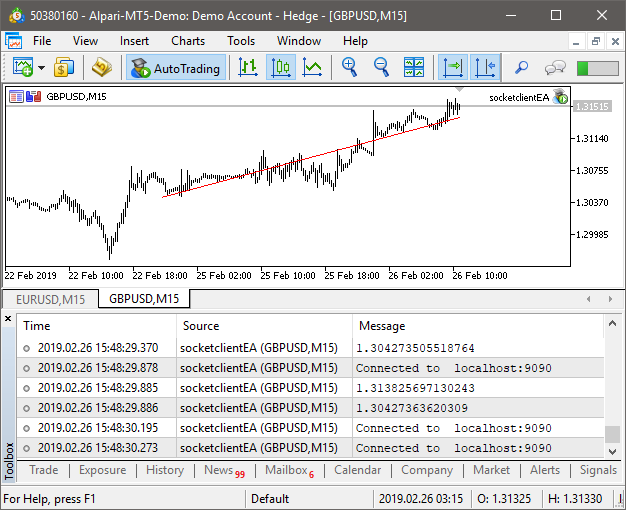
The connection activity and regression line prices are also displayed in the MetaTrader 5 terminal. Also the regression line is drawn on a chart and is further updated at each new tick:
We have considered the implementation of direct interaction of two programs via a socket connection. At the same time, MetaQuotes has developed a Python package, which allows receiving data directly from the terminal. For more details, please see the forum discussion related to the use of Python in MetaTrader (in Russian, so use the auto translation option).
Let us create a script to demonstrate how to receive quotes from the terminal.
Getting and analyzing quotes using MetaTrader 5 Python API
First you need to install the MetaTrader5 Python module (the summary of Python discussions is available here).
pip install MetaTrader5
Import it to the program and initialize connection to the terminal:
from MetaTrader5 import *
from datetime import date
import pandas as pd
import matplotlib.pyplot as plt

# Initializing MT5 connection
MT5Initialize()
MT5WaitForTerminal()

print(MT5TerminalInfo())
print(MT5Version())
After that create the list of desired symbols and successively request Close prices for each currency pair from the terminal to pandas dataframe:
# Create currency watchlist for which correlation matrix is to be plotted
sym = ['EURUSD','GBPUSD','USDJPY','USDCHF','AUDUSD','GBPJPY']

# Copying data to dataframe
d = pd.DataFrame()
for i in sym:
     rates = MT5CopyRatesFromPos(i, MT5_TIMEFRAME_M1, 0, 1000)
     d[i] = [y.close for y in rates]
Now we can disconnect from the terminal and then represent currency pair prices as percentage changes by calculating the correlation matrix and displaying it on the screen:
# Deinitializing MT5 connection
MT5Shutdown()

# Compute Percentage Change
rets = d.pct_change()

# Compute Correlation
corr = rets.corr()

# Plot correlation matrix
plt.figure(figsize=(10, 10))
plt.imshow(corr, cmap='RdYlGn', interpolation='none', aspect='auto')
plt.colorbar()
plt.xticks(range(len(corr)), corr.columns, rotation='vertical')
plt.yticks(range(len(corr)), corr.columns);
plt.suptitle('FOREX Correlations Heat Map', fontsize=15, fontweight='bold')
plt.show()
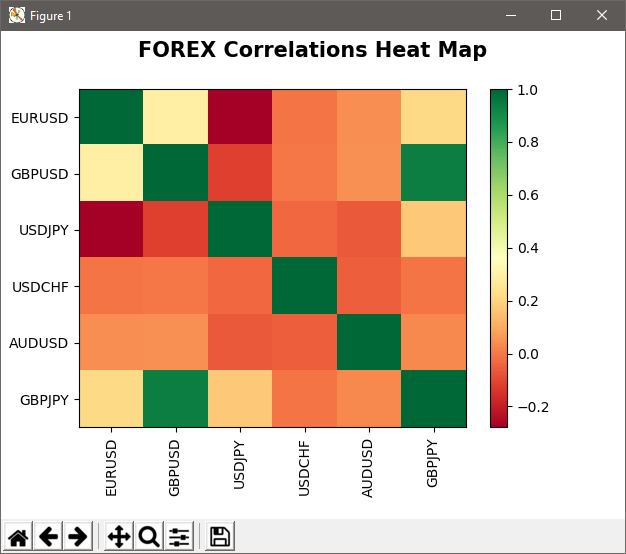
We can see a good correlation between GBPUSD and GBPJPY in the above heat map. Then we can test the co-integration by importing the statmodels library:
# Importing statmodels for cointegration test
import statsmodels
from statsmodels.tsa.stattools import coint

x = d['GBPUSD']
y = d['GBPJPY']
x = (x-min(x))/(max(x)-min(x))
y = (y-min(y))/(max(y)-min(y))

score = coint(x, y)
print('t-statistic: ', score[0], ' p-value: ', score[1])
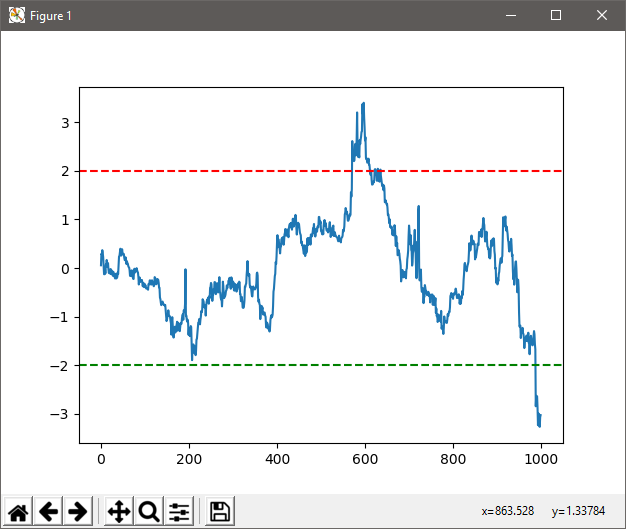
The relationship between two currency pairs can be displayed as a Z score:
# Plotting z-score transformation
diff_series = (x - y)
zscore = (diff_series - diff_series.mean()) / diff_series.std()

plt.plot(zscore)
plt.axhline(2.0, color='red', linestyle='--')
plt.axhline(-2.0, color='green', linestyle='--')

plt.show()
Visualizing market data using the Plotly library
It is often needed to visualize quotes in a convenient form. This can be implemented using the Plotly library, which also allows saving charts in the interactive .html format.
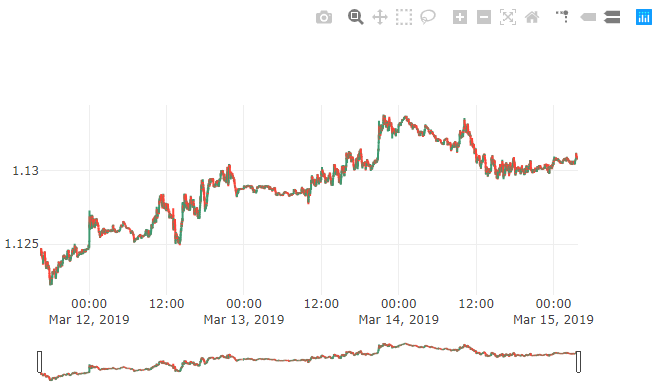
Let us download EURUSD quotes and display them in a candlestick chart:
# -*- coding: utf-8 -*-
"""
Created on Thu Mar 14 16:13:03 2019

@author: dmitrievsky
"""
from MetaTrader5 import *
from datetime import datetime
import pandas as pd
# Initializing MT5 connection
MT5Initialize()
MT5WaitForTerminal()

print(MT5TerminalInfo())
print(MT5Version())

# Copying data to pandas data frame
stockdata = pd.DataFrame()
rates = MT5CopyRatesFromPos("EURUSD", MT5_TIMEFRAME_M1, 0, 5000)
# Deinitializing MT5 connection
MT5Shutdown()

stockdata['Open'] = [y.open for y in rates]
stockdata['Close'] = [y.close for y in rates]
stockdata['High'] = [y.high for y in rates]
stockdata['Low'] = [y.low for y in rates]
stockdata['Date'] = [y.time for y in rates]

import plotly.graph_objs as go
from plotly.offline import download_plotlyjs, init_notebook_mode, plot, iplot

trace = go.Ohlc(x=stockdata['Date'],
                open=stockdata['Open'],
                high=stockdata['High'],
                low=stockdata['Low'],
                close=stockdata['Close'])

data = [trace]
plot(data)
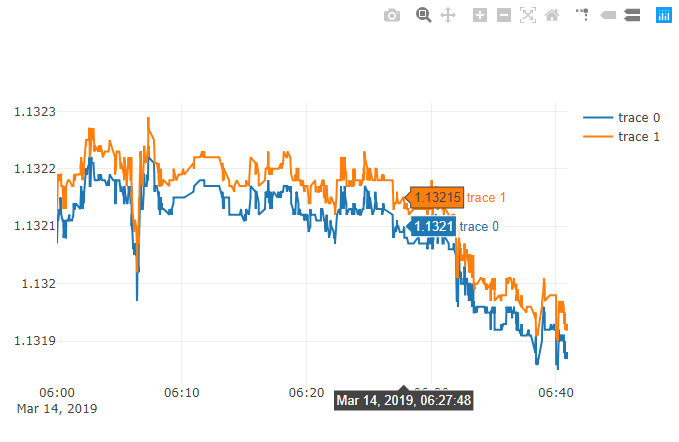
It is also possible to download and display any depth of the Bid and Ask history:
# -*- coding: utf-8 -*-
"""
Created on Thu Mar 14 16:13:03 2019

@author: dmitrievsky
"""
from MetaTrader5 import *
from datetime import datetime

# Initializing MT5 connection
MT5Initialize()
MT5WaitForTerminal()

print(MT5TerminalInfo())
print(MT5Version())

# Copying data to list
rates = MT5CopyTicksFrom("EURUSD", datetime(2019,3,14,13), 1000, MT5_COPY_TICKS_ALL)
bid = [x.bid for x in rates]
ask = [x.ask for x in rates]
time = [x.time for x in rates]

# Deinitializing MT5 connection
MT5Shutdown()

import plotly.graph_objs as go
from plotly.offline import download_plotlyjs, init_notebook_mode, plot, iplot
data = [go.Scatter(x=time, y=bid), go.Scatter(x=time, y=ask)]

plot(data)
Conclusion
In this article, we considered options for implementing communication between the terminal and a program written in Python, via sockets and directly using MetaQuotes' specialized library. Unfortunately, the current implementation of the socket client in MetaTrader 5 is not suitable for running in the Strategy Tester, so no full testing and measurement of the solution performance were performed. Let us wait for further updates of the socket functionality.
Translated from Russian by MetaQuotes Ltd.
Original article: https://www.mql5.com/ru/articles/5691
 Studying candlestick analysis techniques (Part II): Auto search for new patterns
- Free trading apps
- Over 8,000 signals for copying
- Economic news for exploring financial markets
You agree to website policy and terms of use
@Maxim Dmitrievsky
I just wanted to say thank you for making this available. I always wanted to be able to code my indicators in Python and since you began this thread I've been able to access realtime futures data and use it to develop and run my indicators. I use my Python to plot and analyze the live feed and I place trades through the MT5 platform - it works great. Please keep up the good work and I truly hope Python will be full embraced my the MT community.
Thank you and best regards!
Thank you for complete description.
i have a question:
is it possible for us to run a script of .ex5 type by a command in python environment?
i wanna run it through python, and the script save the results in an excel file, so can i use the excel data again in my website or android program.
Thanks a lot.
Hello - Can someone please help me!!!
I'm trying to execute this code in Python and keep getting an error:
Below is my code and it results in the error:
Thank you for this article.
Just wander why we need to keep calling socket=SocketCreate() and SocketClose() in OnTick()?
Seems a bit inefficient to repeatedly doing these.
Does it not keep the socket open/alive? Or rather is it possible keep the socket open/alive?