
MQL5 Wizard Techniques you should know (Part 48): Bill Williams Alligator
Introduction
The Alligator indicator, that was developed by Bill Williams with the premise that markets tend to trend strongly in any set direction for only about 15 – 30% of the time. It inherently is a trend following tool that helps traders identify market direction and potential fractals or turning points. This it achieves by using a set of three smoothed moving averages (SMAs) that are not only set at different averaging periods, but are also shifted forward by varying amounts.
These three SMAs are often referred to as the Jaws, Teeth, and Lips in reference to the mouth of an Alligator. These 3 averaging buffers help traders visualize the phases of the market, which typically include trending phases, consolidating phases and transitioning phases. When the 3 averages are in a tight range, this is often referred to as the alligator taking a nap, which would align with what Bill Williams directionless phase that he estimated to take up 85 – 70% of the time in most markets. The other portion, (the 15 – 30%) is marked by these three buffers diverging, a divergence that is always signified by a particular direction for either bullishness or bearishness. This phase is often labelled the waking up of the Alligator, and it is supposed to be when most traders should look to make a buck.
These are the formulae of the 3 SMAs. First, we have the Jaws:
![]()
Where:
- SMA 13 (Close) 13-period smoothed moving average of the closing price.
- Shift: The Jaw line is shifted forward by 8 periods to smooth the trend and allow anticipation of market direction.
Then the Teeth:
![]()
Where:
- SMA 8 (Close): 8-period smoothed moving average of the closing price.
- Shift: The Teeth line is shifted forward by 5 periods.
And finally, the Lips:
![]()
Where:
- SMA 5 (Close): 5-period smoothed moving average of the closing price.
- Shift: The Lips line is shifted forward by 3 periods.
The features exhibited by the Alligator can also be likened to a feeding cycle. If we start with the part where all three buffers are commingled or too close together, in this phase that is also known as the sleeping phase, markets are said to be consolidating or whipsawing. Williams likened this to a napping Alligator, and as hinted at in the intro this cycle phase is predominant, taking up most of the time, for most securities. What would follow this, then, would be ‘waking-up’.
In this stage of the cycle, the three SMAs begin to diverge or part ways, usually in an indicative direction. This means they all begin to trend in a specific direction as they start to part however their order, which when ascending should be lips-teeth-jaws and the reverse when descending, may not necessarily be adhered to yet. After waking, what follows next is the ‘feeding’.
During this phase of the cycle, the lines begin to diverge more cleanly and their order of lips-teeth-jaws in a bullish trend or jaws-teeth-lips in a bearish rout (ordering from the top) begins to take hold. Traders often view this as a good time to follow the direction of the trend since this is when most of the money will be made. It is the 3rd stage of the cycle, but it is not the final one, as the ‘satisfied’ stage follows it.
In this final stage, that is labelled the ‘satisfied’ stage, the three SMAs begin to converge. This conversion may signal that the trend is ending or entering a correction phase, and therefore either way, it could be a good idea for some traders to take some profits when this stage is signalled. The Alligator Indicator’s simplicity in construction makes it a relatively straightforward tool for understanding the market's current phase and potential shifts in direction, through solely studying smoothed moving averages. It therefore comes in handy when helping traders better time entries and exits.
With this backdrop, we delve into this indicator on a pattern by pattern basis as has been the case in previous alternate articles within these series, where we handled one specific common technical indicator at a time. We looked at the Ichimoku last in this piece, for readers that are new, where we reviewed 11 patterns then and for this article we have eight lined up. An indicator review on a pattern by pattern basis has the potential to reveal certain aspects of very common indicators that could have been overlooked by some traders and yet would be worthy of adding to their arsenal.
But perhaps more than that, they shade a spotlight on the relative weight and importance of all the key patterns a given indicator has to offer by honing traders’ skills on what to focus on and what to ignore. We tend to conclude these articles by optimizing for the relative weights of each and while it is possible to take such results into a live deployment environment, I would rather the weighting is manually set by the traders for each pattern based on their own experience, even though their optimized test results may be cross validated.
The attached code is meant to be used with the MQL5 wizard to assemble an Expert Advisor, and there are guides here and here for new readers on how to accomplish that. This assembled Expert Advisor can be used with only one pattern at a time, as was mentioned in the earlier introductory articles on these indicators. Because each pattern is indexed from zero to the total number of patterns minus one, which comes to seven in our case, we can control which patterns get used by an input parameter labelled m_patterns_usage, and it's inherited from the parent class to our custom signal class.
In order to use just one of the available patterns, the set index for this input parameter would be two to the power of the pattern’s index. So, to use pattern-0 only, this input would be assigned 2^0 which is 1, while for pattern-5 only that would be 2^5 which comes to 32, and so on. This same input parameter can allow for the multiple selection and use of patterns as mentioned above and this is what we tackle in the final part of this article and because there are many possible combinations even for a small number of patterns, 8, in our case readers can understand that when any integer that is not in the 2^0, 2^1,… 2^n series is used, and it is less than the limit of the maximum value of the m_patterns_usage input parameter, then that value implies more than one pattern is being used. The limit for m_patterns_usage in our case, given that we are using only 8 patterns, is 255. Let’s get into the patterns.
Alligator Awakening (Crossover Signal)
This is perhaps the principal pattern of the Alligator indicator, and as one would expect it deals with the most interesting stage of the Alligator cycles, the beginning of the feasting stage, that is referred to here as the awakening. Its signal is based on the lips, teeth, and jaws when they cross each other, indicating a potential shift in trend or direction.
The bullish crossover is when the green lips line crosses above the red teeth and blue jaws lines; this often signals the start of an upward trend. Conversely, the bearish crossover is when the green lips line crosses below the red teeth and the blue jaws lines, indicating the beginning of a downward trend. We implement this in MQL5, as follows:
//+------------------------------------------------------------------+
//| Check for Pattern 0.                                             |
//+------------------------------------------------------------------+
bool CSignalAlligator::IsPattern_0(ENUM_POSITION_TYPE T)
{  if(T == POSITION_TYPE_BUY && Lips(X() + 1) < Jaws(X() + 1) && Lips(X()) > Jaws(X()))
   {  return(true);
   }
   else if(T == POSITION_TYPE_SELL && Lips(X() + 1) > Jaws(X() + 1) && Lips(X()) < Jaws(X()))
   {  return(true);
   }
   return(false);
}
This marks our pattern-0, and to perform test runs with just this pattern, our input parameter m_patterns_usage needs to be set to 1. If we do this and try to optimize for some of the other Expert Advisor in an effort to demonstrate the trade potential of this pattern, we get the following report from some of the favourable results:
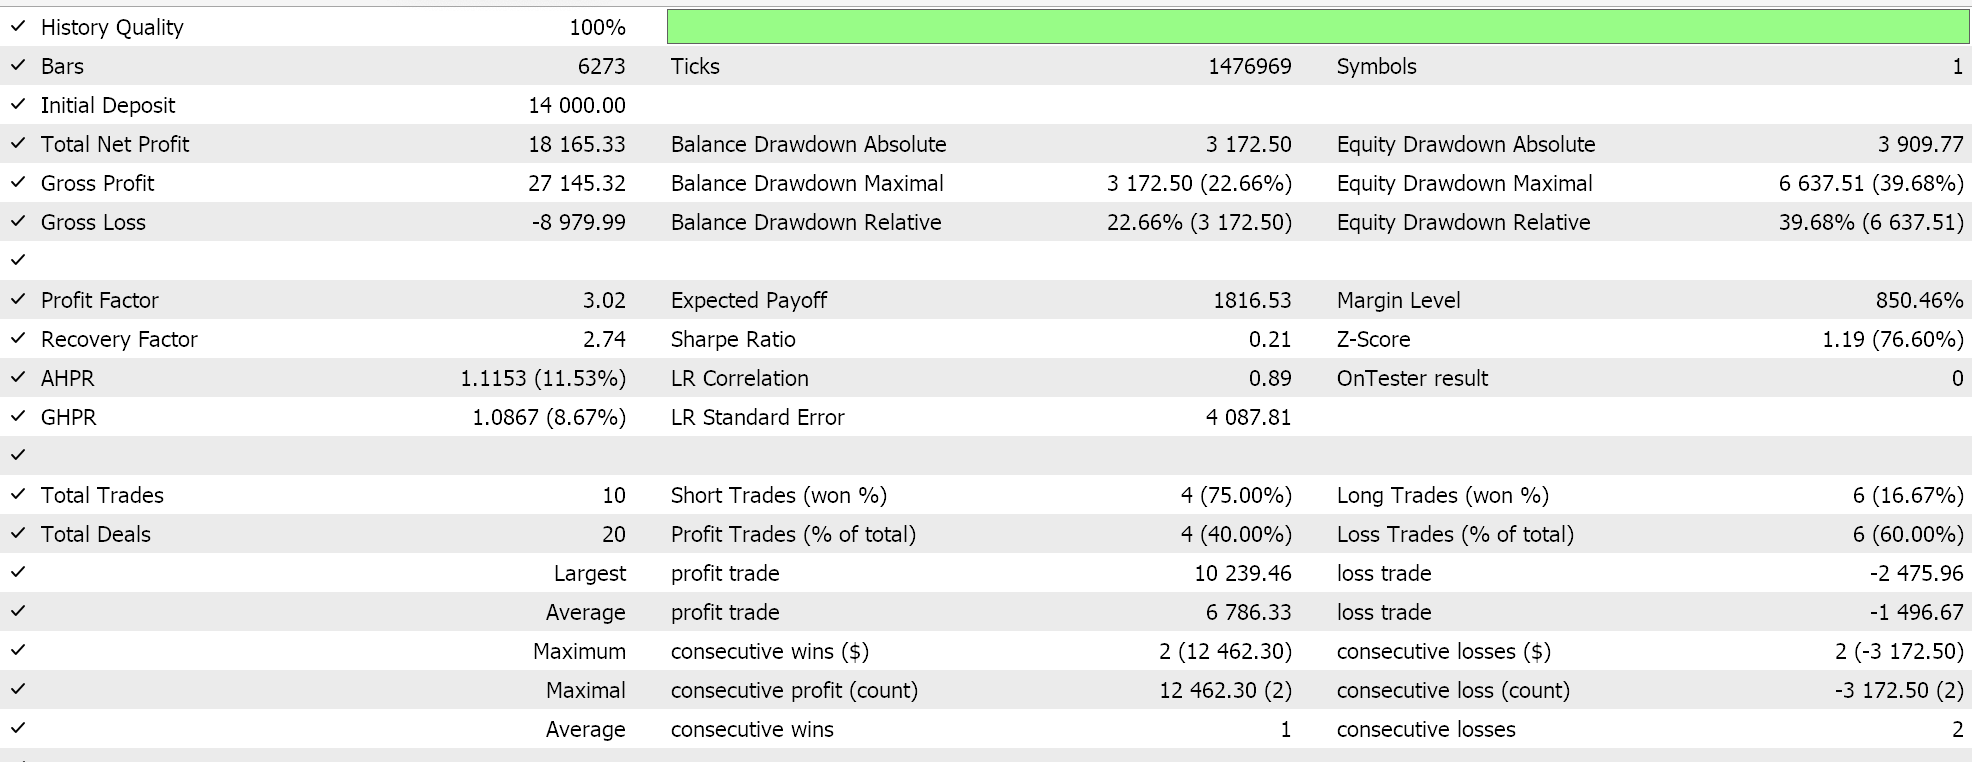
Our test settings for this are USD CHF on the hourly time frame for the year 2023. These results are principally from optimizing the pattern’s threshold weight, as well as the open and close condition thresholds. We trade with pending orders, have a take profit level but no stop loss. These are certainly not ideal conditions, but they serve the purpose of demonstrating patern-0 in action.
Alligator Eating (Trend Following)
Our second pattern, pattern-1, deals with the meat and potatoes of the Alligator signal with the lips, teeth, and jaws lines being aligned and moving apart in a set direction to a particular trend. This is the eating stage of the Alligator cycles, with the bullish eating being defined when the green lips are above the red teeth, which would be above the blue jaws. These lines, though all pointing upward, would be diverging as well given not just their different averaging periods but also their different offsets. When all these features are ticked off, it would indicate a very strong bullish trend.
Bearish eating on the other hand is registered if the green lips are below the red teeth, which in turn would be below the blue jaws, again with all 3 SMAs heading down in a divergent (non-parallel) pattern. Observing of all these features, as with the bullish, would indicate a strong bearish signal. We implement this in MQL5 as follows:
//+------------------------------------------------------------------+
//| Check for Pattern 1.                                             |
//+------------------------------------------------------------------+
bool CSignalAlligator::IsPattern_1(ENUM_POSITION_TYPE T)
{  if(T == POSITION_TYPE_BUY && Lips(X()) > Teeth(X()) && Teeth(X()) > Jaws(X()))
   {  return(true);
   }
   else if(T == POSITION_TYPE_SELL && Lips(X()) < Teeth(X()) && Teeth(X()) < Jaws(X()))
   {  return(true);
   }
   return(false);
}
Test results from an optimization stint on the similar settings as pattern-0 of the forex pair USD CHF, 1-hour time frame, year 2023, do give us the following results:

Gator Oscillator Signals
Besides the Alligator indicator, Bill Williams is also responsible for the Gator oscillator, which is a histogram projection in oscillator form of the differences between the three SMA buffers of the Alligator indicator. The inbuilt indicator in MQL5 for the Gator oscillator is a bit buggy because the Gator oscillator is inherently unorthodox. Its outputs are 4-fold, two double values and two-colour values. Since the formula definitions behind these are well known, we perform our own custom implementation of this within our custom signal class as follows:
   //
   double            Upper(int ind)
   {                 return(fabs(Jaws(ind) - Teeth(ind)));
   }
   color             UpperColor(int ind)
   {                 return(Upper(ind) >= Upper(ind + 1) ? clrGreen : clrRed);
   }
   double            Lower(int ind)
   {                 m_gator.Refresh(-1);
      return(-fabs(Teeth(ind) - Lips(ind)));
   }
   color             LowerColor(int ind)
   {                 m_gator.Refresh(-1);
      return(fabs(Lower(ind)) >= fabs(Lower(ind + 1)) ? clrRed : clrGreen);
   }
   //
This pattern, pattern-2, is our 3rd pattern, and it combines signals from the Gator oscillator which we’ll read from our customized functions as derived from the Alligator indicator. With that said, the bullish gator expansion is when green bars in the gator oscillator expand to the upside, indicating a strengthening trend. Conversely, the bearish gator expansion is when red bars are expanding to the downside, suggesting a strengthening bearish trend. As a corollary, mixed red and green bars often mark a market consolidation or trend weakening. We implement pattern-2 in MQL5 as follows:
//+------------------------------------------------------------------+
//| Check for Pattern 2.                                             |
//+------------------------------------------------------------------+
bool CSignalAlligator::IsPattern_2(ENUM_POSITION_TYPE T)
{  if(T == POSITION_TYPE_BUY && UpperColor(X()) == clrGreen  && LowerColor(X()) != clrRed)
   {  return(true);
   }
   else if(T == POSITION_TYPE_SELL  && LowerColor(X()) == clrRed  && UpperColor(X()) != clrGreen)
   {  return(true);
   }
   return(false);
}
Test runs from a favourable optimization stint results do give us the following report:

This is with similar test settings above of symbol USD CHF, 1-hour time frame, year-2023. These results are not cross validated and only demonstrate trade potential of pattern 2. We tested the Expert Advisor with only pattern-2 by assigning the m_patterns_usage input parameter the integer value 4 as explained above in the introduction.
Jaw-Lips and Teeth-Lips Divergence
This pattern is our fourth and it is indexed pattern-3. It evolves around the difference in direction or gap size between the jaw-lips or teeth-lips. The bullish divergence is if the lips (green-line) begin moving away from the teeth (red-line) & the jaw (blue-line) after a period of whipsawing. This essentially serves as an early indicator of a potential bullish trend. Conversely, the bearish divergence is if the lips begin moving away from the jaw and teeth in a downward direction, which often portends a market rut. We implement this in MQL5 as follows:
//+------------------------------------------------------------------+
//| Check for Pattern 3.                                             |
//+------------------------------------------------------------------+
bool CSignalAlligator::IsPattern_3(ENUM_POSITION_TYPE T)
{  if(T == POSITION_TYPE_BUY && Lips(X()) - fmax(Teeth(X()), Jaws(X())) > Lips(X() + 1) - fmax(Teeth(X() + 1), Jaws(X() + 1)))
   {  return(true);
   }
   else if(T == POSITION_TYPE_SELL && fmin(Teeth(X()), Jaws(X())) - Lips(X()) > fmin(Teeth(X() + 1), Jaws(X() + 1)) - Lips(X() + 1))
   {  return(true);
   }
   return(false);
}
Testing with identical settings as used in all the patterns mentioned above does give us the following results from some of the favourable settings obtained from a brief optimization stint:

Alligator Awakening After Sleep
Pattern-4, our fifth, is meant to unfold after a considerable period of consolidation or the Alligator sleeping. This is characterized with the lips, teeth, and jaws beginning to untangle. For the trading strategy therefore, the bullish signal is after a long period of Alligator sleeping, if the lips, teeth, and jaws start to diverge to the upside, this could be a sign of a bullish breakout. On the flip side, the bearish signal is if the same 3 lines begin diverging downward after an extended period of convergence, this potentially indicates a bearish breakout. We implement this as follows in MQL5:
//+------------------------------------------------------------------+
//| Check for Pattern 4.                                             |
//+------------------------------------------------------------------+
bool CSignalAlligator::IsPattern_4(ENUM_POSITION_TYPE T)
{  if(Range(X() + 3) <= Spread(X() + 3) && Range(X() + 8) <= Spread(X() + 8))
   {  if(T == POSITION_TYPE_BUY && Lips(X()) > Lips(X() + 3) && Teeth(X()) > Teeth(X() + 3) && Jaws(X()) > Jaws(X() + 3))
      {  return(true);
      }
      else if(T == POSITION_TYPE_SELL && Lips(X()) < Lips(X() + 3) && Teeth(X()) < Teeth(X() + 3) && Jaws(X()) < Jaws(X() + 3))
      {  return(true);
      }
   }
   return(false);
}
When we test for just this pattern with similar symbol, and time frame settings as above with the other patterns, having assigned the m_patterns_usage parameter the value 16, we do get the following results:

Breakout Confirmation
Our pattern-5 develops its signal from price moves in the same direction as the Alligator lines, with a continuation that does not have a strong retracement. For this pattern, a bullish breakout is if price is above the Alligator lines and all three lines are sloping upwards, suggesting the continuation of the buying position. It is not marked by any major change in price per se. Likewise, a bearish ‘breakout’ is if price is below the Alligator lines, and all three lines are sloping downward, which would signal to continue selling. We implement this in MQL5 as follows:
//+------------------------------------------------------------------+
//| Check for Pattern 5.                                             |
//+------------------------------------------------------------------+
bool CSignalAlligator::IsPattern_5(ENUM_POSITION_TYPE T)
{  if(T == POSITION_TYPE_BUY && Close(X()) > Lips(X()) && Lips(X()) > Lips(X() + 3) && Teeth(X()) > Teeth(X() + 3) && Jaws(X()) > Jaws(X() + 3))
   {  return(true);
   }
   else if(T == POSITION_TYPE_SELL && Close(X()) < Lips(X())  && Lips(X()) < Lips(X() + 3) && Teeth(X()) < Teeth(X() + 3) && Jaws(X()) < Jaws(X() + 3))
   {  return(true);
   }
   return(false);
}
To trade with the wizard assembled Expert Advisor while using only this pattern, we would need to assign the input parameter m_patterns_usage the value 32. From inputs this parameter, that is inherited from the parent class of our custom signal class, is labelled “Patterns Used Bitmap”. Test runs with favourable input settings from a quick optimization that uses similar settings as the patterns above that have been mentioned does give us the following report:

Volatility Signals
This bonus pattern, though not formally coded and tested like the rest, can be defined if one pairs prevalent price action trends with the Alligator range(s). The prime thesis behind it is that the overall Alligator range, which we define in the following function;
   double            Range(int ind)
   {                 return(fmax(fmax(Jaws(ind), Teeth(ind)), Lips(ind)) - fmin(fmin(Jaws(ind), Teeth(ind)), Lips(ind)));
   }
Is a proxy for volatility. High volatility therefore is when the jaws, teeth, and lips are far apart, which would indicate that the prevalent trend is very strong and justified. A check on the prevalent price trend would help establish if a bullish signal (rising prices) or bearish signal (falling prices) should be inferred. Low volatility, on the other hand, would not mark any signal necessarily; however, it could be used to determine when to exit open positions. It would be implied though when the three SMA buffers are close together, which often signals range bound activity and is also usually used as a precaution to await entry into the markets. For open positions though this could present an opportunity to exit, and further more if the price trend is intact, with the drop, in volatility happening recently, opening of reverse positions may be implied. To this end, a bullish price trend on waning to low volatility could portend a bearish signal, in the same way that a bearish price trend in similar conditions could indicate a bullish greenlight. This pattern would arguably be less certain than the others, and therefore readers who wish to code and implement this should perhaps pair it with other signals.
Alligator Lips Retracement Signal
Pattern-6, is our seventh, and it involves the lips' retracement towards the teeth or jaws without fully making a cross. The trading strategy with this therefore is, a bullish retracement is if the lips line moves towards the teeth and jaws but then rebound upwards without crossing, indicating potential continuation of the bullish trend. And as expected, a bearish retracement would be if the lips move towards the teeth and jaws, rebound without crossing and thus set up a potential continuation of the downward trend. We implement this in MQL5 as follows:
//+------------------------------------------------------------------+
//| Check for Pattern 6.                                             |
//+------------------------------------------------------------------+
bool CSignalAlligator::IsPattern_6(ENUM_POSITION_TYPE T)
{  if(T == POSITION_TYPE_BUY && Lips(X()) > Lips(X()+1) && Lips(X()+1) < Lips(X()+2) && Lips(X()) > Teeth(X()) && Lips(X()+1) > Teeth(X()+1) && Teeth(X()) > Jaws(X()))
   {  return(true);
   }
   else if(T == POSITION_TYPE_SELL && Lips(X()) < Lips(X()+1) && Lips(X()+1) > Lips(X()+2) && Lips(X()) < Teeth(X()) && Lips(X()+1) < Teeth(X()+1) && Teeth(X()) < Jaws(X()))
   {  return(true);
   }
   return(false);
}
To use the Expert Advisor with just pattern-6, one would assign the input parameter “Patterns-Used-Bitmap”, the integer value 64 which corresponds to 2 to the power 6, the index of our pattern. If we optimize our Expert with just using this pattern, one of the favourable input settings we get present us with the report below:
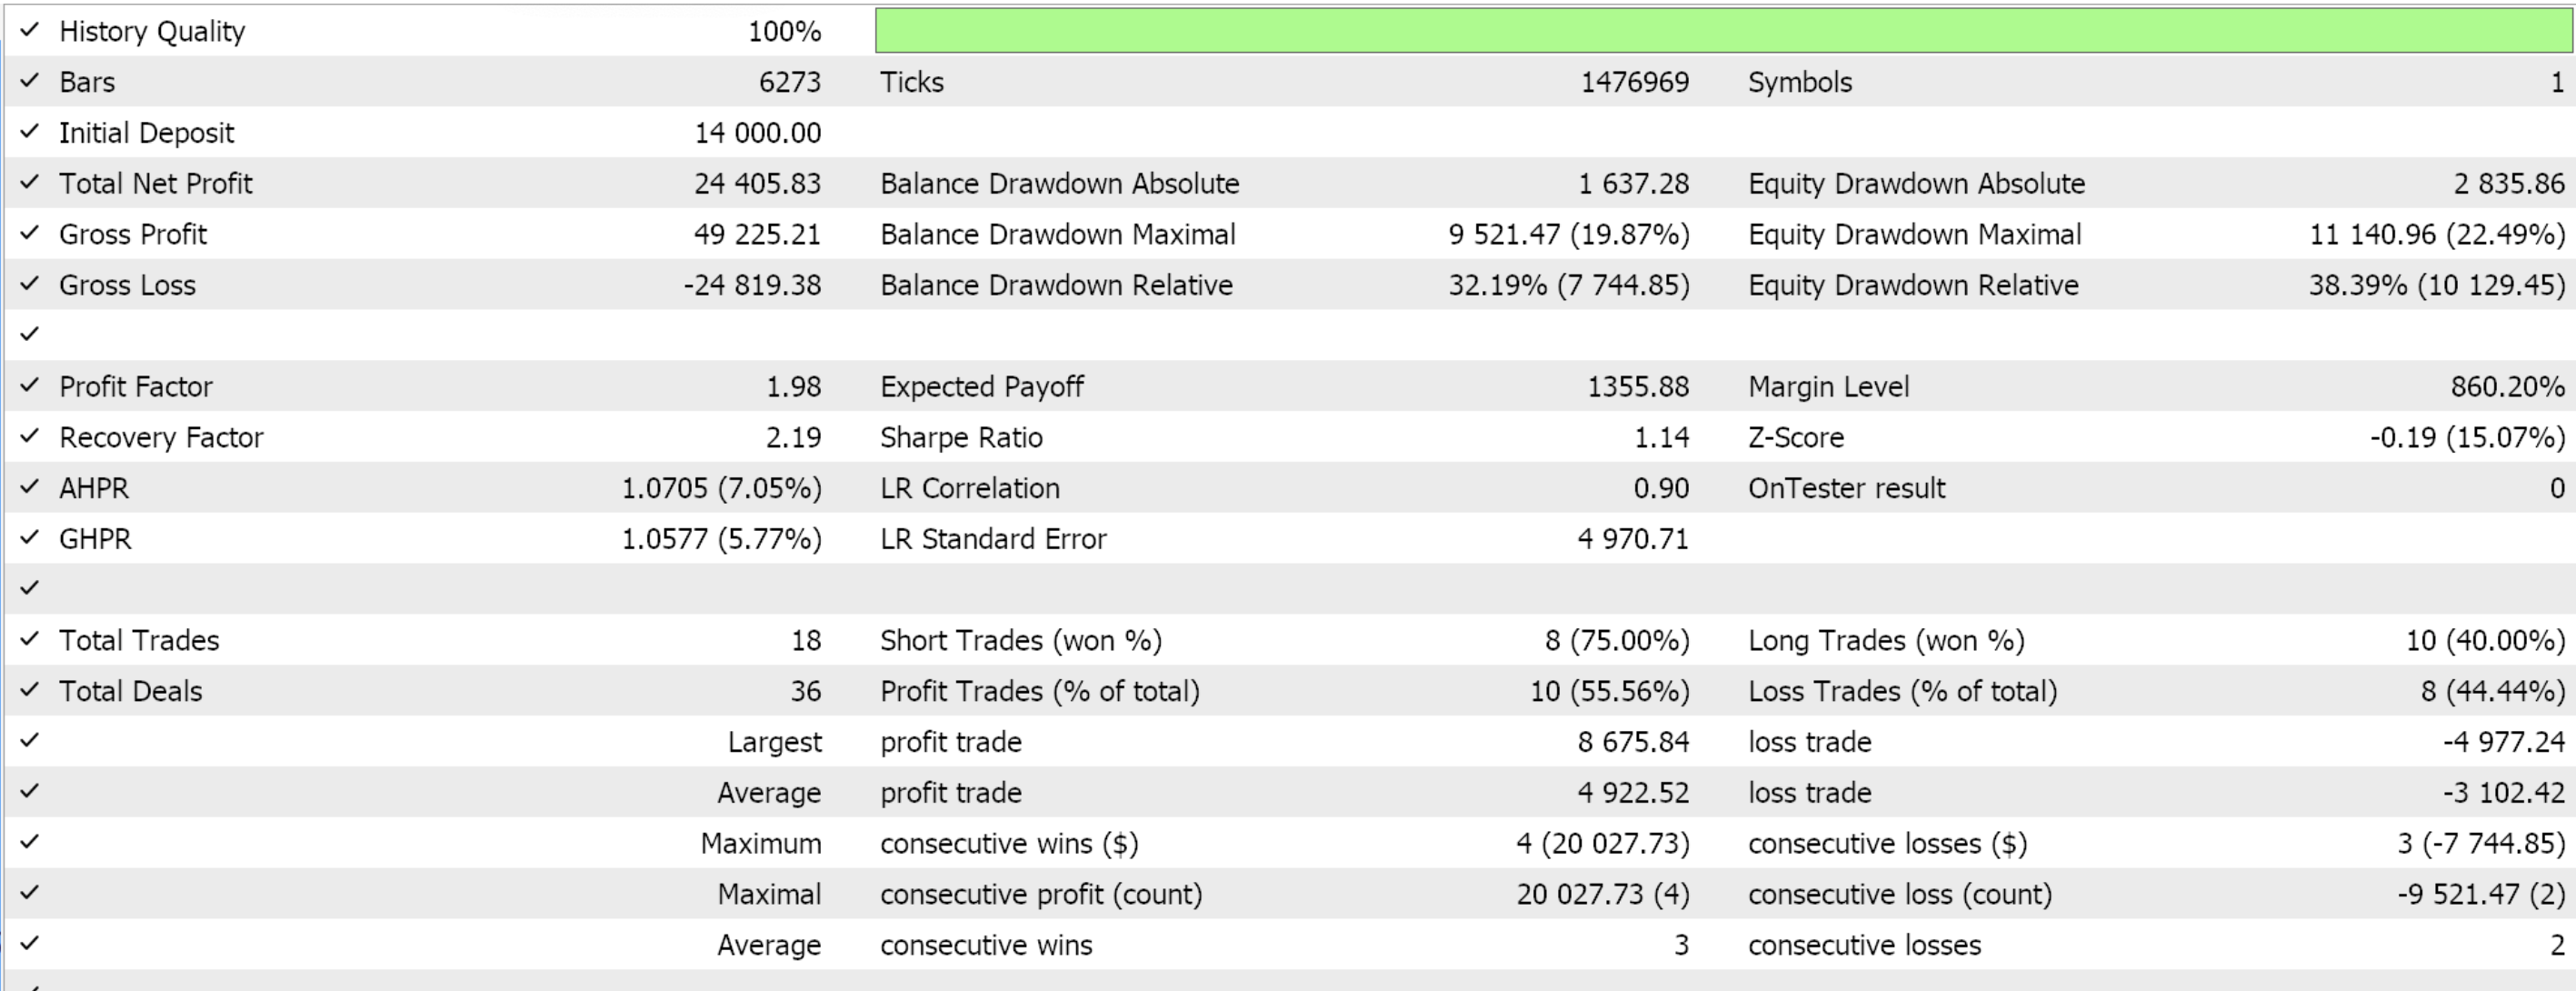
As already mentioned, this is not cross validated, but is only shown here to demonstrate trade potential/ ability for pattern-6.
Fake-out Prevention
Our final pattern, pattern-7, stems from observing the Alligator’s jaws, teeth, and lips to see if they do remain aligned amidst a market breakout. The goal here is fake-out prevention. The trading strategy therefore is that a bullish fake-out prevention is registered if a bullish breakout occurs, but the Alligator’s lines do not diverge significantly, potentially suggesting a fake-out, in that the market may reverse and thus fall again. Conversely, a bearish fake-out prevention is deemed when Alligator lines stay close together in a mirrored price breakout on the downside, which typically would mean traders need to refrain from entering a short position. These fake-outs do in a sense imply signals of their opposite, and to this end we implement this pattern in MQL5 as follows:
//+------------------------------------------------------------------+
//| Check for Pattern 7.                                             |
//+------------------------------------------------------------------+
bool CSignalAlligator::IsPattern_7(ENUM_POSITION_TYPE T)
{  if(Range(X()) <= Spread(X()))
   {  if(T == POSITION_TYPE_BUY && Close(X()) < fmin(fmin(Jaws(X()), Teeth(X())), Lips(X())) && Close(X()+1) > fmin(fmin(Jaws(X()+1), Teeth(X()+1)), Lips(X()+1)))
      {  return(true);
      }
      else if(T == POSITION_TYPE_SELL && Close(X()) > fmax(fmax(Jaws(X()), Teeth(X())), Lips(X())) && Close(X()+1) < fmax(fmax(Jaws(X()+1), Teeth(X()+1)), Lips(X()+1)))
      {  return(true);
      }
   }
   return(false);
}
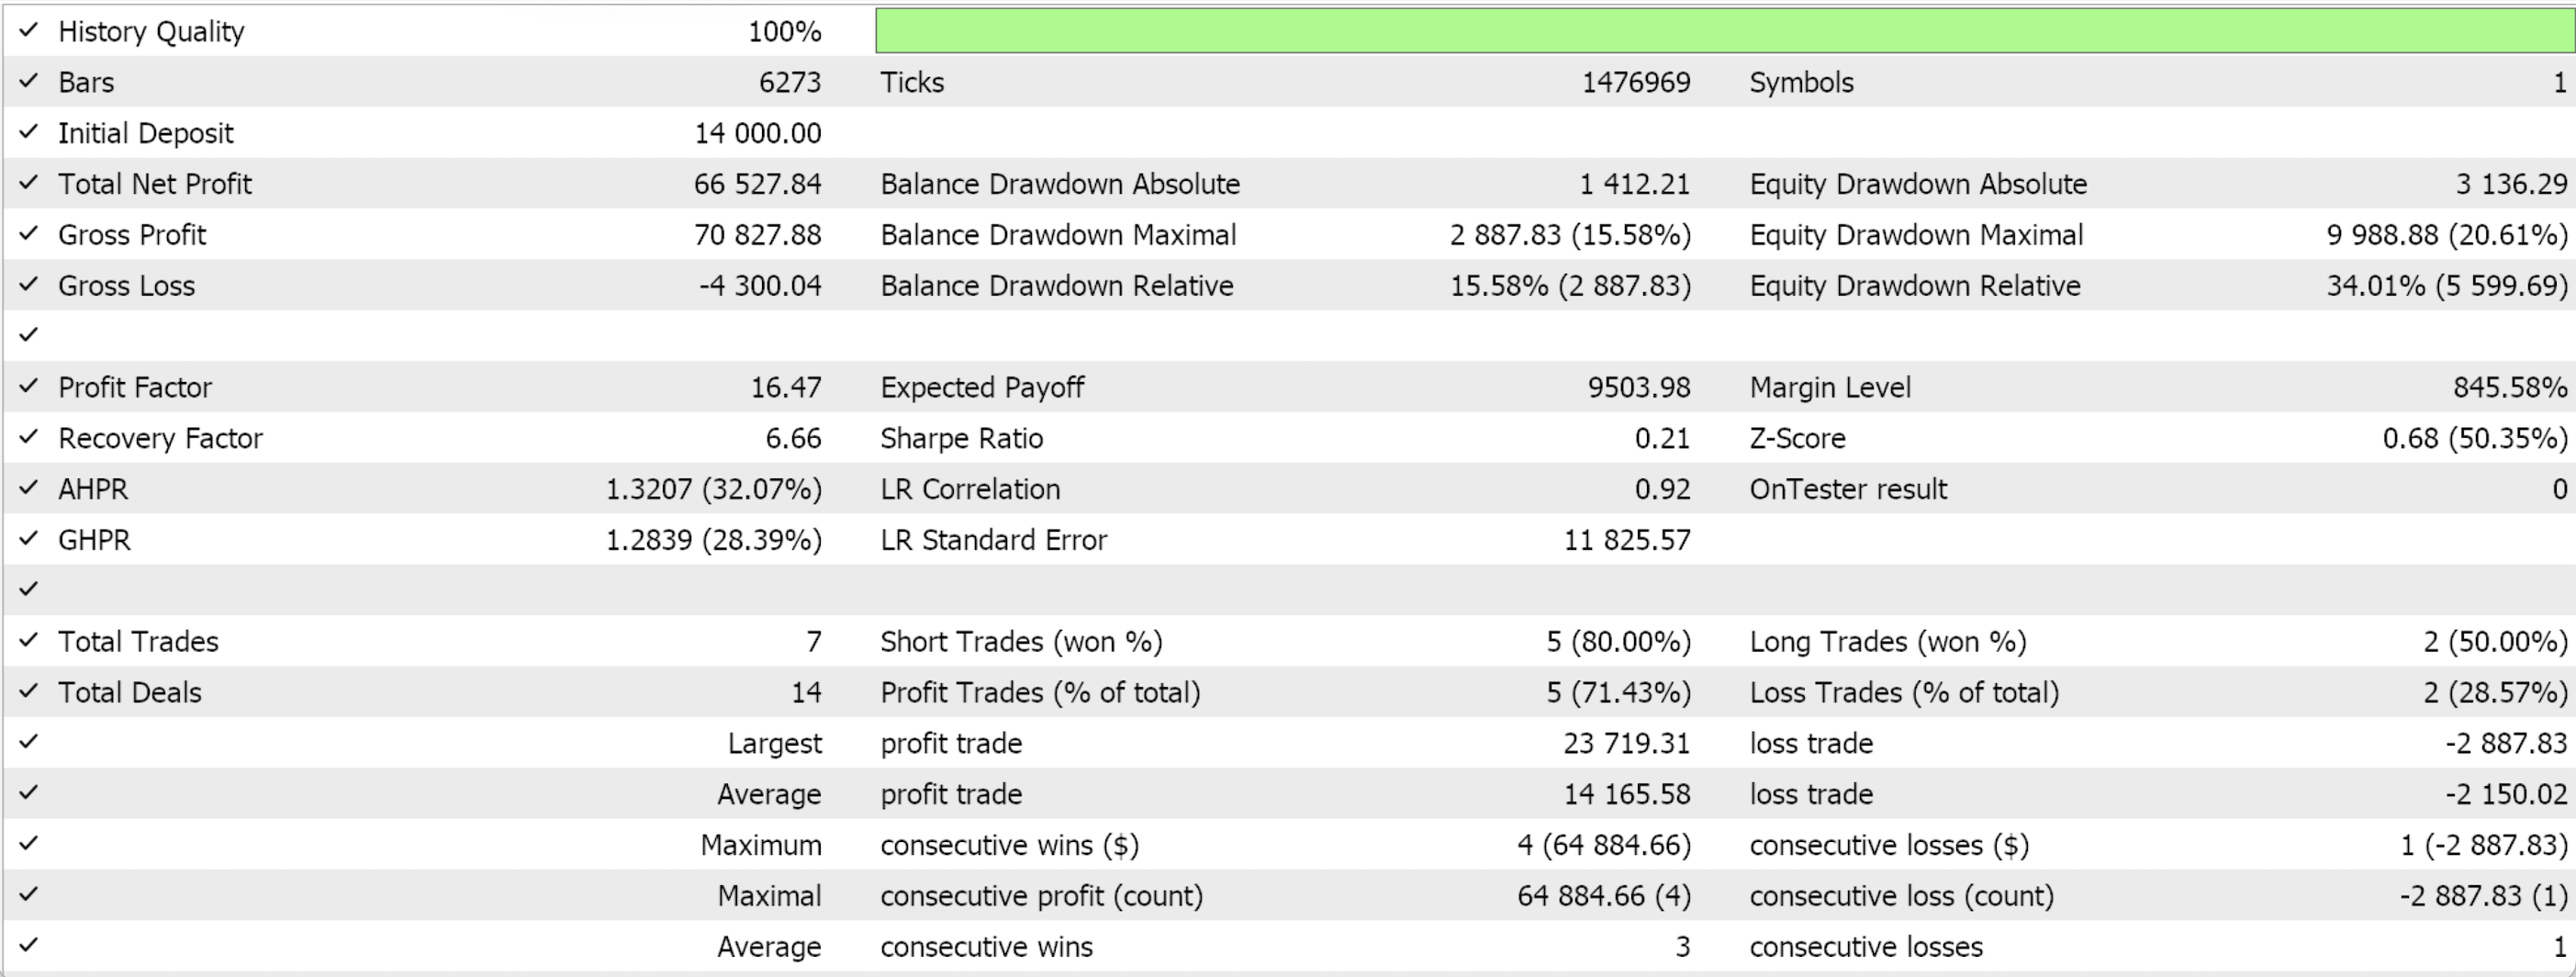
Using just this pattern with our Expert Advisor requires the patterns used input is assigned the integer 128, which if done, and we optimize with similar settings as on the other patterns above of symbol USD CHF, time frame 1-hour, and test period 2023, we are given the following report when using some of the recommended input settings:
Combining all the patterns
The combination and potential us of all patterns in the Expert Advisor does raise the debate of whether this is suitable or traders should stick to a single pattern. I have cautioned against using optimized weights for various patterns in live accounts, as I feel it is best if the weighting is set as a constant by the trader based on his own experience with the respective indicator. However, there are other points to consider in this discourse.
First up is the argument of contextual awareness versus simplicity. If this indicator, the Alligator, is relatively new to you, the case could be made that tracking multiple patterns allows for a more nuanced understanding of the market’s full cycle as it relates to the Alligator; which in this case is: consolidation, trend-beginning, trend-continuation, and trend-ending. This could provide insights into subtle shifts in the phases when transitioning, not to mention the probable risk reward profile of each phase.
Observation and garnering of this information would probably be ideal in a manual trade setting, which is not necessarily what we are looking to exploit with these series. The argument for simplicity though dwells on the fact that focusing on just one pattern, like the “feeding” or trending phase, helps simplify decision-making. And when trading manually this can be a crucial argument, however since we intend to use an Expert Advisor this is not a big concern, especially if you consider that even the compute & memory resources involved in this are minuscule.
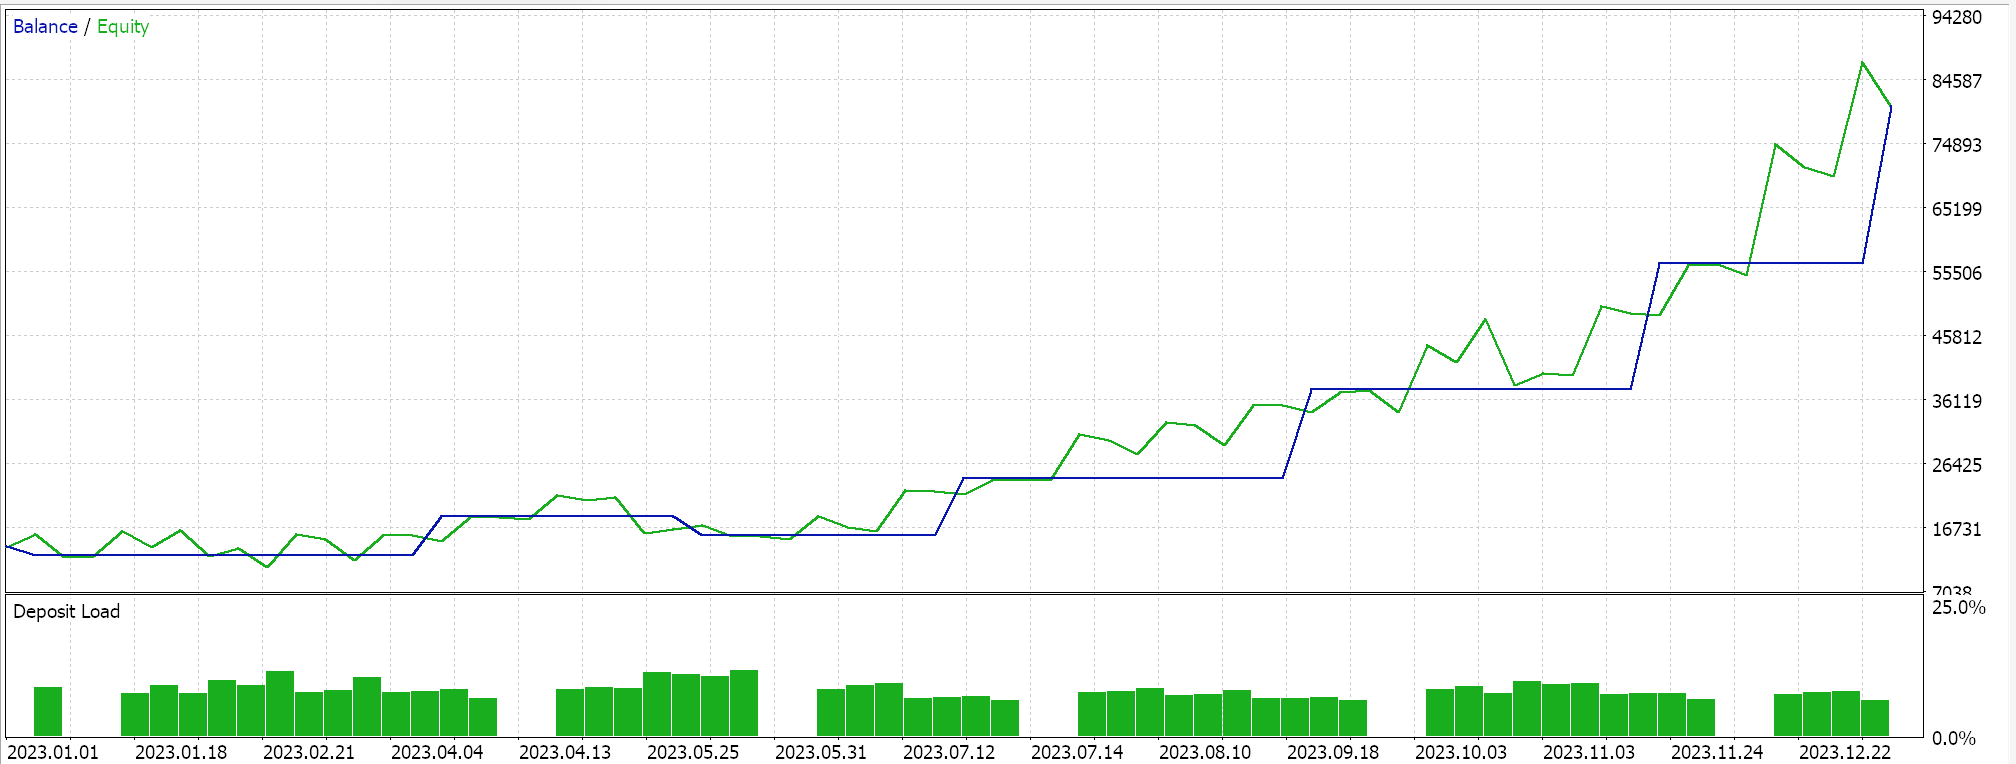
So, to sum up it could be stated that the multi-pattern approach is suitable for exploration and learning and that the focused route is suitable once traders are versed with what works, how and why. These arguments and cautions notwithstanding, we do optimize for the various patterns to discover which relative weighting would work best when they are all combined. In doing so, since we are looking to use multiple patterns, the input ‘Pattern's Used Bitmap’ gets optimized in the range 0 to 255. The results from some of the favourable input parameters from this optimization do give us the following report:
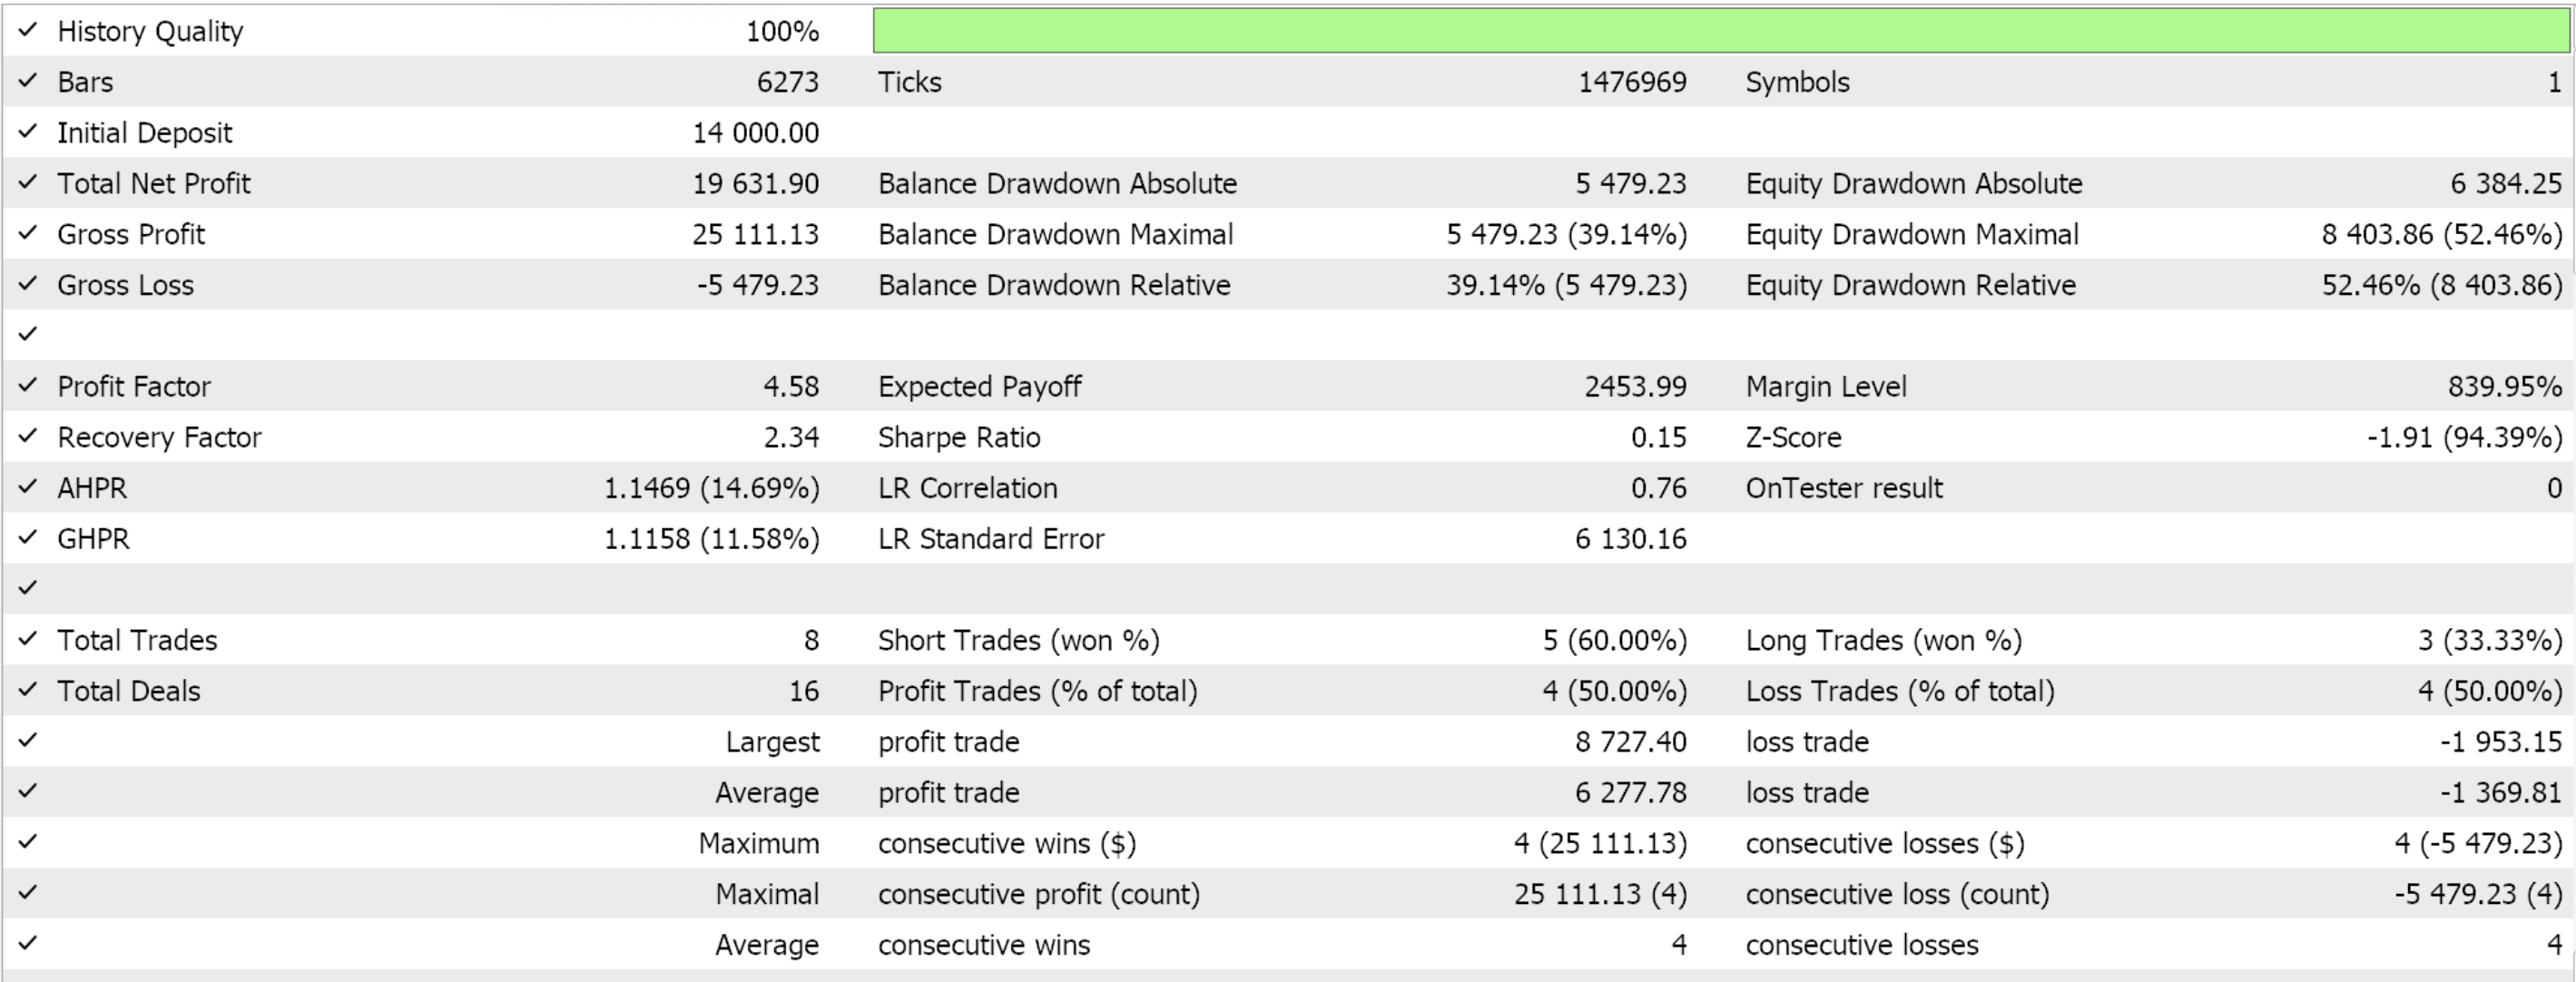
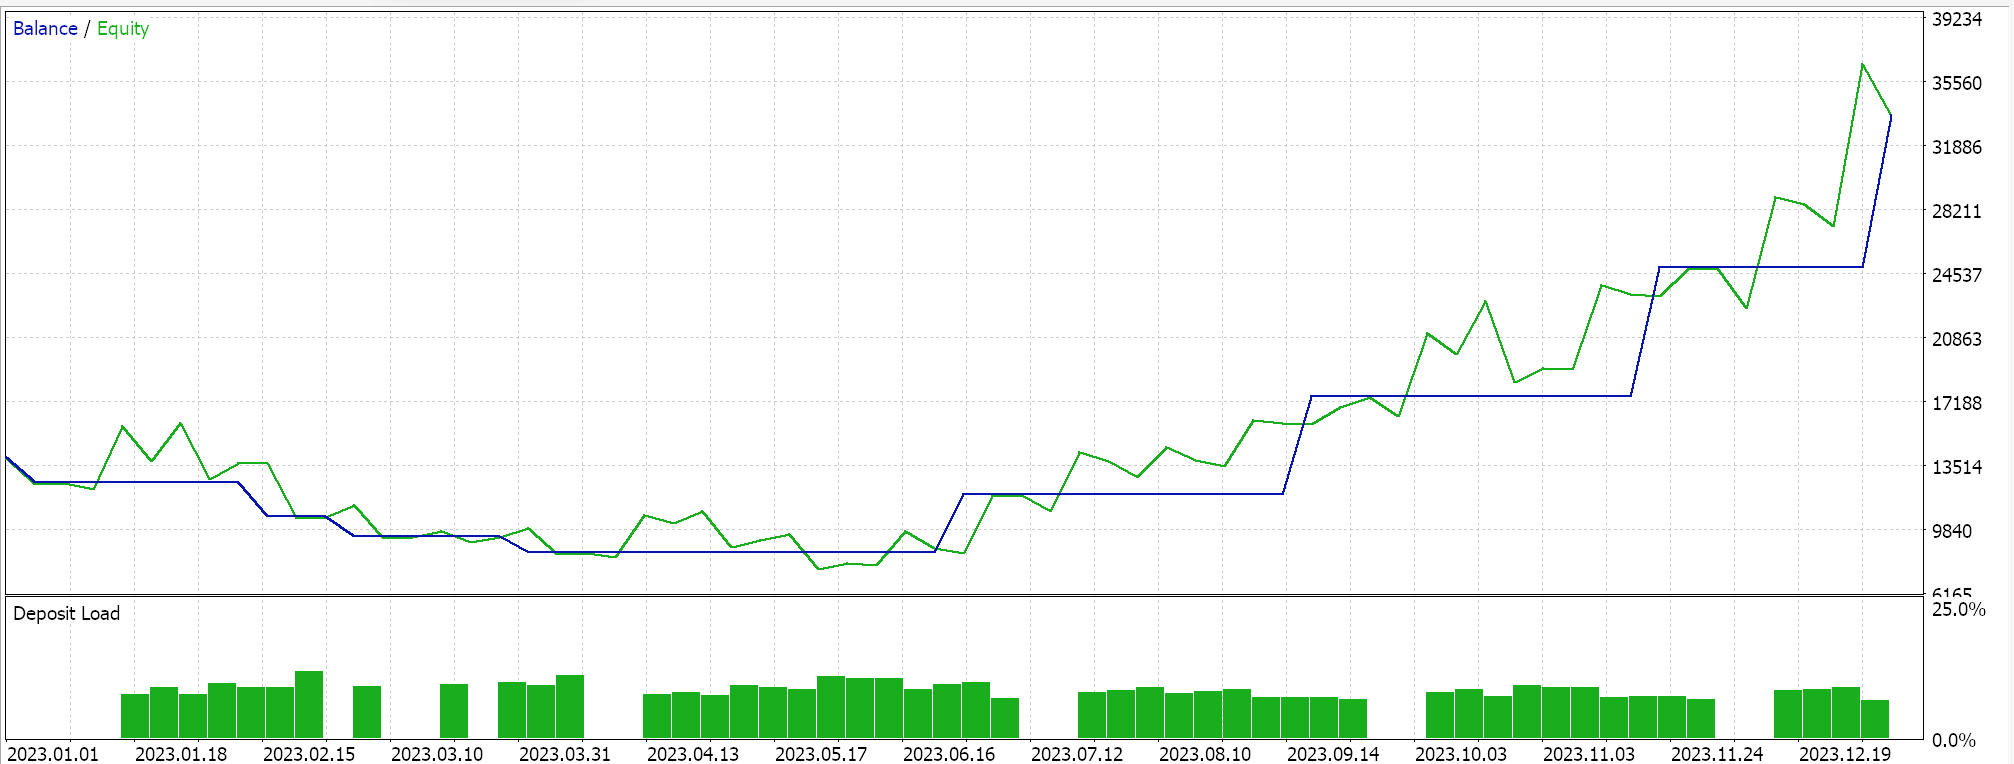
We, again, are using the 1-hour time frame for the year 2023 on the symbol USD CHF, as we have been with all the patterns that we tested on an individual basis above.
Conclusion
We have examined another indicator, Bill Williams’ Alligator, in a custom signal class on a pattern by pattern basis with the goal of getting a sense of the relative importance of each pattern and also an opinion on whether the combined use of all its patterns is more fruitful than the individual use of each; the argument that ‘the sum is greater than the parts’. While in this case, our spurt of test-reports do indicate that “less is more” given the underwhelming report when we combined all the patterns, extensive testing over longer periods that span outside our test window, the year 2023, need to be performed before definitive conclusions can be drawn.
 Developing a Replay System (Part 52): Things Get Complicated (IV)
 Developing a multi-currency Expert Advisor (Part 13): Automating the second stage — selection into groups
 Visualizing deals on a chart (Part 2): Data graphical display
 Client in Connexus (Part 7): Adding the Client Layer
- Free trading apps
- Over 8,000 signals for copying
- Economic news for exploring financial markets
You agree to website policy and terms of use
Hi @stephenNJUKI,
Thanks for sharing the great piece of code. Would you mind showing the settings that you use to achieve the backtest results shown in the article?
When I'm running the EA, it is trading non-stop making 3943 trades per year and seem to disregard the signal completely.
I'm particularly interested in pattern 2. It is clear that bitmask for it will be 4 but what about other values?
A growing number of people keep asking me about input settings, well the thing is I never hold onto them. What I always try to share within the article is the name of the traded pair, time frame used, and test-year (I usually test over just a single year)
The input settings are always from a short optimisation stint, are not cross validated, and therefore strictly speaking are not worth sharing.
The purpose of putting out the test reports is simply to demonstrate trade-ablity & use of the signal, nothing more. The work of looking for cross validated settings is always left up to the reader.